
 Login Sign Up


| |||||
 |  | ||||

| 12Stocks.com Market Intelligence |
Best SmallCap Stocks
|
| In a hurry? Small Cap Stock Lists: Performance Trends Table, Stock Charts
Sort Small Cap stocks: Daily, Weekly, Year-to-Date, Market Cap & Trends. Filter Small Cap stocks list by sector: Show all, Tech, Finance, Energy, Staples, Retail, Industrial, Materials, Utilities and HealthCare Filter Small Cap stocks list by size: All Large Medium Small and MicroCap |
| 12Stocks.com Small Cap Stocks Performances & Trends Daily | |||||||||
|
|  The overall Smart Investing & Trading Score is 76 (0-bearish to 100-bullish) which puts Small Cap index in short term neutral to bullish trend. The Smart Investing & Trading Score from previous trading session is 90 and hence a deterioration of trend.
| ||||||||
Here are the Smart Investing & Trading Scores of the most requested small cap stocks at 12Stocks.com (click stock name for detailed review):
|


| 12Stocks.com: Investing in Smallcap Index with Stocks | |
|
The following table helps investors and traders sort through current performance and trends (as measured by Smart Investing & Trading Score) of various
stocks in the Smallcap Index. Quick View: Move mouse or cursor over stock symbol (ticker) to view short-term technical chart and over stock name to view long term chart. Click on  to add stock symbol to your watchlist and to add stock symbol to your watchlist and  to view watchlist. Click on any ticker or stock name for detailed market intelligence report for that stock. to view watchlist. Click on any ticker or stock name for detailed market intelligence report for that stock. |
12Stocks.com Performance of Stocks in Smallcap Index
| Ticker | Stock Name | Watchlist | Category | Recent Price | Smart Investing & Trading Score | Change % | Weekly Change% |
| MITK | Mitek Systems |   | Technology | 13.04 | 46 | -5.92% | -2.47% |
| SMP | Standard Motor | | Consumer Staples | 31.73 | 31 | -0.69% | -2.49% |
| VREX | Varex Imaging | | Health Care | 14.97 | 0 | -1.77% | -2.54% |
| FIZZ | National Beverage | | Consumer Staples | 46.88 | 42 | -1.14% | -2.58% |
| EVI | EVI Industries | | Services & Goods | 20.28 | 10 | 0.15% | -2.59% |
| DBI | Designer Brands | | Services & Goods | 9.32 | 7 | 1.53% | -2.61% |
| MUR | Murphy Oil | | Energy | 43.08 | 36 | -0.30% | -2.62% |
| REVG | REV Group | | Consumer Staples | 25.85 | 83 | -0.65% | -2.64% |
| SIBN | SI-BONE | | Health Care | 14.92 | 40 | -1.39% | -2.67% |
| VEL | Velocity Financial | | Financials | 17.88 | 63 | 0.56% | -2.67% |
| METCB | Ramaco Resources | | Materials | 10.90 | 25 | -1.45% | -2.68% |
| HBIO | Harvard Bioscience | | Health Care | 3.44 | 28 | -0.72% | -2.69% |
| MBUU | Malibu Boats | | Consumer Staples | 34.99 | 32 | 1.98% | -2.70% |
| APPF | AppFolio | | Technology | 240.59 | 20 | -2.55% | -2.72% |
| CDRE | Cadre | | Industrials | 30.45 | 17 | 1.84% | -2.75% |
| EB | Eventbrite | | Technology | 5.27 | 17 | -1.86% | -2.77% |
| EYEN | Eyenovia | | Health Care | 0.75 | 25 | -8.65% | -2.77% |
| ATKR | Atkore | | Industrials | 151.86 | 10 | -1.13% | -2.78% |
| NNOX | Nano X | | Health Care | 9.80 | 32 | -0.31% | -2.78% |
| MIRM | Mirum | | Health Care | 24.07 | 10 | -2.75% | -2.79% |
| TALO | Talos Energy | | Energy | 12.14 | 17 | 1.17% | -2.80% |
| ULH | Universal Logistics | | Transports | 47.35 | 76 | -1.00% | -2.81% |
| ALTG | Alta Equipment | | Transports | 8.60 | 17 | -0.35% | -2.82% |
| BLUE | bluebird bio | | Health Care | 1.03 | 37 | -1.90% | -2.83% |
| IRMD | IRadimed | | Health Care | 42.35 | 49 | -0.54% | -2.84% |


| Too many stocks? View smallcap stocks filtered by marketcap & sector |
| Marketcap: All SmallCap Stocks (default-no microcap), Large, Mid-Range, Small |
| Smallcap Sector: Tech, Finance, Energy, Staples, Retail, Industrial, Materials, & Medical |
|
Get the most comprehensive stock market coverage daily at 12Stocks.com ➞ Best Stocks Today ➞ Best Stocks Weekly ➞ Best Stocks Year-to-Date ➞ Best Stocks Trends ➞  Best Stocks Today 12Stocks.com Best Nasdaq Stocks ➞ Best S&P 500 Stocks ➞ Best Tech Stocks ➞ Best Biotech Stocks ➞ |
| Detailed Overview of SmallCap Stocks |
| SmallCap Technical Overview, Leaders & Laggards, Top SmallCap ETF Funds & Detailed SmallCap Stocks List, Charts, Trends & More |
| Smallcap: Technical Analysis, Trends & YTD Performance | |
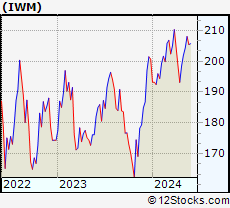
| SmallCap segment as represented by
IWM, an exchange-traded fund [ETF], holds basket of thousands of smallcap stocks from across all major sectors of the US stock market. The smallcap index (contains stocks like Riverbed & Sotheby's) is up by 3.67% and is currently underperforming the overall market by -6.9% year-to-date. Below is a quick view of technical charts and trends: | |
 IWM Weekly Chart |
|
| Long Term Trend: Very Good | |
| Medium Term Trend: Very Good | |
 IWM Daily Chart |
|
| Short Term Trend: Good | |
| Overall Trend Score: 76 | |
| YTD Performance: 3.67% | |
| **Trend Scores & Views Are Only For Educational Purposes And Not For Investing | |
| 12Stocks.com: Top Performing Small Cap Index Stocks | ||||||||||||||||||||||||||||||||||||||||||||||||
 The top performing Small Cap Index stocks year to date are
Now, more recently, over last week, the top performing Small Cap Index stocks on the move are


|
||||||||||||||||||||||||||||||||||||||||||||||||
| 12Stocks.com: Investing in Smallcap Index using Exchange Traded Funds | |
|
The following table shows list of key exchange traded funds (ETF) that
help investors track Smallcap index. The following list also includes leveraged ETF funds that track twice or thrice the daily returns of Smallcap indices. Short or inverse ETF funds move in the opposite direction to the index they track and are useful during market pullbacks or during bear markets. Quick View: Move mouse or cursor over ETF symbol (ticker) to view short-term technical chart and over ETF name to view long term chart. Click on ticker or stock name for detailed view. Click on to add stock symbol to your watchlist and to view watchlist. |
12Stocks.com List of ETFs that track Smallcap Index
| Ticker | ETF Name | Watchlist | Recent Price | Smart Investing & Trading Score | Change % | Week % | Year-to-date % |
| IWM | iShares Russell 2000 | | 208.08 | 76 | 0.07 | 1.85 | 3.67% |
| VTWO | Vanguard Russell 2000 ETF | | 84.11 | 71 | 0.00 | 1.8 | 3.71% |
| IJR | iShares Core S&P Small-Cap | | 110.39 | 68 | -0.22 | 1.29 | 1.98% |
| IWN | iShares Russell 2000 Value | | 158.71 | 76 | -0.07 | 1.61 | 2.18% |
| IWO | iShares Russell 2000 Growth | | 265.15 | 63 | -0.75 | 2.01 | 5.13% |
| IJS | iShares S&P Small-Cap 600 Value | | 101.87 | 76 | -0.15 | 1.34 | -1.16% |
| IJT | iShares S&P Small-Cap 600 Growth | | 131.34 | 71 | 0.04 | 1.14 | 4.95% |
| XSLV | PowerShares S&P SmallCap Low Volatil ETF | | 44.48 | 83 | -0.01 | 0.55 | 0.74% |
| SAA | ProShares Ultra SmallCap600 | | 24.90 | 71 | 0.50 | 2.28 | -0.18% |
| SMLV | SPDR SSGA US Small Cap Low Volatil ETF | | 113.28 | 95 | 0.43 | 1.85 | 0.68% |
| SDD | ProShares UltraShort SmallCap600 | | 17.84 | 35 | 0.96 | -2.41 | -3.19% |
| SBB | ProShares Short SmallCap600 | | 15.77 | 25 | 0.41 | -1.14 | -0.98% |
| 12Stocks.com: Charts, Trends, Fundamental Data and Performances of SmallCap Stocks | |
|
We now take in-depth look at all SmallCap stocks including charts, multi-period performances and overall trends (as measured by Smart Investing & Trading Score). One can sort SmallCap stocks (click link to choose) by Daily, Weekly and by Year-to-Date performances. Also, one can sort by size of the company or by market capitalization. |
| Select Your Default Chart Type: | |||||
| |||||
| Click on stock symbol or name for detailed view. Click on to add stock symbol to your watchlist and to view watchlist. Quick View: Move mouse or cursor over "Daily" to quickly view daily technical stock chart and over "Weekly" to view weekly technical stock chart. | |||||

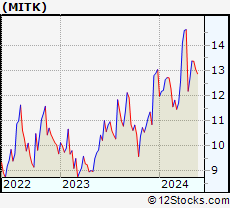 | MITK Mitek Systems, Inc. |
| Sector: Technology | |
| SubSector: Application Software | |
| MarketCap: 265.962 Millions | |
| Recent Price: 13.04 Smart Investing & Trading Score: 46 | |
| Day Percent Change: -5.92% Day Change: -0.82 | |
| Week Change: -2.47% Year-to-date Change: 0.0% | |
| MITK Links: Profile News Message Board | |
| Charts:- Daily , Weekly | |
| Add MITK to Watchlist: View: Get Complete MITK Trend Analysis ➞ | |
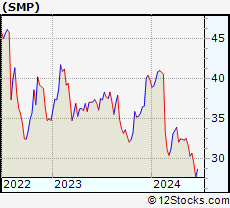 | SMP Standard Motor Products, Inc. |
| Sector: Consumer Staples | |
| SubSector: Auto Parts | |
| MarketCap: 909.939 Millions | |
| Recent Price: 31.73 Smart Investing & Trading Score: 31 | |
| Day Percent Change: -0.69% Day Change: -0.22 | |
| Week Change: -2.49% Year-to-date Change: -20.3% | |
| SMP Links: Profile News Message Board | |
| Charts:- Daily , Weekly | |
| Add SMP to Watchlist: View: Get Complete SMP Trend Analysis ➞ | |
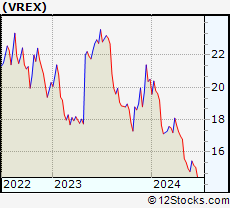 | VREX Varex Imaging Corporation |
| Sector: Health Care | |
| SubSector: Medical Appliances & Equipment | |
| MarketCap: 718.78 Millions | |
| Recent Price: 14.97 Smart Investing & Trading Score: 0 | |
| Day Percent Change: -1.77% Day Change: -0.27 | |
| Week Change: -2.54% Year-to-date Change: -27.0% | |
| VREX Links: Profile News Message Board | |
| Charts:- Daily , Weekly | |
| Add VREX to Watchlist: View: Get Complete VREX Trend Analysis ➞ | |
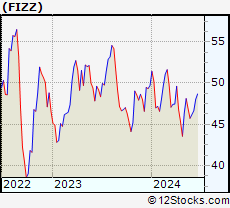 | FIZZ National Beverage Corp. |
| Sector: Consumer Staples | |
| SubSector: Beverages - Soft Drinks | |
| MarketCap: 2031.4 Millions | |
| Recent Price: 46.88 Smart Investing & Trading Score: 42 | |
| Day Percent Change: -1.14% Day Change: -0.54 | |
| Week Change: -2.58% Year-to-date Change: -5.7% | |
| FIZZ Links: Profile News Message Board | |
| Charts:- Daily , Weekly | |
| Add FIZZ to Watchlist: View: Get Complete FIZZ Trend Analysis ➞ | |
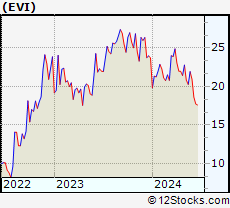 | EVI EVI Industries, Inc. |
| Sector: Services & Goods | |
| SubSector: Consumer Services | |
| MarketCap: 207.448 Millions | |
| Recent Price: 20.28 Smart Investing & Trading Score: 10 | |
| Day Percent Change: 0.15% Day Change: 0.03 | |
| Week Change: -2.59% Year-to-date Change: -14.5% | |
| EVI Links: Profile News Message Board | |
| Charts:- Daily , Weekly | |
| Add EVI to Watchlist: View: Get Complete EVI Trend Analysis ➞ | |
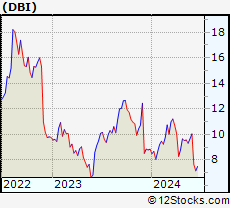 | DBI Designer Brands Inc. |
| Sector: Services & Goods | |
| SubSector: Apparel Stores | |
| MarketCap: 467.308 Millions | |
| Recent Price: 9.32 Smart Investing & Trading Score: 7 | |
| Day Percent Change: 1.53% Day Change: 0.14 | |
| Week Change: -2.61% Year-to-date Change: 5.3% | |
| DBI Links: Profile News Message Board | |
| Charts:- Daily , Weekly | |
| Add DBI to Watchlist: View: Get Complete DBI Trend Analysis ➞ | |
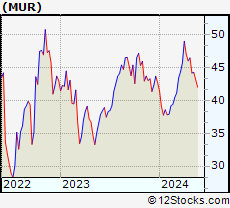 | MUR Murphy Oil Corporation |
| Sector: Energy | |
| SubSector: Independent Oil & Gas | |
| MarketCap: 985.993 Millions | |
| Recent Price: 43.08 Smart Investing & Trading Score: 36 | |
| Day Percent Change: -0.30% Day Change: -0.13 | |
| Week Change: -2.62% Year-to-date Change: 1.0% | |
| MUR Links: Profile News Message Board | |
| Charts:- Daily , Weekly | |
| Add MUR to Watchlist: View: Get Complete MUR Trend Analysis ➞ | |
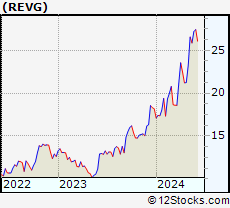 | REVG REV Group, Inc. |
| Sector: Consumer Staples | |
| SubSector: Trucks & Other Vehicles | |
| MarketCap: 398.597 Millions | |
| Recent Price: 25.85 Smart Investing & Trading Score: 83 | |
| Day Percent Change: -0.65% Day Change: -0.17 | |
| Week Change: -2.64% Year-to-date Change: 42.3% | |
| REVG Links: Profile News Message Board | |
| Charts:- Daily , Weekly | |
| Add REVG to Watchlist: View: Get Complete REVG Trend Analysis ➞ | |
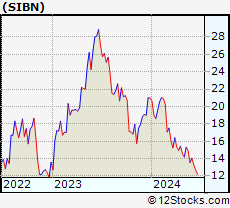 | SIBN SI-BONE, Inc. |
| Sector: Health Care | |
| SubSector: Medical Appliances & Equipment | |
| MarketCap: 234.78 Millions | |
| Recent Price: 14.92 Smart Investing & Trading Score: 40 | |
| Day Percent Change: -1.39% Day Change: -0.21 | |
| Week Change: -2.67% Year-to-date Change: -28.9% | |
| SIBN Links: Profile News Message Board | |
| Charts:- Daily , Weekly | |
| Add SIBN to Watchlist: View: Get Complete SIBN Trend Analysis ➞ | |
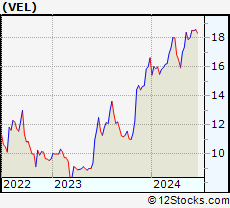 | VEL Velocity Financial, Inc. |
| Sector: Financials | |
| SubSector: Mortgage Finance | |
| MarketCap: 12157 Millions | |
| Recent Price: 17.88 Smart Investing & Trading Score: 63 | |
| Day Percent Change: 0.56% Day Change: 0.10 | |
| Week Change: -2.67% Year-to-date Change: 7.6% | |
| VEL Links: Profile News Message Board | |
| Charts:- Daily , Weekly | |
| Add VEL to Watchlist: View: Get Complete VEL Trend Analysis ➞ | |
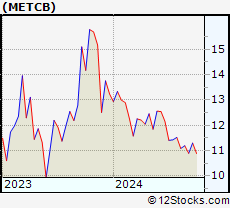 | METCB Ramaco Resources, Inc. |
| Sector: Materials | |
| SubSector: Coking Coal | |
| MarketCap: 469 Millions | |
| Recent Price: 10.90 Smart Investing & Trading Score: 25 | |
| Day Percent Change: -1.45% Day Change: -0.16 | |
| Week Change: -2.68% Year-to-date Change: -17.7% | |
| METCB Links: Profile News Message Board | |
| Charts:- Daily , Weekly | |
| Add METCB to Watchlist: View: Get Complete METCB Trend Analysis ➞ | |
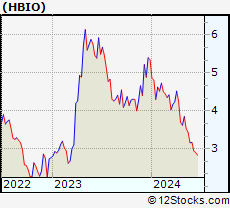 | HBIO Harvard Bioscience, Inc. |
| Sector: Health Care | |
| SubSector: Medical Instruments & Supplies | |
| MarketCap: 63.086 Millions | |
| Recent Price: 3.44 Smart Investing & Trading Score: 28 | |
| Day Percent Change: -0.72% Day Change: -0.02 | |
| Week Change: -2.69% Year-to-date Change: -35.8% | |
| HBIO Links: Profile News Message Board | |
| Charts:- Daily , Weekly | |
| Add HBIO to Watchlist: View: Get Complete HBIO Trend Analysis ➞ | |
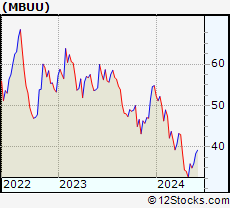 | MBUU Malibu Boats, Inc. |
| Sector: Consumer Staples | |
| SubSector: Recreational Goods, Other | |
| MarketCap: 561.059 Millions | |
| Recent Price: 34.99 Smart Investing & Trading Score: 32 | |
| Day Percent Change: 1.98% Day Change: 0.68 | |
| Week Change: -2.7% Year-to-date Change: -36.2% | |
| MBUU Links: Profile News Message Board | |
| Charts:- Daily , Weekly | |
| Add MBUU to Watchlist: View: Get Complete MBUU Trend Analysis ➞ | |
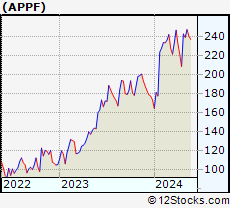 | APPF AppFolio, Inc. |
| Sector: Technology | |
| SubSector: Application Software | |
| MarketCap: 3412.02 Millions | |
| Recent Price: 240.59 Smart Investing & Trading Score: 20 | |
| Day Percent Change: -2.55% Day Change: -6.29 | |
| Week Change: -2.72% Year-to-date Change: 38.9% | |
| APPF Links: Profile News Message Board | |
| Charts:- Daily , Weekly | |
| Add APPF to Watchlist: View: Get Complete APPF Trend Analysis ➞ | |
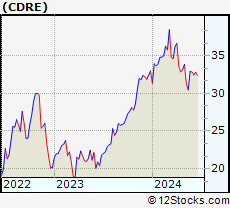 | CDRE Cadre Holdings, Inc. |
| Sector: Industrials | |
| SubSector: Aerospace & Defense | |
| MarketCap: 817 Millions | |
| Recent Price: 30.45 Smart Investing & Trading Score: 17 | |
| Day Percent Change: 1.84% Day Change: 0.55 | |
| Week Change: -2.75% Year-to-date Change: -7.6% | |
| CDRE Links: Profile News Message Board | |
| Charts:- Daily , Weekly | |
| Add CDRE to Watchlist: View: Get Complete CDRE Trend Analysis ➞ | |
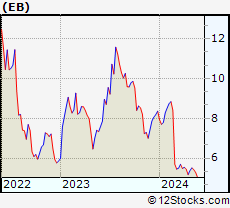 | EB Eventbrite, Inc. |
| Sector: Technology | |
| SubSector: Application Software | |
| MarketCap: 805.262 Millions | |
| Recent Price: 5.27 Smart Investing & Trading Score: 17 | |
| Day Percent Change: -1.86% Day Change: -0.10 | |
| Week Change: -2.77% Year-to-date Change: -37.0% | |
| EB Links: Profile News Message Board | |
| Charts:- Daily , Weekly | |
| Add EB to Watchlist: View: Get Complete EB Trend Analysis ➞ | |
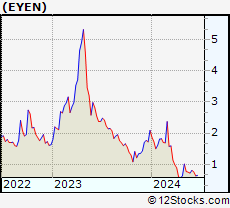 | EYEN Eyenovia, Inc. |
| Sector: Health Care | |
| SubSector: Biotechnology | |
| MarketCap: 52.2785 Millions | |
| Recent Price: 0.75 Smart Investing & Trading Score: 25 | |
| Day Percent Change: -8.65% Day Change: -0.07 | |
| Week Change: -2.77% Year-to-date Change: -64.1% | |
| EYEN Links: Profile News Message Board | |
| Charts:- Daily , Weekly | |
| Add EYEN to Watchlist: View: Get Complete EYEN Trend Analysis ➞ | |
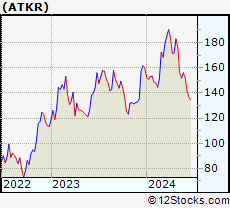 | ATKR Atkore International Group Inc. |
| Sector: Industrials | |
| SubSector: Industrial Electrical Equipment | |
| MarketCap: 1086.79 Millions | |
| Recent Price: 151.86 Smart Investing & Trading Score: 10 | |
| Day Percent Change: -1.13% Day Change: -1.74 | |
| Week Change: -2.78% Year-to-date Change: -5.1% | |
| ATKR Links: Profile News Message Board | |
| Charts:- Daily , Weekly | |
| Add ATKR to Watchlist: View: Get Complete ATKR Trend Analysis ➞ | |
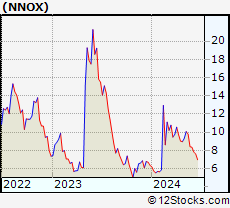 | NNOX Nano X Imaging Ltd. |
| Sector: Health Care | |
| SubSector: Medical Devices | |
| MarketCap: 22587 Millions | |
| Recent Price: 9.80 Smart Investing & Trading Score: 32 | |
| Day Percent Change: -0.31% Day Change: -0.03 | |
| Week Change: -2.78% Year-to-date Change: 53.9% | |
| NNOX Links: Profile News Message Board | |
| Charts:- Daily , Weekly | |
| Add NNOX to Watchlist: View: Get Complete NNOX Trend Analysis ➞ | |
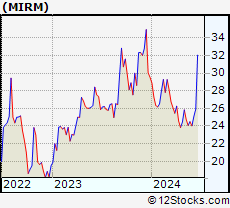 | MIRM Mirum Pharmaceuticals, Inc. |
| Sector: Health Care | |
| SubSector: Biotechnology | |
| MarketCap: 309.585 Millions | |
| Recent Price: 24.07 Smart Investing & Trading Score: 10 | |
| Day Percent Change: -2.75% Day Change: -0.68 | |
| Week Change: -2.79% Year-to-date Change: -18.5% | |
| MIRM Links: Profile News Message Board | |
| Charts:- Daily , Weekly | |
| Add MIRM to Watchlist: View: Get Complete MIRM Trend Analysis ➞ | |
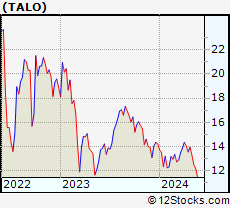 | TALO Talos Energy Inc. |
| Sector: Energy | |
| SubSector: Independent Oil & Gas | |
| MarketCap: 396.293 Millions | |
| Recent Price: 12.14 Smart Investing & Trading Score: 17 | |
| Day Percent Change: 1.17% Day Change: 0.14 | |
| Week Change: -2.8% Year-to-date Change: -14.7% | |
| TALO Links: Profile News Message Board | |
| Charts:- Daily , Weekly | |
| Add TALO to Watchlist: View: Get Complete TALO Trend Analysis ➞ | |
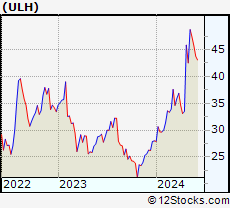 | ULH Universal Logistics Holdings, Inc. |
| Sector: Transports | |
| SubSector: Trucking | |
| MarketCap: 354.915 Millions | |
| Recent Price: 47.35 Smart Investing & Trading Score: 76 | |
| Day Percent Change: -1.00% Day Change: -0.48 | |
| Week Change: -2.81% Year-to-date Change: 69.0% | |
| ULH Links: Profile News Message Board | |
| Charts:- Daily , Weekly | |
| Add ULH to Watchlist: View: Get Complete ULH Trend Analysis ➞ | |
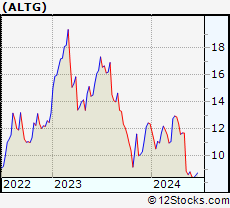 | ALTG Alta Equipment Group Inc. |
| Sector: Transports | |
| SubSector: Rental & Leasing Services | |
| MarketCap: 86.9044 Millions | |
| Recent Price: 8.60 Smart Investing & Trading Score: 17 | |
| Day Percent Change: -0.35% Day Change: -0.03 | |
| Week Change: -2.82% Year-to-date Change: -30.5% | |
| ALTG Links: Profile News Message Board | |
| Charts:- Daily , Weekly | |
| Add ALTG to Watchlist: View: Get Complete ALTG Trend Analysis ➞ | |
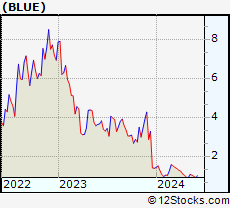 | BLUE bluebird bio, Inc. |
| Sector: Health Care | |
| SubSector: Biotechnology | |
| MarketCap: 3365.05 Millions | |
| Recent Price: 1.03 Smart Investing & Trading Score: 37 | |
| Day Percent Change: -1.90% Day Change: -0.02 | |
| Week Change: -2.83% Year-to-date Change: -25.4% | |
| BLUE Links: Profile News Message Board | |
| Charts:- Daily , Weekly | |
| Add BLUE to Watchlist: View: Get Complete BLUE Trend Analysis ➞ | |
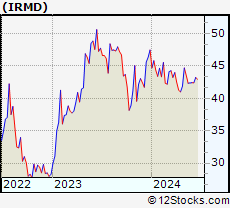 | IRMD IRadimed Corporation |
| Sector: Health Care | |
| SubSector: Medical Appliances & Equipment | |
| MarketCap: 207.78 Millions | |
| Recent Price: 42.35 Smart Investing & Trading Score: 49 | |
| Day Percent Change: -0.54% Day Change: -0.23 | |
| Week Change: -2.84% Year-to-date Change: -10.8% | |
| IRMD Links: Profile News Message Board | |
| Charts:- Daily , Weekly | |
| Add IRMD to Watchlist: View: Get Complete IRMD Trend Analysis ➞ | |
| Too many stocks? View smallcap stocks filtered by marketcap & sector |
| Marketcap: All SmallCap Stocks (default-no microcap), Large, Mid-Range, Small & MicroCap |
| Sector: Tech, Finance, Energy, Staples, Retail, Industrial, Materials, Utilities & Medical |
|
Best Stocks Today 12Stocks.com |
© 2024 12Stocks.com Terms & Conditions Privacy Contact Us
All Information Provided Only For Education And Not To Be Used For Investing or Trading. See Terms & Conditions


One More Thing ... Get Best Stocks Delivered Daily!
Never Ever Miss A Move With Our Top Ten Stocks Lists
Find Best Stocks In Any Market - Bull or Bear Market
Take A Peek At Our Top Ten Stocks Lists: Daily, Weekly, Year-to-Date & Top Trends
Find Best Stocks In Any Market - Bull or Bear Market
Take A Peek At Our Top Ten Stocks Lists: Daily, Weekly, Year-to-Date & Top Trends
Smallcap Stocks With Best Up Trends [0-bearish to 100-bullish]: CommScope Holding[100], Coeur Mining[100], Hecla Mining[100], MicroStrategy [100], Enovix [100], Rayonier Advanced[100], Nurix [100], Energy Fuels[100], NovaGold Resources[100], Piedmont Lithium[100], Wave Life[100]
Best Smallcap Stocks Year-to-Date:
CareMax [495.88%], Bakkt [413.9%], Janux [338.34%], Viking [260.02%], Alpine Immune[241.23%], Longboard [238.63%], Avidity Biosciences[226.33%], Super Micro[212.35%], Arcutis Bio[184.83%], Sweetgreen [180.97%], Novavax [171.04%] Best Smallcap Stocks This Week:
Vaxxinity [58.82%], Novavax [46.51%], Vicarious Surgical[45.62%], Harrow Health[44.48%], ProKidney [44.31%], Workhorse Group[36.06%], Maxeon Solar[35.94%], Fossil Group[35.44%], Humacyte [34.68%], MicroStrategy [34.23%], Cadiz [33.48%] Best Smallcap Stocks Daily:
Vaxxinity [45.95%], Presto Automation[31.90%], Vicarious Surgical[27.93%], Orchestra BioMed[12.77%], CommScope Holding[11.86%], Coeur Mining[11.57%], Hecla Mining[11.11%], MicroStrategy [10.04%], Tenaya [9.65%], Bakkt [9.25%], Enovix [9.25%]