
 Login Sign Up


| |||||
 |  | ||||

| 12Stocks.com Market Intelligence |
Best SmallCap Stocks
|
| In a hurry? Small Cap Stock Lists: Performance Trends Table, Stock Charts
Sort Small Cap stocks: Daily, Weekly, Year-to-Date, Market Cap & Trends. Filter Small Cap stocks list by sector: Show all, Tech, Finance, Energy, Staples, Retail, Industrial, Materials, Utilities and HealthCare Filter Small Cap stocks list by size: All Large Medium Small and MicroCap |
| 12Stocks.com Small Cap Stocks Performances & Trends Daily | |||||||||
|
|  The overall Smart Investing & Trading Score is 76 (0-bearish to 100-bullish) which puts Small Cap index in short term neutral to bullish trend. The Smart Investing & Trading Score from previous trading session is 90 and hence a deterioration of trend.
| ||||||||
Here are the Smart Investing & Trading Scores of the most requested small cap stocks at 12Stocks.com (click stock name for detailed review):
|


| 12Stocks.com: Investing in Smallcap Index with Stocks | |
|
The following table helps investors and traders sort through current performance and trends (as measured by Smart Investing & Trading Score) of various
stocks in the Smallcap Index. Quick View: Move mouse or cursor over stock symbol (ticker) to view short-term technical chart and over stock name to view long term chart. Click on  to add stock symbol to your watchlist and to add stock symbol to your watchlist and  to view watchlist. Click on any ticker or stock name for detailed market intelligence report for that stock. to view watchlist. Click on any ticker or stock name for detailed market intelligence report for that stock. |
12Stocks.com Performance of Stocks in Smallcap Index
| Ticker | Stock Name | Watchlist | Category | Recent Price | Smart Investing & Trading Score | Change % | Weekly Change% |
| VCYT | Veracyte |   | Health Care | 22.88 | 50 | -2.22% | 7.07% |
| JYNT | Joint | | Health Care | 17.60 | 90 | 0.46% | 7.06% |
| KURA | Kura Oncology | | Health Care | 22.17 | 85 | -3.52% | 7.05% |
| SABR | Sabre | | Technology | 3.05 | 68 | -1.29% | 7.02% |
| LUNG | Pulmonx | | Health Care | 9.00 | 52 | -0.55% | 7.02% |
| EVBN | Evans Bancorp | | Financials | 28.27 | 74 | 2.35% | 7.00% |
| NEWT | Newtek Business | | Services & Goods | 13.67 | 68 | -2.50% | 6.96% |
| VCTR | Victory Capital | | Financials | 51.69 | 56 | -0.69% | 6.95% |
| AMBA | Ambarella | | Technology | 49.01 | 74 | 2.36% | 6.89% |
| FIGS | FIGS | | Services & Goods | 5.76 | 68 | -0.69% | 6.86% |
| ENFN | Enfusion | | Technology | 9.67 | 93 | 0.31% | 6.85% |
| JELD | JELD-WEN Holding | | Industrials | 15.61 | 32 | 1.30% | 6.84% |
| NODK | NI | | Financials | 16.09 | 88 | -0.56% | 6.84% |
| CRDO | Credo | | Technology | 18.89 | 64 | -1.10% | 6.84% |
| BHVN | Biohaven Pharmaceutical | | Health Care | 37.37 | 35 | -2.81% | 6.82% |
| CLW | Clearwater Paper | | Consumer Staples | 51.47 | 90 | -0.37% | 6.81% |
| KRT | Karat Packaging | | Services & Goods | 28.53 | 40 | -0.59% | 6.81% |
| PUBM | PubMatic | | Technology | 24.02 | 83 | 5.24% | 6.80% |
| TPIC | TPI Composites | | Industrials | 3.95 | 68 | -9.20% | 6.76% |
| SPT | Sprout Social | | Technology | 29.93 | 42 | 0.50% | 6.68% |
| BE | Bloom Energy | | Utilities | 12.33 | 61 | 0.82% | 6.66% |
| ETRN | Equitrans Midstream | | Energy | 13.90 | 88 | 1.83% | 6.64% |
| EOLS | Evolus | | Health Care | 13.59 | 64 | -0.80% | 6.59% |
| AFRI | Forafric Global | | Consumer Staples | 11.17 | 100 | 1.45% | 6.58% |
| EGHT | 8x8 | | Technology | 2.76 | 44 | 2.99% | 6.56% |


| Too many stocks? View smallcap stocks filtered by marketcap & sector |
| Marketcap: All SmallCap Stocks (default-no microcap), Large, Mid-Range, Small |
| Smallcap Sector: Tech, Finance, Energy, Staples, Retail, Industrial, Materials, & Medical |
|
Get the most comprehensive stock market coverage daily at 12Stocks.com ➞ Best Stocks Today ➞ Best Stocks Weekly ➞ Best Stocks Year-to-Date ➞ Best Stocks Trends ➞  Best Stocks Today 12Stocks.com Best Nasdaq Stocks ➞ Best S&P 500 Stocks ➞ Best Tech Stocks ➞ Best Biotech Stocks ➞ |
| Detailed Overview of SmallCap Stocks |
| SmallCap Technical Overview, Leaders & Laggards, Top SmallCap ETF Funds & Detailed SmallCap Stocks List, Charts, Trends & More |
| Smallcap: Technical Analysis, Trends & YTD Performance | |
| SmallCap segment as represented by
IWM, an exchange-traded fund [ETF], holds basket of thousands of smallcap stocks from across all major sectors of the US stock market. The smallcap index (contains stocks like Riverbed & Sotheby's) is up by 3.67% and is currently underperforming the overall market by -6.9% year-to-date. Below is a quick view of technical charts and trends: | |
 IWM Weekly Chart |
|
| Long Term Trend: Very Good | |
| Medium Term Trend: Very Good | |
 IWM Daily Chart |
|
| Short Term Trend: Good | |
| Overall Trend Score: 76 | |
| YTD Performance: 3.67% | |
| **Trend Scores & Views Are Only For Educational Purposes And Not For Investing | |
| 12Stocks.com: Top Performing Small Cap Index Stocks | ||||||||||||||||||||||||||||||||||||||||||||||||
 The top performing Small Cap Index stocks year to date are
Now, more recently, over last week, the top performing Small Cap Index stocks on the move are


|
||||||||||||||||||||||||||||||||||||||||||||||||
| 12Stocks.com: Investing in Smallcap Index using Exchange Traded Funds | |
|
The following table shows list of key exchange traded funds (ETF) that
help investors track Smallcap index. The following list also includes leveraged ETF funds that track twice or thrice the daily returns of Smallcap indices. Short or inverse ETF funds move in the opposite direction to the index they track and are useful during market pullbacks or during bear markets. Quick View: Move mouse or cursor over ETF symbol (ticker) to view short-term technical chart and over ETF name to view long term chart. Click on ticker or stock name for detailed view. Click on to add stock symbol to your watchlist and to view watchlist. |
12Stocks.com List of ETFs that track Smallcap Index
| Ticker | ETF Name | Watchlist | Recent Price | Smart Investing & Trading Score | Change % | Week % | Year-to-date % |
| IWM | iShares Russell 2000 | | 208.08 | 76 | 0.07 | 1.85 | 3.67% |
| VTWO | Vanguard Russell 2000 ETF | | 84.11 | 71 | 0.00 | 1.8 | 3.71% |
| IJR | iShares Core S&P Small-Cap | | 110.39 | 68 | -0.22 | 1.29 | 1.98% |
| IWN | iShares Russell 2000 Value | | 158.71 | 76 | -0.07 | 1.61 | 2.18% |
| IWO | iShares Russell 2000 Growth | | 265.15 | 63 | -0.75 | 2.01 | 5.13% |
| IJS | iShares S&P Small-Cap 600 Value | | 101.87 | 76 | -0.15 | 1.34 | -1.16% |
| IJT | iShares S&P Small-Cap 600 Growth | | 131.34 | 71 | 0.04 | 1.14 | 4.95% |
| XSLV | PowerShares S&P SmallCap Low Volatil ETF | | 44.48 | 83 | -0.01 | 0.55 | 0.74% |
| SAA | ProShares Ultra SmallCap600 | | 24.90 | 71 | 0.50 | 2.28 | -0.18% |
| SMLV | SPDR SSGA US Small Cap Low Volatil ETF | | 113.28 | 95 | 0.43 | 1.85 | 0.68% |
| SDD | ProShares UltraShort SmallCap600 | | 17.84 | 35 | 0.96 | -2.41 | -3.19% |
| SBB | ProShares Short SmallCap600 | | 15.77 | 25 | 0.41 | -1.14 | -0.98% |
| 12Stocks.com: Charts, Trends, Fundamental Data and Performances of SmallCap Stocks | |
|
We now take in-depth look at all SmallCap stocks including charts, multi-period performances and overall trends (as measured by Smart Investing & Trading Score). One can sort SmallCap stocks (click link to choose) by Daily, Weekly and by Year-to-Date performances. Also, one can sort by size of the company or by market capitalization. |
| Select Your Default Chart Type: | |||||
| |||||
| Click on stock symbol or name for detailed view. Click on to add stock symbol to your watchlist and to view watchlist. Quick View: Move mouse or cursor over "Daily" to quickly view daily technical stock chart and over "Weekly" to view weekly technical stock chart. | |||||

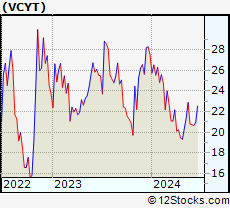 | VCYT Veracyte, Inc. |
| Sector: Health Care | |
| SubSector: Biotechnology | |
| MarketCap: 1089.05 Millions | |
| Recent Price: 22.88 Smart Investing & Trading Score: 50 | |
| Day Percent Change: -2.22% Day Change: -0.52 | |
| Week Change: 7.07% Year-to-date Change: -16.8% | |
| VCYT Links: Profile News Message Board | |
| Charts:- Daily , Weekly | |
| Add VCYT to Watchlist: View: Get Complete VCYT Trend Analysis ➞ | |
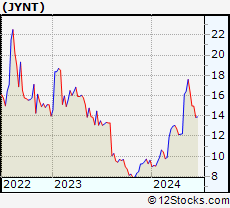 | JYNT The Joint Corp. |
| Sector: Health Care | |
| SubSector: Hospitals | |
| MarketCap: 125.146 Millions | |
| Recent Price: 17.60 Smart Investing & Trading Score: 90 | |
| Day Percent Change: 0.46% Day Change: 0.08 | |
| Week Change: 7.06% Year-to-date Change: 83.1% | |
| JYNT Links: Profile News Message Board | |
| Charts:- Daily , Weekly | |
| Add JYNT to Watchlist: View: Get Complete JYNT Trend Analysis ➞ | |
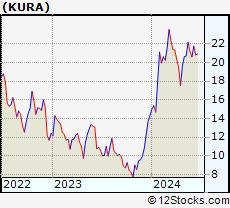 | KURA Kura Oncology, Inc. |
| Sector: Health Care | |
| SubSector: Biotechnology | |
| MarketCap: 401.885 Millions | |
| Recent Price: 22.17 Smart Investing & Trading Score: 85 | |
| Day Percent Change: -3.52% Day Change: -0.81 | |
| Week Change: 7.05% Year-to-date Change: 54.2% | |
| KURA Links: Profile News Message Board | |
| Charts:- Daily , Weekly | |
| Add KURA to Watchlist: View: Get Complete KURA Trend Analysis ➞ | |
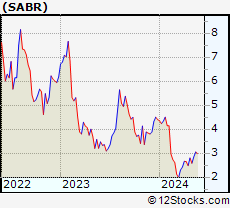 | SABR Sabre Corporation |
| Sector: Technology | |
| SubSector: Information Technology Services | |
| MarketCap: 152.468 Millions | |
| Recent Price: 3.05 Smart Investing & Trading Score: 68 | |
| Day Percent Change: -1.29% Day Change: -0.04 | |
| Week Change: 7.02% Year-to-date Change: -30.7% | |
| SABR Links: Profile News Message Board | |
| Charts:- Daily , Weekly | |
| Add SABR to Watchlist: View: Get Complete SABR Trend Analysis ➞ | |
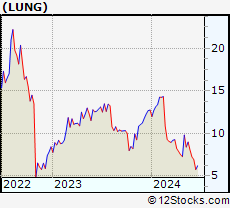 | LUNG Pulmonx Corporation |
| Sector: Health Care | |
| SubSector: Medical Devices | |
| MarketCap: 18187 Millions | |
| Recent Price: 9.00 Smart Investing & Trading Score: 52 | |
| Day Percent Change: -0.55% Day Change: -0.05 | |
| Week Change: 7.02% Year-to-date Change: -29.4% | |
| LUNG Links: Profile News Message Board | |
| Charts:- Daily , Weekly | |
| Add LUNG to Watchlist: View: Get Complete LUNG Trend Analysis ➞ | |
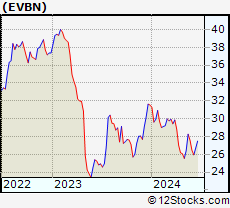 | EVBN Evans Bancorp, Inc. |
| Sector: Financials | |
| SubSector: Regional - Northeast Banks | |
| MarketCap: 124.899 Millions | |
| Recent Price: 28.27 Smart Investing & Trading Score: 74 | |
| Day Percent Change: 2.35% Day Change: 0.65 | |
| Week Change: 7% Year-to-date Change: -10.3% | |
| EVBN Links: Profile News Message Board | |
| Charts:- Daily , Weekly | |
| Add EVBN to Watchlist: View: Get Complete EVBN Trend Analysis ➞ | |
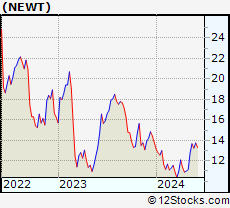 | NEWT Newtek Business Services Corp. |
| Sector: Services & Goods | |
| SubSector: Business Services | |
| MarketCap: 243.982 Millions | |
| Recent Price: 13.67 Smart Investing & Trading Score: 68 | |
| Day Percent Change: -2.50% Day Change: -0.35 | |
| Week Change: 6.96% Year-to-date Change: -0.9% | |
| NEWT Links: Profile News Message Board | |
| Charts:- Daily , Weekly | |
| Add NEWT to Watchlist: View: Get Complete NEWT Trend Analysis ➞ | |
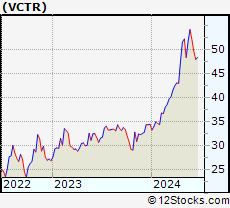 | VCTR Victory Capital Holdings, Inc. |
| Sector: Financials | |
| SubSector: Asset Management | |
| MarketCap: 1148.33 Millions | |
| Recent Price: 51.69 Smart Investing & Trading Score: 56 | |
| Day Percent Change: -0.69% Day Change: -0.36 | |
| Week Change: 6.95% Year-to-date Change: 50.1% | |
| VCTR Links: Profile News Message Board | |
| Charts:- Daily , Weekly | |
| Add VCTR to Watchlist: View: Get Complete VCTR Trend Analysis ➞ | |
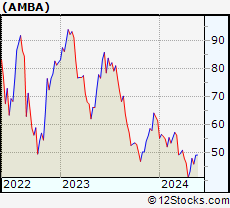 | AMBA Ambarella, Inc. |
| Sector: Technology | |
| SubSector: Semiconductor Equipment & Materials | |
| MarketCap: 1509.38 Millions | |
| Recent Price: 49.01 Smart Investing & Trading Score: 74 | |
| Day Percent Change: 2.36% Day Change: 1.13 | |
| Week Change: 6.89% Year-to-date Change: -20.0% | |
| AMBA Links: Profile News Message Board | |
| Charts:- Daily , Weekly | |
| Add AMBA to Watchlist: View: Get Complete AMBA Trend Analysis ➞ | |
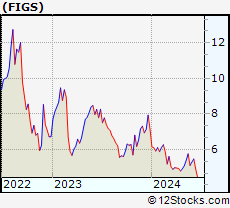 | FIGS FIGS, Inc. |
| Sector: Services & Goods | |
| SubSector: Apparel Manufacturing | |
| MarketCap: 1370 Millions | |
| Recent Price: 5.76 Smart Investing & Trading Score: 68 | |
| Day Percent Change: -0.69% Day Change: -0.04 | |
| Week Change: 6.86% Year-to-date Change: -19.2% | |
| FIGS Links: Profile News Message Board | |
| Charts:- Daily , Weekly | |
| Add FIGS to Watchlist: View: Get Complete FIGS Trend Analysis ➞ | |
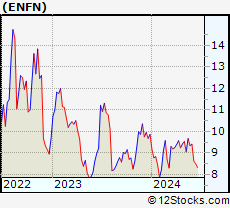 | ENFN Enfusion, Inc. |
| Sector: Technology | |
| SubSector: Software - Application | |
| MarketCap: 1290 Millions | |
| Recent Price: 9.67 Smart Investing & Trading Score: 93 | |
| Day Percent Change: 0.31% Day Change: 0.03 | |
| Week Change: 6.85% Year-to-date Change: -1.9% | |
| ENFN Links: Profile News Message Board | |
| Charts:- Daily , Weekly | |
| Add ENFN to Watchlist: View: Get Complete ENFN Trend Analysis ➞ | |
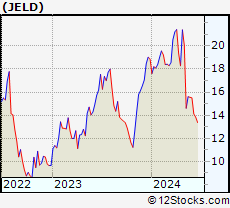 | JELD JELD-WEN Holding, Inc. |
| Sector: Industrials | |
| SubSector: General Building Materials | |
| MarketCap: 1022.53 Millions | |
| Recent Price: 15.61 Smart Investing & Trading Score: 32 | |
| Day Percent Change: 1.30% Day Change: 0.20 | |
| Week Change: 6.84% Year-to-date Change: -17.3% | |
| JELD Links: Profile News Message Board | |
| Charts:- Daily , Weekly | |
| Add JELD to Watchlist: View: Get Complete JELD Trend Analysis ➞ | |
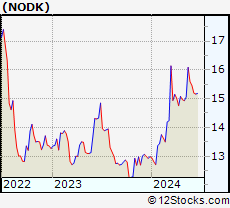 | NODK NI Holdings, Inc. |
| Sector: Financials | |
| SubSector: Property & Casualty Insurance | |
| MarketCap: 238.112 Millions | |
| Recent Price: 16.09 Smart Investing & Trading Score: 88 | |
| Day Percent Change: -0.56% Day Change: -0.09 | |
| Week Change: 6.84% Year-to-date Change: 23.9% | |
| NODK Links: Profile News Message Board | |
| Charts:- Daily , Weekly | |
| Add NODK to Watchlist: View: Get Complete NODK Trend Analysis ➞ | |
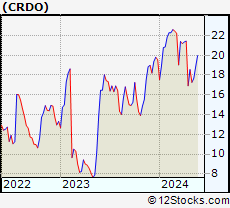 | CRDO Credo Technology Group Holding Ltd |
| Sector: Technology | |
| SubSector: Communication Equipment | |
| MarketCap: 2590 Millions | |
| Recent Price: 18.89 Smart Investing & Trading Score: 64 | |
| Day Percent Change: -1.10% Day Change: -0.21 | |
| Week Change: 6.84% Year-to-date Change: -3.4% | |
| CRDO Links: Profile News Message Board | |
| Charts:- Daily , Weekly | |
| Add CRDO to Watchlist: View: Get Complete CRDO Trend Analysis ➞ | |
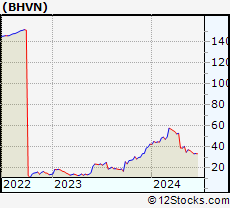 | BHVN Biohaven Pharmaceutical Holding Company Ltd. |
| Sector: Health Care | |
| SubSector: Biotechnology | |
| MarketCap: 2024.25 Millions | |
| Recent Price: 37.37 Smart Investing & Trading Score: 35 | |
| Day Percent Change: -2.81% Day Change: -1.08 | |
| Week Change: 6.82% Year-to-date Change: -12.7% | |
| BHVN Links: Profile News Message Board | |
| Charts:- Daily , Weekly | |
| Add BHVN to Watchlist: View: Get Complete BHVN Trend Analysis ➞ | |
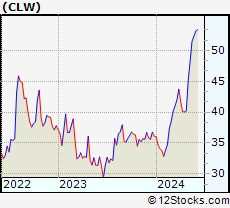 | CLW Clearwater Paper Corporation |
| Sector: Consumer Staples | |
| SubSector: Paper & Paper Products | |
| MarketCap: 416.803 Millions | |
| Recent Price: 51.47 Smart Investing & Trading Score: 90 | |
| Day Percent Change: -0.37% Day Change: -0.19 | |
| Week Change: 6.81% Year-to-date Change: 42.5% | |
| CLW Links: Profile News Message Board | |
| Charts:- Daily , Weekly | |
| Add CLW to Watchlist: View: Get Complete CLW Trend Analysis ➞ | |
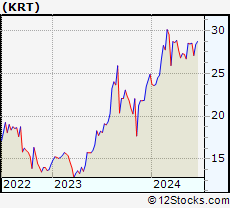 | KRT Karat Packaging Inc. |
| Sector: Services & Goods | |
| SubSector: Packaging & Containers | |
| MarketCap: 357 Millions | |
| Recent Price: 28.53 Smart Investing & Trading Score: 40 | |
| Day Percent Change: -0.59% Day Change: -0.17 | |
| Week Change: 6.81% Year-to-date Change: 14.5% | |
| KRT Links: Profile News Message Board | |
| Charts:- Daily , Weekly | |
| Add KRT to Watchlist: View: Get Complete KRT Trend Analysis ➞ | |
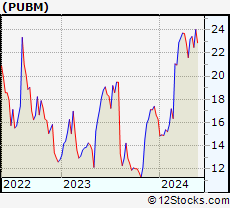 | PUBM PubMatic, Inc. |
| Sector: Technology | |
| SubSector: Software Application | |
| MarketCap: 56787 Millions | |
| Recent Price: 24.02 Smart Investing & Trading Score: 83 | |
| Day Percent Change: 5.24% Day Change: 1.20 | |
| Week Change: 6.8% Year-to-date Change: 47.4% | |
| PUBM Links: Profile News Message Board | |
| Charts:- Daily , Weekly | |
| Add PUBM to Watchlist: View: Get Complete PUBM Trend Analysis ➞ | |
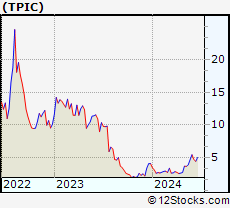 | TPIC TPI Composites, Inc. |
| Sector: Industrials | |
| SubSector: Diversified Machinery | |
| MarketCap: 451.016 Millions | |
| Recent Price: 3.95 Smart Investing & Trading Score: 68 | |
| Day Percent Change: -9.20% Day Change: -0.40 | |
| Week Change: 6.76% Year-to-date Change: -4.6% | |
| TPIC Links: Profile News Message Board | |
| Charts:- Daily , Weekly | |
| Add TPIC to Watchlist: View: Get Complete TPIC Trend Analysis ➞ | |
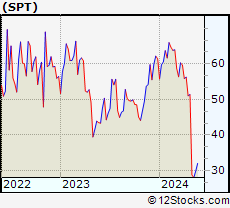 | SPT Sprout Social, Inc. |
| Sector: Technology | |
| SubSector: Software Application | |
| MarketCap: 25087 Millions | |
| Recent Price: 29.93 Smart Investing & Trading Score: 42 | |
| Day Percent Change: 0.50% Day Change: 0.15 | |
| Week Change: 6.68% Year-to-date Change: -51.3% | |
| SPT Links: Profile News Message Board | |
| Charts:- Daily , Weekly | |
| Add SPT to Watchlist: View: Get Complete SPT Trend Analysis ➞ | |
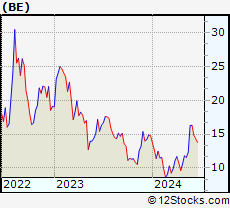 | BE Bloom Energy Corporation |
| Sector: Utilities | |
| SubSector: Electric Utilities | |
| MarketCap: 567.514 Millions | |
| Recent Price: 12.33 Smart Investing & Trading Score: 61 | |
| Day Percent Change: 0.82% Day Change: 0.10 | |
| Week Change: 6.66% Year-to-date Change: -16.7% | |
| BE Links: Profile News Message Board | |
| Charts:- Daily , Weekly | |
| Add BE to Watchlist: View: Get Complete BE Trend Analysis ➞ | |
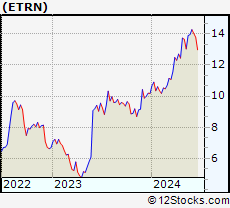 | ETRN Equitrans Midstream Corporation |
| Sector: Energy | |
| SubSector: Independent Oil & Gas | |
| MarketCap: 1772.73 Millions | |
| Recent Price: 13.90 Smart Investing & Trading Score: 88 | |
| Day Percent Change: 1.83% Day Change: 0.25 | |
| Week Change: 6.64% Year-to-date Change: 36.5% | |
| ETRN Links: Profile News Message Board | |
| Charts:- Daily , Weekly | |
| Add ETRN to Watchlist: View: Get Complete ETRN Trend Analysis ➞ | |
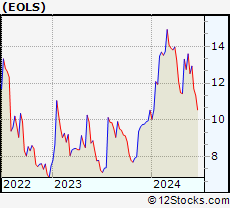 | EOLS Evolus, Inc. |
| Sector: Health Care | |
| SubSector: Drugs - Generic | |
| MarketCap: 145.885 Millions | |
| Recent Price: 13.59 Smart Investing & Trading Score: 64 | |
| Day Percent Change: -0.80% Day Change: -0.11 | |
| Week Change: 6.59% Year-to-date Change: 29.1% | |
| EOLS Links: Profile News Message Board | |
| Charts:- Daily , Weekly | |
| Add EOLS to Watchlist: View: Get Complete EOLS Trend Analysis ➞ | |
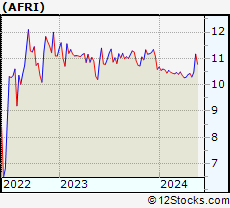 | AFRI Forafric Global PLC |
| Sector: Consumer Staples | |
| SubSector: Farm Products | |
| MarketCap: 295 Millions | |
| Recent Price: 11.17 Smart Investing & Trading Score: 100 | |
| Day Percent Change: 1.45% Day Change: 0.16 | |
| Week Change: 6.58% Year-to-date Change: 5.5% | |
| AFRI Links: Profile News Message Board | |
| Charts:- Daily , Weekly | |
| Add AFRI to Watchlist: View: Get Complete AFRI Trend Analysis ➞ | |
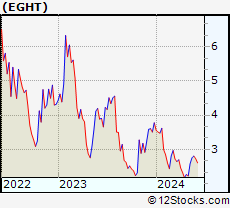 | EGHT 8x8, Inc. |
| Sector: Technology | |
| SubSector: Diversified Communication Services | |
| MarketCap: 1861.64 Millions | |
| Recent Price: 2.76 Smart Investing & Trading Score: 44 | |
| Day Percent Change: 2.99% Day Change: 0.08 | |
| Week Change: 6.56% Year-to-date Change: -27.0% | |
| EGHT Links: Profile News Message Board | |
| Charts:- Daily , Weekly | |
| Add EGHT to Watchlist: View: Get Complete EGHT Trend Analysis ➞ | |
| Too many stocks? View smallcap stocks filtered by marketcap & sector |
| Marketcap: All SmallCap Stocks (default-no microcap), Large, Mid-Range, Small & MicroCap |
| Sector: Tech, Finance, Energy, Staples, Retail, Industrial, Materials, Utilities & Medical |
|
Best Stocks Today 12Stocks.com |
© 2024 12Stocks.com Terms & Conditions Privacy Contact Us
All Information Provided Only For Education And Not To Be Used For Investing or Trading. See Terms & Conditions


One More Thing ... Get Best Stocks Delivered Daily!
Never Ever Miss A Move With Our Top Ten Stocks Lists
Find Best Stocks In Any Market - Bull or Bear Market
Take A Peek At Our Top Ten Stocks Lists: Daily, Weekly, Year-to-Date & Top Trends
Find Best Stocks In Any Market - Bull or Bear Market
Take A Peek At Our Top Ten Stocks Lists: Daily, Weekly, Year-to-Date & Top Trends
Smallcap Stocks With Best Up Trends [0-bearish to 100-bullish]: CommScope Holding[100], Coeur Mining[100], Hecla Mining[100], MicroStrategy [100], Enovix [100], Rayonier Advanced[100], Nurix [100], Energy Fuels[100], NovaGold Resources[100], Piedmont Lithium[100], Wave Life[100]
Best Smallcap Stocks Year-to-Date:
CareMax [495.88%], Bakkt [413.9%], Janux [338.34%], Viking [260.02%], Alpine Immune[241.23%], Longboard [238.63%], Avidity Biosciences[226.33%], Super Micro[212.35%], Arcutis Bio[184.83%], Sweetgreen [180.97%], Novavax [171.04%] Best Smallcap Stocks This Week:
Vaxxinity [58.82%], Novavax [46.51%], Vicarious Surgical[45.62%], Harrow Health[44.48%], ProKidney [44.31%], Workhorse Group[36.06%], Maxeon Solar[35.94%], Fossil Group[35.44%], Humacyte [34.68%], MicroStrategy [34.23%], Cadiz [33.48%] Best Smallcap Stocks Daily:
Vaxxinity [45.95%], Presto Automation[31.90%], Vicarious Surgical[27.93%], Orchestra BioMed[12.77%], CommScope Holding[11.86%], Coeur Mining[11.57%], Hecla Mining[11.11%], MicroStrategy [10.04%], Tenaya [9.65%], Bakkt [9.25%], Enovix [9.25%]