
 Login Sign Up


| |||||
 |  | ||||

| 12Stocks.com Market Intelligence |
Best SmallCap Stocks
|
| In a hurry? Small Cap Stock Lists: Performance Trends Table, Stock Charts
Sort Small Cap stocks: Daily, Weekly, Year-to-Date, Market Cap & Trends. Filter Small Cap stocks list by sector: Show all, Tech, Finance, Energy, Staples, Retail, Industrial, Materials, Utilities and HealthCare Filter Small Cap stocks list by size: All Large Medium Small and MicroCap |
| 12Stocks.com Small Cap Stocks Performances & Trends Daily | |||||||||
|
|  The overall Smart Investing & Trading Score is 76 (0-bearish to 100-bullish) which puts Small Cap index in short term neutral to bullish trend. The Smart Investing & Trading Score from previous trading session is 90 and hence a deterioration of trend.
| ||||||||
Here are the Smart Investing & Trading Scores of the most requested small cap stocks at 12Stocks.com (click stock name for detailed review):
|


| 12Stocks.com: Investing in Smallcap Index with Stocks | |
|
The following table helps investors and traders sort through current performance and trends (as measured by Smart Investing & Trading Score) of various
stocks in the Smallcap Index. Quick View: Move mouse or cursor over stock symbol (ticker) to view short-term technical chart and over stock name to view long term chart. Click on  to add stock symbol to your watchlist and to add stock symbol to your watchlist and  to view watchlist. Click on any ticker or stock name for detailed market intelligence report for that stock. to view watchlist. Click on any ticker or stock name for detailed market intelligence report for that stock. |
12Stocks.com Performance of Stocks in Smallcap Index
| Ticker | Stock Name | Watchlist | Category | Recent Price | Smart Investing & Trading Score | Change % | YTD Change% |
| ENVX | Enovix |   | Industrials | 10.04 | 100 | 9.25% | -20.25% |
| RYAM | Rayonier Advanced | | Materials | 4.92 | 100 | 8.61% | 21.48% |
| NRIX | Nurix | | Health Care | 16.59 | 100 | 7.73% | 60.60% |
| UUUU | Energy Fuels | | Materials | 6.68 | 100 | 7.40% | -7.09% |
| NG | NovaGold Resources | | Materials | 3.49 | 100 | 6.73% | -6.68% |
| WVE | Wave Life | | Health Care | 6.26 | 100 | 6.10% | 23.96% |
| ACDC | ProFrac Holding | | Energy | 9.01 | 100 | 5.38% | 5.88% |
| FOSL | Fossil Group | | Consumer Staples | 1.31 | 100 | 5.22% | -10.27% |
| LXU | LSB Industries | | Materials | 9.70 | 100 | 5.21% | 4.19% |
| GCI | Gannett Co | | Services & Goods | 3.72 | 100 | 4.79% | 61.74% |
| CZNC | Citizens & Northern | | Financials | 18.81 | 100 | 4.62% | -16.14% |
| FCCO | First Community | | Financials | 17.95 | 100 | 3.73% | -16.63% |
| HROW | Harrow Health | | Health Care | 16.76 | 100 | 3.71% | 49.64% |
| CDZI | Cadiz | | Utilities | 3.11 | 100 | 3.67% | 11.07% |
| AOMR | Angel Oak | | Financials | 12.69 | 100 | 3.51% | 19.60% |
| OB | Outbrain | | Services & Goods | 4.84 | 100 | 3.20% | 10.50% |
| BLFY | Blue Foundry | | Financials | 9.67 | 100 | 3.09% | 0.42% |
| LBRT | Liberty Oilfield | | Energy | 23.68 | 100 | 2.96% | 30.54% |
| ABUS | Arbutus Biopharma | | Health Care | 2.98 | 100 | 2.93% | 19.40% |
| SGHC | Super Group | | Services & Goods | 3.60 | 100 | 2.86% | 12.68% |
| PRIM | Primoris Services | | Industrials | 51.84 | 100 | 2.78% | 56.10% |
| NMRK | Newmark Group | | Financials | 11.22 | 100 | 2.75% | 2.37% |
| RNA | Avidity Biosciences | | Health Care | 29.50 | 100 | 2.72% | 226.33% |
| SHBI | Shore Bancshares | | Financials | 11.67 | 100 | 2.64% | -18.11% |
| FFIC | Flushing Financial | | Financials | 13.27 | 100 | 2.47% | -19.48% |


| Too many stocks? View smallcap stocks filtered by marketcap & sector |
| Marketcap: All SmallCap Stocks (default-no microcap), Large, Mid-Range, Small |
| Smallcap Sector: Tech, Finance, Energy, Staples, Retail, Industrial, Materials, & Medical |
|
Get the most comprehensive stock market coverage daily at 12Stocks.com ➞ Best Stocks Today ➞ Best Stocks Weekly ➞ Best Stocks Year-to-Date ➞ Best Stocks Trends ➞  Best Stocks Today 12Stocks.com Best Nasdaq Stocks ➞ Best S&P 500 Stocks ➞ Best Tech Stocks ➞ Best Biotech Stocks ➞ |
| Detailed Overview of SmallCap Stocks |
| SmallCap Technical Overview, Leaders & Laggards, Top SmallCap ETF Funds & Detailed SmallCap Stocks List, Charts, Trends & More |
| Smallcap: Technical Analysis, Trends & YTD Performance | |
| SmallCap segment as represented by
IWM, an exchange-traded fund [ETF], holds basket of thousands of smallcap stocks from across all major sectors of the US stock market. The smallcap index (contains stocks like Riverbed & Sotheby's) is up by 3.67% and is currently underperforming the overall market by -6.9% year-to-date. Below is a quick view of technical charts and trends: | |
 IWM Weekly Chart |
|
| Long Term Trend: Very Good | |
| Medium Term Trend: Very Good | |
 IWM Daily Chart |
|
| Short Term Trend: Good | |
| Overall Trend Score: 76 | |
| YTD Performance: 3.67% | |
| **Trend Scores & Views Are Only For Educational Purposes And Not For Investing | |
| 12Stocks.com: Top Performing Small Cap Index Stocks | ||||||||||||||||||||||||||||||||||||||||||||||||
 The top performing Small Cap Index stocks year to date are
Now, more recently, over last week, the top performing Small Cap Index stocks on the move are


|
||||||||||||||||||||||||||||||||||||||||||||||||
| 12Stocks.com: Investing in Smallcap Index using Exchange Traded Funds | |
|
The following table shows list of key exchange traded funds (ETF) that
help investors track Smallcap index. The following list also includes leveraged ETF funds that track twice or thrice the daily returns of Smallcap indices. Short or inverse ETF funds move in the opposite direction to the index they track and are useful during market pullbacks or during bear markets. Quick View: Move mouse or cursor over ETF symbol (ticker) to view short-term technical chart and over ETF name to view long term chart. Click on ticker or stock name for detailed view. Click on to add stock symbol to your watchlist and to view watchlist. |
12Stocks.com List of ETFs that track Smallcap Index
| Ticker | ETF Name | Watchlist | Recent Price | Smart Investing & Trading Score | Change % | Week % | Year-to-date % |
| IWM | iShares Russell 2000 | | 208.08 | 76 | 0.07 | 1.85 | 3.67% |
| VTWO | Vanguard Russell 2000 ETF | | 84.11 | 71 | 0.00 | 1.8 | 3.71% |
| IJR | iShares Core S&P Small-Cap | | 110.39 | 68 | -0.22 | 1.29 | 1.98% |
| IWN | iShares Russell 2000 Value | | 158.71 | 76 | -0.07 | 1.61 | 2.18% |
| IWO | iShares Russell 2000 Growth | | 265.15 | 63 | -0.75 | 2.01 | 5.13% |
| IJS | iShares S&P Small-Cap 600 Value | | 101.87 | 76 | -0.15 | 1.34 | -1.16% |
| IJT | iShares S&P Small-Cap 600 Growth | | 131.34 | 71 | 0.04 | 1.14 | 4.95% |
| XSLV | PowerShares S&P SmallCap Low Volatil ETF | | 44.48 | 83 | -0.01 | 0.55 | 0.74% |
| SAA | ProShares Ultra SmallCap600 | | 24.90 | 71 | 0.50 | 2.28 | -0.18% |
| SMLV | SPDR SSGA US Small Cap Low Volatil ETF | | 113.28 | 95 | 0.43 | 1.85 | 0.68% |
| SDD | ProShares UltraShort SmallCap600 | | 17.84 | 35 | 0.96 | -2.41 | -3.19% |
| SBB | ProShares Short SmallCap600 | | 15.77 | 25 | 0.41 | -1.14 | -0.98% |
| 12Stocks.com: Charts, Trends, Fundamental Data and Performances of SmallCap Stocks | |
|
We now take in-depth look at all SmallCap stocks including charts, multi-period performances and overall trends (as measured by Smart Investing & Trading Score). One can sort SmallCap stocks (click link to choose) by Daily, Weekly and by Year-to-Date performances. Also, one can sort by size of the company or by market capitalization. |
| Select Your Default Chart Type: | |||||
| |||||
| Click on stock symbol or name for detailed view. Click on to add stock symbol to your watchlist and to view watchlist. Quick View: Move mouse or cursor over "Daily" to quickly view daily technical stock chart and over "Weekly" to view weekly technical stock chart. | |||||

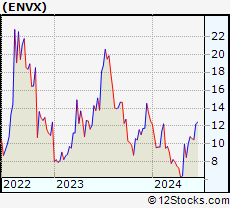 | ENVX Enovix Corporation |
| Sector: Industrials | |
| SubSector: Electrical Equipment & Parts | |
| MarketCap: 2740 Millions | |
| Recent Price: 10.04 Smart Investing & Trading Score: 100 | |
| Day Percent Change: 9.25% Day Change: 0.85 | |
| Week Change: 17.98% Year-to-date Change: -20.3% | |
| ENVX Links: Profile News Message Board | |
| Charts:- Daily , Weekly | |
| Add ENVX to Watchlist: View: Get Complete ENVX Trend Analysis ➞ | |
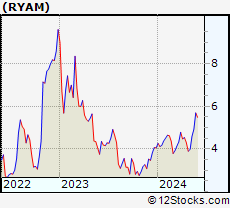 | RYAM Rayonier Advanced Materials Inc. |
| Sector: Materials | |
| SubSector: Chemicals - Major Diversified | |
| MarketCap: 116.736 Millions | |
| Recent Price: 4.92 Smart Investing & Trading Score: 100 | |
| Day Percent Change: 8.61% Day Change: 0.39 | |
| Week Change: 7.19% Year-to-date Change: 21.5% | |
| RYAM Links: Profile News Message Board | |
| Charts:- Daily , Weekly | |
| Add RYAM to Watchlist: View: Get Complete RYAM Trend Analysis ➞ | |
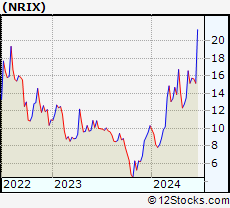 | NRIX Nurix Therapeutics, Inc. |
| Sector: Health Care | |
| SubSector: Biotechnology | |
| MarketCap: 16787 Millions | |
| Recent Price: 16.59 Smart Investing & Trading Score: 100 | |
| Day Percent Change: 7.73% Day Change: 1.19 | |
| Week Change: 22.8% Year-to-date Change: 60.6% | |
| NRIX Links: Profile News Message Board | |
| Charts:- Daily , Weekly | |
| Add NRIX to Watchlist: View: Get Complete NRIX Trend Analysis ➞ | |
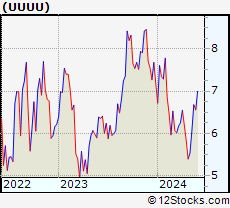 | UUUU Energy Fuels Inc. |
| Sector: Materials | |
| SubSector: Industrial Metals & Minerals | |
| MarketCap: 107.61 Millions | |
| Recent Price: 6.68 Smart Investing & Trading Score: 100 | |
| Day Percent Change: 7.40% Day Change: 0.46 | |
| Week Change: 9.87% Year-to-date Change: -7.1% | |
| UUUU Links: Profile News Message Board | |
| Charts:- Daily , Weekly | |
| Add UUUU to Watchlist: View: Get Complete UUUU Trend Analysis ➞ | |
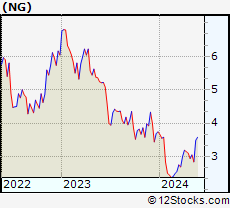 | NG NovaGold Resources Inc. |
| Sector: Materials | |
| SubSector: Gold | |
| MarketCap: 2499.49 Millions | |
| Recent Price: 3.49 Smart Investing & Trading Score: 100 | |
| Day Percent Change: 6.73% Day Change: 0.22 | |
| Week Change: 22.89% Year-to-date Change: -6.7% | |
| NG Links: Profile News Message Board | |
| Charts:- Daily , Weekly | |
| Add NG to Watchlist: View: Get Complete NG Trend Analysis ➞ | |
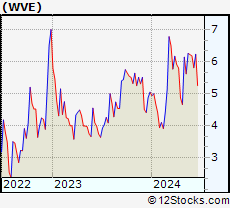 | WVE Wave Life Sciences Ltd. |
| Sector: Health Care | |
| SubSector: Biotechnology | |
| MarketCap: 452.785 Millions | |
| Recent Price: 6.26 Smart Investing & Trading Score: 100 | |
| Day Percent Change: 6.10% Day Change: 0.36 | |
| Week Change: 11.39% Year-to-date Change: 24.0% | |
| WVE Links: Profile News Message Board | |
| Charts:- Daily , Weekly | |
| Add WVE to Watchlist: View: Get Complete WVE Trend Analysis ➞ | |
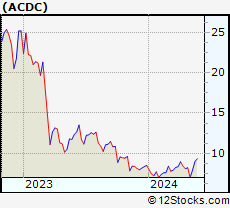 | ACDC ProFrac Holding Corp. |
| Sector: Energy | |
| SubSector: Oil & Gas Equipment & Services | |
| MarketCap: 1830 Millions | |
| Recent Price: 9.01 Smart Investing & Trading Score: 100 | |
| Day Percent Change: 5.38% Day Change: 0.46 | |
| Week Change: 13.48% Year-to-date Change: 5.9% | |
| ACDC Links: Profile News Message Board | |
| Charts:- Daily , Weekly | |
| Add ACDC to Watchlist: View: Get Complete ACDC Trend Analysis ➞ | |
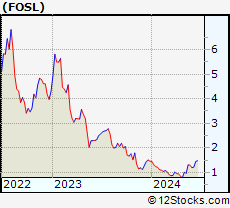 | FOSL Fossil Group, Inc. |
| Sector: Consumer Staples | |
| SubSector: Textile - Apparel Footwear & Accessories | |
| MarketCap: 215.87 Millions | |
| Recent Price: 1.31 Smart Investing & Trading Score: 100 | |
| Day Percent Change: 5.22% Day Change: 0.06 | |
| Week Change: 35.44% Year-to-date Change: -10.3% | |
| FOSL Links: Profile News Message Board | |
| Charts:- Daily , Weekly | |
| Add FOSL to Watchlist: View: Get Complete FOSL Trend Analysis ➞ | |
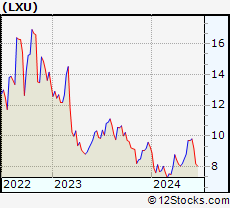 | LXU LSB Industries, Inc. |
| Sector: Materials | |
| SubSector: Chemicals - Major Diversified | |
| MarketCap: 51.7736 Millions | |
| Recent Price: 9.70 Smart Investing & Trading Score: 100 | |
| Day Percent Change: 5.21% Day Change: 0.48 | |
| Week Change: 10.1% Year-to-date Change: 4.2% | |
| LXU Links: Profile News Message Board | |
| Charts:- Daily , Weekly | |
| Add LXU to Watchlist: View: Get Complete LXU Trend Analysis ➞ | |
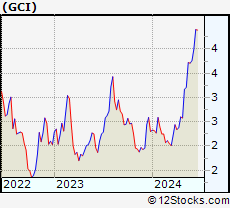 | GCI Gannett Co., Inc. |
| Sector: Services & Goods | |
| SubSector: Publishing - Newspapers | |
| MarketCap: 222.322 Millions | |
| Recent Price: 3.72 Smart Investing & Trading Score: 100 | |
| Day Percent Change: 4.79% Day Change: 0.17 | |
| Week Change: 15.89% Year-to-date Change: 61.7% | |
| GCI Links: Profile News Message Board | |
| Charts:- Daily , Weekly | |
| Add GCI to Watchlist: View: Get Complete GCI Trend Analysis ➞ | |
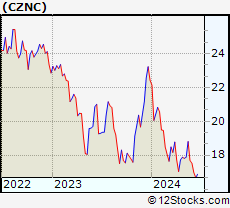 | CZNC Citizens & Northern Corporation |
| Sector: Financials | |
| SubSector: Regional - Mid-Atlantic Banks | |
| MarketCap: 274.459 Millions | |
| Recent Price: 18.81 Smart Investing & Trading Score: 100 | |
| Day Percent Change: 4.62% Day Change: 0.83 | |
| Week Change: 5.14% Year-to-date Change: -16.1% | |
| CZNC Links: Profile News Message Board | |
| Charts:- Daily , Weekly | |
| Add CZNC to Watchlist: View: Get Complete CZNC Trend Analysis ➞ | |
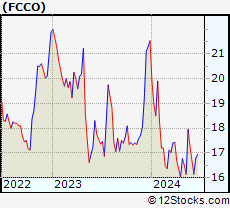 | FCCO First Community Corporation |
| Sector: Financials | |
| SubSector: Regional - Southwest Banks | |
| MarketCap: 123.865 Millions | |
| Recent Price: 17.95 Smart Investing & Trading Score: 100 | |
| Day Percent Change: 3.73% Day Change: 0.64 | |
| Week Change: 11.28% Year-to-date Change: -16.6% | |
| FCCO Links: Profile News Message Board | |
| Charts:- Daily , Weekly | |
| Add FCCO to Watchlist: View: Get Complete FCCO Trend Analysis ➞ | |
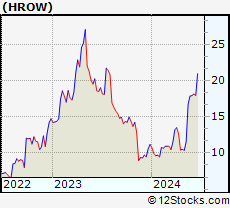 | HROW Harrow Health, Inc. |
| Sector: Health Care | |
| SubSector: Drug Manufacturers - Other | |
| MarketCap: 104.033 Millions | |
| Recent Price: 16.76 Smart Investing & Trading Score: 100 | |
| Day Percent Change: 3.71% Day Change: 0.60 | |
| Week Change: 44.48% Year-to-date Change: 49.6% | |
| HROW Links: Profile News Message Board | |
| Charts:- Daily , Weekly | |
| Add HROW to Watchlist: View: Get Complete HROW Trend Analysis ➞ | |
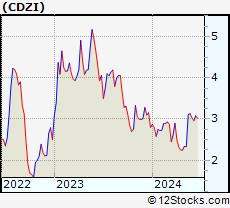 | CDZI Cadiz Inc. |
| Sector: Utilities | |
| SubSector: Water Utilities | |
| MarketCap: 265.502 Millions | |
| Recent Price: 3.11 Smart Investing & Trading Score: 100 | |
| Day Percent Change: 3.67% Day Change: 0.11 | |
| Week Change: 33.48% Year-to-date Change: 11.1% | |
| CDZI Links: Profile News Message Board | |
| Charts:- Daily , Weekly | |
| Add CDZI to Watchlist: View: Get Complete CDZI Trend Analysis ➞ | |
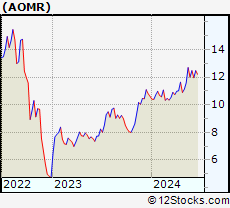 | AOMR Angel Oak Mortgage REIT, Inc. |
| Sector: Financials | |
| SubSector: REIT - Mortgage | |
| MarketCap: 202 Millions | |
| Recent Price: 12.69 Smart Investing & Trading Score: 100 | |
| Day Percent Change: 3.51% Day Change: 0.43 | |
| Week Change: 9.59% Year-to-date Change: 19.6% | |
| AOMR Links: Profile News Message Board | |
| Charts:- Daily , Weekly | |
| Add AOMR to Watchlist: View: Get Complete AOMR Trend Analysis ➞ | |
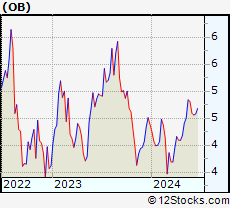 | OB Outbrain Inc. |
| Sector: Services & Goods | |
| SubSector: Internet Content & Information | |
| MarketCap: 250 Millions | |
| Recent Price: 4.84 Smart Investing & Trading Score: 100 | |
| Day Percent Change: 3.20% Day Change: 0.15 | |
| Week Change: 7.56% Year-to-date Change: 10.5% | |
| OB Links: Profile News Message Board | |
| Charts:- Daily , Weekly | |
| Add OB to Watchlist: View: Get Complete OB Trend Analysis ➞ | |
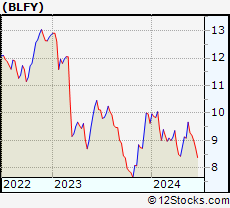 | BLFY Blue Foundry Bancorp |
| Sector: Financials | |
| SubSector: Banks - Regional | |
| MarketCap: 264 Millions | |
| Recent Price: 9.67 Smart Investing & Trading Score: 100 | |
| Day Percent Change: 3.09% Day Change: 0.29 | |
| Week Change: 6.38% Year-to-date Change: 0.4% | |
| BLFY Links: Profile News Message Board | |
| Charts:- Daily , Weekly | |
| Add BLFY to Watchlist: View: Get Complete BLFY Trend Analysis ➞ | |
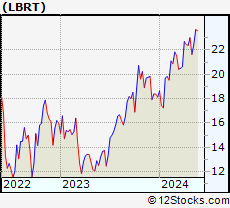 | LBRT Liberty Oilfield Services Inc. |
| Sector: Energy | |
| SubSector: Oil & Gas Equipment & Services | |
| MarketCap: 308.261 Millions | |
| Recent Price: 23.68 Smart Investing & Trading Score: 100 | |
| Day Percent Change: 2.96% Day Change: 0.68 | |
| Week Change: 5.48% Year-to-date Change: 30.5% | |
| LBRT Links: Profile News Message Board | |
| Charts:- Daily , Weekly | |
| Add LBRT to Watchlist: View: Get Complete LBRT Trend Analysis ➞ | |
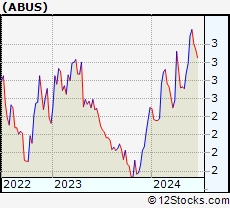 | ABUS Arbutus Biopharma Corporation |
| Sector: Health Care | |
| SubSector: Biotechnology | |
| MarketCap: 110.885 Millions | |
| Recent Price: 2.98 Smart Investing & Trading Score: 100 | |
| Day Percent Change: 2.93% Day Change: 0.08 | |
| Week Change: 3.65% Year-to-date Change: 19.4% | |
| ABUS Links: Profile News Message Board | |
| Charts:- Daily , Weekly | |
| Add ABUS to Watchlist: View: Get Complete ABUS Trend Analysis ➞ | |
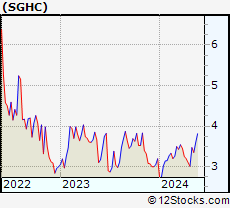 | SGHC Super Group (SGHC) Limited |
| Sector: Services & Goods | |
| SubSector: Gambling | |
| MarketCap: 1390 Millions | |
| Recent Price: 3.60 Smart Investing & Trading Score: 100 | |
| Day Percent Change: 2.86% Day Change: 0.10 | |
| Week Change: 7.46% Year-to-date Change: 12.7% | |
| SGHC Links: Profile News Message Board | |
| Charts:- Daily , Weekly | |
| Add SGHC to Watchlist: View: Get Complete SGHC Trend Analysis ➞ | |
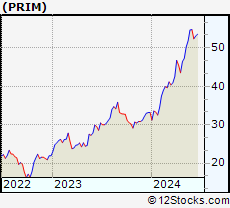 | PRIM Primoris Services Corporation |
| Sector: Industrials | |
| SubSector: Heavy Construction | |
| MarketCap: 931.895 Millions | |
| Recent Price: 51.84 Smart Investing & Trading Score: 100 | |
| Day Percent Change: 2.78% Day Change: 1.40 | |
| Week Change: 3.18% Year-to-date Change: 56.1% | |
| PRIM Links: Profile News Message Board | |
| Charts:- Daily , Weekly | |
| Add PRIM to Watchlist: View: Get Complete PRIM Trend Analysis ➞ | |
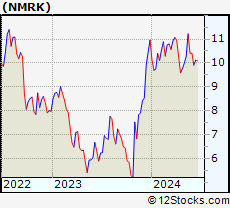 | NMRK Newmark Group, Inc. |
| Sector: Financials | |
| SubSector: Property Management | |
| MarketCap: 767.542 Millions | |
| Recent Price: 11.22 Smart Investing & Trading Score: 100 | |
| Day Percent Change: 2.75% Day Change: 0.30 | |
| Week Change: 9.2% Year-to-date Change: 2.4% | |
| NMRK Links: Profile News Message Board | |
| Charts:- Daily , Weekly | |
| Add NMRK to Watchlist: View: Get Complete NMRK Trend Analysis ➞ | |
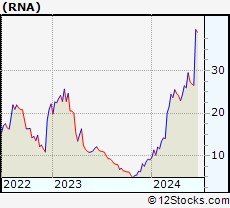 | RNA Avidity Biosciences, Inc. |
| Sector: Health Care | |
| SubSector: Biotechnology | |
| MarketCap: 12287 Millions | |
| Recent Price: 29.50 Smart Investing & Trading Score: 100 | |
| Day Percent Change: 2.72% Day Change: 0.78 | |
| Week Change: 13.64% Year-to-date Change: 226.3% | |
| RNA Links: Profile News Message Board | |
| Charts:- Daily , Weekly | |
| Add RNA to Watchlist: View: Get Complete RNA Trend Analysis ➞ | |
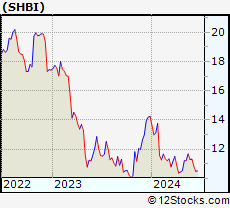 | SHBI Shore Bancshares, Inc. |
| Sector: Financials | |
| SubSector: Regional - Mid-Atlantic Banks | |
| MarketCap: 131.359 Millions | |
| Recent Price: 11.67 Smart Investing & Trading Score: 100 | |
| Day Percent Change: 2.64% Day Change: 0.30 | |
| Week Change: 4.1% Year-to-date Change: -18.1% | |
| SHBI Links: Profile News Message Board | |
| Charts:- Daily , Weekly | |
| Add SHBI to Watchlist: View: Get Complete SHBI Trend Analysis ➞ | |
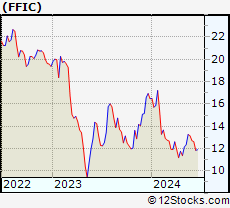 | FFIC Flushing Financial Corporation |
| Sector: Financials | |
| SubSector: Savings & Loans | |
| MarketCap: 336.43 Millions | |
| Recent Price: 13.27 Smart Investing & Trading Score: 100 | |
| Day Percent Change: 2.47% Day Change: 0.32 | |
| Week Change: 7.45% Year-to-date Change: -19.5% | |
| FFIC Links: Profile News Message Board | |
| Charts:- Daily , Weekly | |
| Add FFIC to Watchlist: View: Get Complete FFIC Trend Analysis ➞ | |
| Too many stocks? View smallcap stocks filtered by marketcap & sector |
| Marketcap: All SmallCap Stocks (default-no microcap), Large, Mid-Range, Small & MicroCap |
| Sector: Tech, Finance, Energy, Staples, Retail, Industrial, Materials, Utilities & Medical |
|
Best Stocks Today 12Stocks.com |
© 2024 12Stocks.com Terms & Conditions Privacy Contact Us
All Information Provided Only For Education And Not To Be Used For Investing or Trading. See Terms & Conditions


One More Thing ... Get Best Stocks Delivered Daily!
Never Ever Miss A Move With Our Top Ten Stocks Lists
Find Best Stocks In Any Market - Bull or Bear Market
Take A Peek At Our Top Ten Stocks Lists: Daily, Weekly, Year-to-Date & Top Trends
Find Best Stocks In Any Market - Bull or Bear Market
Take A Peek At Our Top Ten Stocks Lists: Daily, Weekly, Year-to-Date & Top Trends
Smallcap Stocks With Best Up Trends [0-bearish to 100-bullish]: CommScope Holding[100], Coeur Mining[100], Hecla Mining[100], MicroStrategy [100], Enovix [100], Rayonier Advanced[100], Nurix [100], Energy Fuels[100], NovaGold Resources[100], Piedmont Lithium[100], Wave Life[100]
Best Smallcap Stocks Year-to-Date:
CareMax [495.88%], Bakkt [413.9%], Janux [338.34%], Viking [260.02%], Alpine Immune[241.23%], Longboard [238.63%], Avidity Biosciences[226.33%], Super Micro[212.35%], Arcutis Bio[184.83%], Sweetgreen [180.97%], Novavax [171.04%] Best Smallcap Stocks This Week:
Vaxxinity [58.82%], Novavax [46.51%], Vicarious Surgical[45.62%], Harrow Health[44.48%], ProKidney [44.31%], Workhorse Group[36.06%], Maxeon Solar[35.94%], Fossil Group[35.44%], Humacyte [34.68%], MicroStrategy [34.23%], Cadiz [33.48%] Best Smallcap Stocks Daily:
Vaxxinity [45.95%], Presto Automation[31.90%], Vicarious Surgical[27.93%], Orchestra BioMed[12.77%], CommScope Holding[11.86%], Coeur Mining[11.57%], Hecla Mining[11.11%], MicroStrategy [10.04%], Tenaya [9.65%], Bakkt [9.25%], Enovix [9.25%]