
 Login Sign Up


| |||||
 |  | ||||

| 12Stocks.com Market Intelligence |
Best SmallCap Stocks
|
| In a hurry? Small Cap Stock Lists: Performance Trends Table, Stock Charts
Sort Small Cap stocks: Daily, Weekly, Year-to-Date, Market Cap & Trends. Filter Small Cap stocks list by sector: Show all, Tech, Finance, Energy, Staples, Retail, Industrial, Materials, Utilities and HealthCare Filter Small Cap stocks list by size: All Large Medium Small and MicroCap |
| 12Stocks.com Small Cap Stocks Performances & Trends Daily | |||||||||
|
|  The overall Smart Investing & Trading Score is 86 (0-bearish to 100-bullish) which puts Small Cap index in short term bullish trend. The Smart Investing & Trading Score from previous trading session is 48 and hence an improvement of trend.
| ||||||||
Here are the Smart Investing & Trading Scores of the most requested small cap stocks at 12Stocks.com (click stock name for detailed review):
|


| 12Stocks.com: Investing in Smallcap Index with Stocks | |
|
The following table helps investors and traders sort through current performance and trends (as measured by Smart Investing & Trading Score) of various
stocks in the Smallcap Index. Quick View: Move mouse or cursor over stock symbol (ticker) to view short-term technical chart and over stock name to view long term chart. Click on  to add stock symbol to your watchlist and to add stock symbol to your watchlist and  to view watchlist. Click on any ticker or stock name for detailed market intelligence report for that stock. to view watchlist. Click on any ticker or stock name for detailed market intelligence report for that stock. |
12Stocks.com Performance of Stocks in Smallcap Index
| Ticker | Stock Name | Watchlist | Category | Recent Price | Smart Investing & Trading Score | Change % | Weekly Change% |
| IIIN | Insteel Industries |   | Materials | 32.87 | 42 | 1.64% | 2.59% |
| ITCI | Intra-Cellular Therapies | | Health Care | 67.24 | 42 | 2.42% | 2.59% |
| JBLU | JetBlue Airways | | Transports | 5.59 | 37 | 5.08% | 2.57% |
| IMMR | Immersion | | Technology | 9.99 | 76 | -0.30% | 2.57% |
| PLAY | Dave & Buster s Entertainment | | Services & Goods | 51.09 | 32 | 5.06% | 2.57% |
| SDRL | Seadrill | | Energy | 51.87 | 68 | 2.23% | 2.57% |
| LCII | LCI Industries | | Consumer Staples | 109.88 | 42 | 0.54% | 2.55% |
| OSW | OneSpaWorld | | Services & Goods | 15.55 | 93 | 1.90% | 2.54% |
| ORA | Ormat | | Utilities | 75.40 | 100 | 0.19% | 2.52% |
| OGS | ONE Gas | | Utilities | 61.63 | 68 | 3.84% | 2.51% |
| AMBC | Ambac Financial | | Financials | 17.72 | 93 | 1.03% | 2.49% |
| LIVN | LivaNova | | Health Care | 61.07 | 61 | 0.39% | 2.47% |
| HP | Helmerich & Payne | | Energy | 38.06 | 32 | 3.06% | 2.45% |
| NBR | Nabors Industries | | Energy | 74.76 | 27 | 3.99% | 2.45% |
| MGEE | MGE Energy | | Utilities | 80.13 | 68 | 2.55% | 2.44% |
| MLR | Miller Industries | | Consumer Staples | 60.80 | 100 | 2.63% | 2.44% |
| SNFCA | Security National | | Financials | 8.03 | 67 | 3.21% | 2.42% |
| CBL | CBL & Associates Properties | | Financials | 22.10 | 52 | 1.19% | 2.41% |
| PLYM | Plymouth Industrial | | Financials | 20.86 | 42 | 2.05% | 2.41% |
| NE | Noble | | Energy | 46.46 | 58 | 1.55% | 2.40% |
| CRAI | CRA | | Services & Goods | 175.97 | 88 | 4.13% | 2.40% |
| TRTX | TPG RE | | Financials | 8.58 | 68 | 0.47% | 2.39% |
| DOCN | DigitalOcean | | Technology | 37.05 | 42 | 0.68% | 2.38% |
| TNGX | Tango | | Health Care | 6.92 | 42 | 3.90% | 2.37% |
| PTLO | Portillos | | Services & Goods | 10.02 | 17 | 0.30% | 2.35% |


| Too many stocks? View smallcap stocks filtered by marketcap & sector |
| Marketcap: All SmallCap Stocks (default-no microcap), Large, Mid-Range, Small |
| Smallcap Sector: Tech, Finance, Energy, Staples, Retail, Industrial, Materials, & Medical |
|
Get the most comprehensive stock market coverage daily at 12Stocks.com ➞ Best Stocks Today ➞ Best Stocks Weekly ➞ Best Stocks Year-to-Date ➞ Best Stocks Trends ➞  Best Stocks Today 12Stocks.com Best Nasdaq Stocks ➞ Best S&P 500 Stocks ➞ Best Tech Stocks ➞ Best Biotech Stocks ➞ |
| Detailed Overview of SmallCap Stocks |
| SmallCap Technical Overview, Leaders & Laggards, Top SmallCap ETF Funds & Detailed SmallCap Stocks List, Charts, Trends & More |
| Smallcap: Technical Analysis, Trends & YTD Performance | |
| SmallCap segment as represented by
IWM, an exchange-traded fund [ETF], holds basket of thousands of smallcap stocks from across all major sectors of the US stock market. The smallcap index (contains stocks like Riverbed & Sotheby's) is up by 2.52% and is currently underperforming the overall market by -7.27% year-to-date. Below is a quick view of technical charts and trends: | |
 IWM Weekly Chart |
|
| Long Term Trend: Very Good | |
| Medium Term Trend: Very Good | |
 IWM Daily Chart |
|
| Short Term Trend: Very Good | |
| Overall Trend Score: 86 | |
| YTD Performance: 2.52% | |
| **Trend Scores & Views Are Only For Educational Purposes And Not For Investing | |
| 12Stocks.com: Top Performing Small Cap Index Stocks | ||||||||||||||||||||||||||||||||||||||||||||||||
 The top performing Small Cap Index stocks year to date are
Now, more recently, over last week, the top performing Small Cap Index stocks on the move are


|
||||||||||||||||||||||||||||||||||||||||||||||||
| 12Stocks.com: Investing in Smallcap Index using Exchange Traded Funds | |
|
The following table shows list of key exchange traded funds (ETF) that
help investors track Smallcap index. The following list also includes leveraged ETF funds that track twice or thrice the daily returns of Smallcap indices. Short or inverse ETF funds move in the opposite direction to the index they track and are useful during market pullbacks or during bear markets. Quick View: Move mouse or cursor over ETF symbol (ticker) to view short-term technical chart and over ETF name to view long term chart. Click on ticker or stock name for detailed view. Click on to add stock symbol to your watchlist and to view watchlist. |
12Stocks.com List of ETFs that track Smallcap Index
| Ticker | ETF Name | Watchlist | Recent Price | Smart Investing & Trading Score | Change % | Week % | Year-to-date % |
| IWM | iShares Russell 2000 | | 205.77 | 86 | 0.84 | 0.16 | 2.52% |
| IJR | iShares Core S&P Small-Cap | | 109.65 | 93 | 1.14 | 0.76 | 1.29% |
| IWN | iShares Russell 2000 Value | | 155.88 | 76 | 1.17 | 0.46 | 0.35% |
| IWO | iShares Russell 2000 Growth | | 263.62 | 68 | 0.33 | -0.29 | 4.52% |
| VTWO | Vanguard Russell 2000 ETF | | 82.52 | 51 | -0.08 | -0.66 | 1.75% |
| IJS | iShares S&P Small-Cap 600 Value | | 99.74 | 37 | 0.69 | 0.18 | -3.23% |
| IJT | iShares S&P Small-Cap 600 Growth | | 130.21 | 81 | 0.05 | -0.33 | 4.05% |
| XSLV | PowerShares S&P SmallCap Low Volatil ETF | | 43.66 | 48 | 0.72 | -0.23 | -1.11% |
| SBB | ProShares Short SmallCap600 | | 15.97 | 20 | -0.62 | -0.28 | 0.25% |
| SAA | ProShares Ultra SmallCap600 | | 24.16 | 58 | 0.73 | 0.03 | -3.17% |
| SDD | ProShares UltraShort SmallCap600 | | 18.11 | 17 | -2.53 | -1.36 | -1.72% |
| SMLV | SPDR SSGA US Small Cap Low Volatil ETF | | 110.05 | 55 | 0.89 | -0.16 | -2.2% |
| 12Stocks.com: Charts, Trends, Fundamental Data and Performances of SmallCap Stocks | |
|
We now take in-depth look at all SmallCap stocks including charts, multi-period performances and overall trends (as measured by Smart Investing & Trading Score). One can sort SmallCap stocks (click link to choose) by Daily, Weekly and by Year-to-Date performances. Also, one can sort by size of the company or by market capitalization. |
| Select Your Default Chart Type: | |||||
| |||||
| Click on stock symbol or name for detailed view. Click on to add stock symbol to your watchlist and to view watchlist. Quick View: Move mouse or cursor over "Daily" to quickly view daily technical stock chart and over "Weekly" to view weekly technical stock chart. | |||||

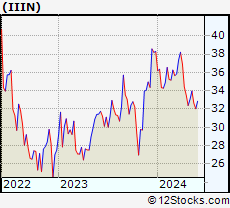 | IIIN Insteel Industries, Inc. |
| Sector: Materials | |
| SubSector: Steel & Iron | |
| MarketCap: 269.488 Millions | |
| Recent Price: 32.87 Smart Investing & Trading Score: 42 | |
| Day Percent Change: 1.64% Day Change: 0.53 | |
| Week Change: 2.59% Year-to-date Change: -14.2% | |
| IIIN Links: Profile News Message Board | |
| Charts:- Daily , Weekly | |
| Add IIIN to Watchlist: View: Get Complete IIIN Trend Analysis ➞ | |
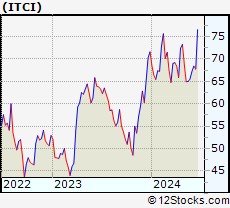 | ITCI Intra-Cellular Therapies, Inc. |
| Sector: Health Care | |
| SubSector: Biotechnology | |
| MarketCap: 991.885 Millions | |
| Recent Price: 67.24 Smart Investing & Trading Score: 42 | |
| Day Percent Change: 2.42% Day Change: 1.59 | |
| Week Change: 2.59% Year-to-date Change: -6.1% | |
| ITCI Links: Profile News Message Board | |
| Charts:- Daily , Weekly | |
| Add ITCI to Watchlist: View: Get Complete ITCI Trend Analysis ➞ | |
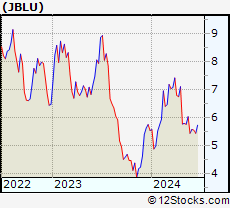 | JBLU JetBlue Airways Corporation |
| Sector: Transports | |
| SubSector: Regional Airlines | |
| MarketCap: 2383.1 Millions | |
| Recent Price: 5.59 Smart Investing & Trading Score: 37 | |
| Day Percent Change: 5.08% Day Change: 0.27 | |
| Week Change: 2.57% Year-to-date Change: 0.7% | |
| JBLU Links: Profile News Message Board | |
| Charts:- Daily , Weekly | |
| Add JBLU to Watchlist: View: Get Complete JBLU Trend Analysis ➞ | |
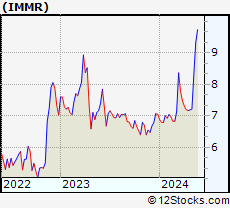 | IMMR Immersion Corporation |
| Sector: Technology | |
| SubSector: Application Software | |
| MarketCap: 173.462 Millions | |
| Recent Price: 9.99 Smart Investing & Trading Score: 76 | |
| Day Percent Change: -0.30% Day Change: -0.03 | |
| Week Change: 2.57% Year-to-date Change: 41.5% | |
| IMMR Links: Profile News Message Board | |
| Charts:- Daily , Weekly | |
| Add IMMR to Watchlist: View: Get Complete IMMR Trend Analysis ➞ | |
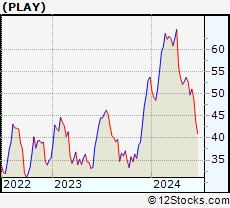 | PLAY Dave & Buster s Entertainment, Inc. |
| Sector: Services & Goods | |
| SubSector: Restaurants | |
| MarketCap: 283.07 Millions | |
| Recent Price: 51.09 Smart Investing & Trading Score: 32 | |
| Day Percent Change: 5.06% Day Change: 2.46 | |
| Week Change: 2.57% Year-to-date Change: -5.1% | |
| PLAY Links: Profile News Message Board | |
| Charts:- Daily , Weekly | |
| Add PLAY to Watchlist: View: Get Complete PLAY Trend Analysis ➞ | |
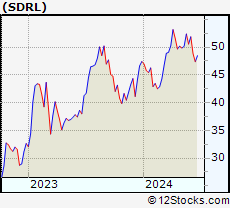 | SDRL Seadrill Limited |
| Sector: Energy | |
| SubSector: Oil & Gas Drilling | |
| MarketCap: 3300 Millions | |
| Recent Price: 51.87 Smart Investing & Trading Score: 68 | |
| Day Percent Change: 2.23% Day Change: 1.13 | |
| Week Change: 2.57% Year-to-date Change: 9.4% | |
| SDRL Links: Profile News Message Board | |
| Charts:- Daily , Weekly | |
| Add SDRL to Watchlist: View: Get Complete SDRL Trend Analysis ➞ | |
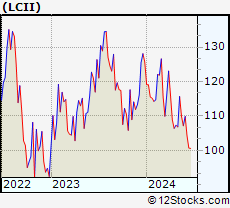 | LCII LCI Industries |
| Sector: Consumer Staples | |
| SubSector: Recreational Vehicles | |
| MarketCap: 1663.59 Millions | |
| Recent Price: 109.88 Smart Investing & Trading Score: 42 | |
| Day Percent Change: 0.54% Day Change: 0.59 | |
| Week Change: 2.55% Year-to-date Change: -12.6% | |
| LCII Links: Profile News Message Board | |
| Charts:- Daily , Weekly | |
| Add LCII to Watchlist: View: Get Complete LCII Trend Analysis ➞ | |
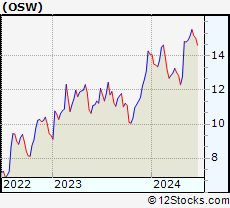 | OSW OneSpaWorld Holdings Limited |
| Sector: Services & Goods | |
| SubSector: Resorts & Casinos | |
| MarketCap: 228.394 Millions | |
| Recent Price: 15.55 Smart Investing & Trading Score: 93 | |
| Day Percent Change: 1.90% Day Change: 0.29 | |
| Week Change: 2.54% Year-to-date Change: 10.3% | |
| OSW Links: Profile News Message Board | |
| Charts:- Daily , Weekly | |
| Add OSW to Watchlist: View: Get Complete OSW Trend Analysis ➞ | |
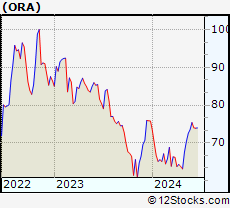 | ORA Ormat Technologies, Inc. |
| Sector: Utilities | |
| SubSector: Electric Utilities | |
| MarketCap: 3610.74 Millions | |
| Recent Price: 75.40 Smart Investing & Trading Score: 100 | |
| Day Percent Change: 0.19% Day Change: 0.14 | |
| Week Change: 2.52% Year-to-date Change: -0.5% | |
| ORA Links: Profile News Message Board | |
| Charts:- Daily , Weekly | |
| Add ORA to Watchlist: View: Get Complete ORA Trend Analysis ➞ | |
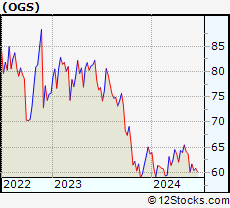 | OGS ONE Gas, Inc. |
| Sector: Utilities | |
| SubSector: Gas Utilities | |
| MarketCap: 4051.17 Millions | |
| Recent Price: 61.63 Smart Investing & Trading Score: 68 | |
| Day Percent Change: 3.84% Day Change: 2.28 | |
| Week Change: 2.51% Year-to-date Change: -3.3% | |
| OGS Links: Profile News Message Board | |
| Charts:- Daily , Weekly | |
| Add OGS to Watchlist: View: Get Complete OGS Trend Analysis ➞ | |
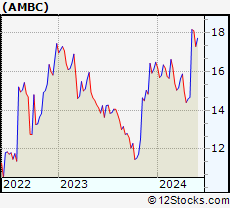 | AMBC Ambac Financial Group, Inc. |
| Sector: Financials | |
| SubSector: Surety & Title Insurance | |
| MarketCap: 587.818 Millions | |
| Recent Price: 17.72 Smart Investing & Trading Score: 93 | |
| Day Percent Change: 1.03% Day Change: 0.18 | |
| Week Change: 2.49% Year-to-date Change: 7.5% | |
| AMBC Links: Profile News Message Board | |
| Charts:- Daily , Weekly | |
| Add AMBC to Watchlist: View: Get Complete AMBC Trend Analysis ➞ | |
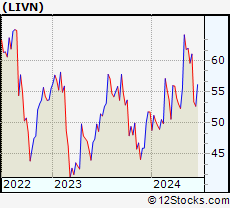 | LIVN LivaNova PLC |
| Sector: Health Care | |
| SubSector: Medical Appliances & Equipment | |
| MarketCap: 2060.5 Millions | |
| Recent Price: 61.07 Smart Investing & Trading Score: 61 | |
| Day Percent Change: 0.39% Day Change: 0.24 | |
| Week Change: 2.47% Year-to-date Change: 18.0% | |
| LIVN Links: Profile News Message Board | |
| Charts:- Daily , Weekly | |
| Add LIVN to Watchlist: View: Get Complete LIVN Trend Analysis ➞ | |
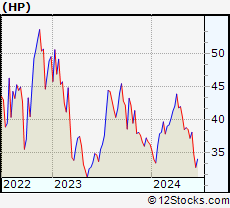 | HP Helmerich & Payne, Inc. |
| Sector: Energy | |
| SubSector: Oil & Gas Drilling & Exploration | |
| MarketCap: 1796.39 Millions | |
| Recent Price: 38.06 Smart Investing & Trading Score: 32 | |
| Day Percent Change: 3.06% Day Change: 1.13 | |
| Week Change: 2.45% Year-to-date Change: 5.1% | |
| HP Links: Profile News Message Board | |
| Charts:- Daily , Weekly | |
| Add HP to Watchlist: View: Get Complete HP Trend Analysis ➞ | |
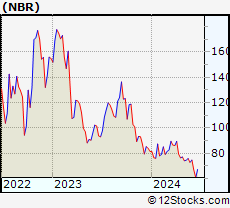 | NBR Nabors Industries Ltd. |
| Sector: Energy | |
| SubSector: Oil & Gas Drilling & Exploration | |
| MarketCap: 240.539 Millions | |
| Recent Price: 74.76 Smart Investing & Trading Score: 27 | |
| Day Percent Change: 3.99% Day Change: 2.87 | |
| Week Change: 2.45% Year-to-date Change: -8.4% | |
| NBR Links: Profile News Message Board | |
| Charts:- Daily , Weekly | |
| Add NBR to Watchlist: View: Get Complete NBR Trend Analysis ➞ | |
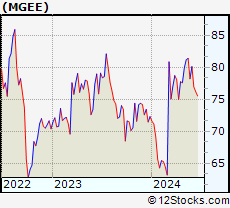 | MGEE MGE Energy, Inc. |
| Sector: Utilities | |
| SubSector: Diversified Utilities | |
| MarketCap: 2608.3 Millions | |
| Recent Price: 80.13 Smart Investing & Trading Score: 68 | |
| Day Percent Change: 2.55% Day Change: 1.99 | |
| Week Change: 2.44% Year-to-date Change: 10.8% | |
| MGEE Links: Profile News Message Board | |
| Charts:- Daily , Weekly | |
| Add MGEE to Watchlist: View: Get Complete MGEE Trend Analysis ➞ | |
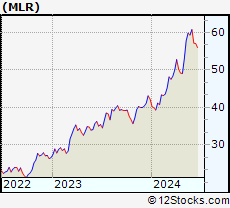 | MLR Miller Industries, Inc. |
| Sector: Consumer Staples | |
| SubSector: Auto Parts | |
| MarketCap: 335.239 Millions | |
| Recent Price: 60.80 Smart Investing & Trading Score: 100 | |
| Day Percent Change: 2.63% Day Change: 1.56 | |
| Week Change: 2.44% Year-to-date Change: 43.8% | |
| MLR Links: Profile News Message Board | |
| Charts:- Daily , Weekly | |
| Add MLR to Watchlist: View: Get Complete MLR Trend Analysis ➞ | |
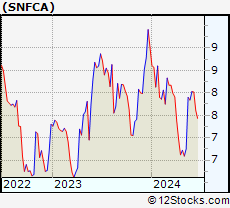 | SNFCA Security National Financial Corporation |
| Sector: Financials | |
| SubSector: Credit Services | |
| MarketCap: 81.0208 Millions | |
| Recent Price: 8.03 Smart Investing & Trading Score: 67 | |
| Day Percent Change: 3.21% Day Change: 0.25 | |
| Week Change: 2.42% Year-to-date Change: -10.8% | |
| SNFCA Links: Profile News Message Board | |
| Charts:- Daily , Weekly | |
| Add SNFCA to Watchlist: View: Get Complete SNFCA Trend Analysis ➞ | |
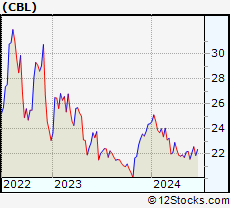 | CBL CBL & Associates Properties, Inc. |
| Sector: Financials | |
| SubSector: REIT - Retail | |
| MarketCap: 690 Millions | |
| Recent Price: 22.10 Smart Investing & Trading Score: 52 | |
| Day Percent Change: 1.19% Day Change: 0.26 | |
| Week Change: 2.41% Year-to-date Change: -9.5% | |
| CBL Links: Profile News Message Board | |
| Charts:- Daily , Weekly | |
| Add CBL to Watchlist: View: Get Complete CBL Trend Analysis ➞ | |
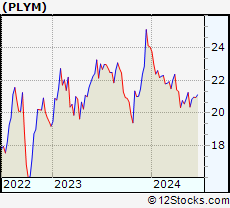 | PLYM Plymouth Industrial REIT, Inc. |
| Sector: Financials | |
| SubSector: REIT - Industrial | |
| MarketCap: 153.449 Millions | |
| Recent Price: 20.86 Smart Investing & Trading Score: 42 | |
| Day Percent Change: 2.05% Day Change: 0.42 | |
| Week Change: 2.41% Year-to-date Change: -13.3% | |
| PLYM Links: Profile News Message Board | |
| Charts:- Daily , Weekly | |
| Add PLYM to Watchlist: View: Get Complete PLYM Trend Analysis ➞ | |
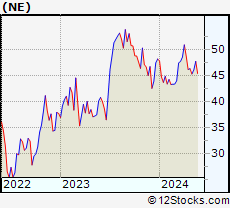 | NE Noble Corporation Plc |
| Sector: Energy | |
| SubSector: Oil & Gas Drilling | |
| MarketCap: 5520 Millions | |
| Recent Price: 46.46 Smart Investing & Trading Score: 58 | |
| Day Percent Change: 1.55% Day Change: 0.71 | |
| Week Change: 2.4% Year-to-date Change: -3.5% | |
| NE Links: Profile News Message Board | |
| Charts:- Daily , Weekly | |
| Add NE to Watchlist: View: Get Complete NE Trend Analysis ➞ | |
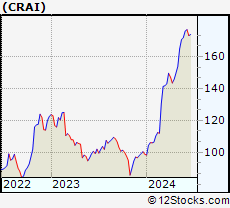 | CRAI CRA International, Inc. |
| Sector: Services & Goods | |
| SubSector: Management Services | |
| MarketCap: 209.645 Millions | |
| Recent Price: 175.97 Smart Investing & Trading Score: 88 | |
| Day Percent Change: 4.13% Day Change: 6.98 | |
| Week Change: 2.4% Year-to-date Change: 78.0% | |
| CRAI Links: Profile News Message Board | |
| Charts:- Daily , Weekly | |
| Add CRAI to Watchlist: View: Get Complete CRAI Trend Analysis ➞ | |
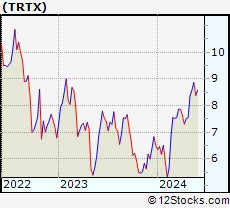 | TRTX TPG RE Finance Trust, Inc. |
| Sector: Financials | |
| SubSector: Mortgage Investment | |
| MarketCap: 607.739 Millions | |
| Recent Price: 8.58 Smart Investing & Trading Score: 68 | |
| Day Percent Change: 0.47% Day Change: 0.04 | |
| Week Change: 2.39% Year-to-date Change: 32.0% | |
| TRTX Links: Profile News Message Board | |
| Charts:- Daily , Weekly | |
| Add TRTX to Watchlist: View: Get Complete TRTX Trend Analysis ➞ | |
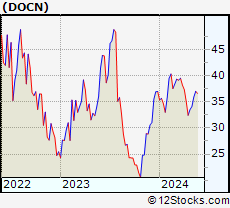 | DOCN DigitalOcean Holdings, Inc. |
| Sector: Technology | |
| SubSector: Software - Infrastructure | |
| MarketCap: 3620 Millions | |
| Recent Price: 37.05 Smart Investing & Trading Score: 42 | |
| Day Percent Change: 0.68% Day Change: 0.25 | |
| Week Change: 2.38% Year-to-date Change: 0.2% | |
| DOCN Links: Profile News Message Board | |
| Charts:- Daily , Weekly | |
| Add DOCN to Watchlist: View: Get Complete DOCN Trend Analysis ➞ | |
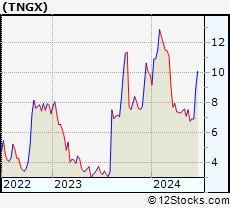 | TNGX Tango Therapeutics, Inc. |
| Sector: Health Care | |
| SubSector: Biotechnology | |
| MarketCap: 302 Millions | |
| Recent Price: 6.92 Smart Investing & Trading Score: 42 | |
| Day Percent Change: 3.90% Day Change: 0.26 | |
| Week Change: 2.37% Year-to-date Change: -30.1% | |
| TNGX Links: Profile News Message Board | |
| Charts:- Daily , Weekly | |
| Add TNGX to Watchlist: View: Get Complete TNGX Trend Analysis ➞ | |
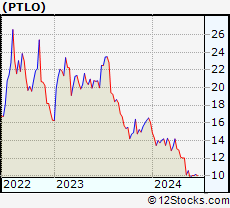 | PTLO Portillos Inc. |
| Sector: Services & Goods | |
| SubSector: Restaurants | |
| MarketCap: 1590 Millions | |
| Recent Price: 10.02 Smart Investing & Trading Score: 17 | |
| Day Percent Change: 0.30% Day Change: 0.03 | |
| Week Change: 2.35% Year-to-date Change: -37.6% | |
| PTLO Links: Profile News Message Board | |
| Charts:- Daily , Weekly | |
| Add PTLO to Watchlist: View: Get Complete PTLO Trend Analysis ➞ | |
| Too many stocks? View smallcap stocks filtered by marketcap & sector |
| Marketcap: All SmallCap Stocks (default-no microcap), Large, Mid-Range, Small & MicroCap |
| Sector: Tech, Finance, Energy, Staples, Retail, Industrial, Materials, Utilities & Medical |
|
Best Stocks Today 12Stocks.com |
© 2024 12Stocks.com Terms & Conditions Privacy Contact Us
All Information Provided Only For Education And Not To Be Used For Investing or Trading. See Terms & Conditions


One More Thing ... Get Best Stocks Delivered Daily!
Never Ever Miss A Move With Our Top Ten Stocks Lists
Find Best Stocks In Any Market - Bull or Bear Market
Take A Peek At Our Top Ten Stocks Lists: Daily, Weekly, Year-to-Date & Top Trends
Find Best Stocks In Any Market - Bull or Bear Market
Take A Peek At Our Top Ten Stocks Lists: Daily, Weekly, Year-to-Date & Top Trends
Smallcap Stocks With Best Up Trends [0-bearish to 100-bullish]: Ambarella [100], TPI Composites[100], Hallador Energy[100], Aaron s[100], Sportsman s[100], Heron [100], Federal Signal[100], Newpark Resources[100], Infinera [100], CONSOL Energy[100], Clean Energy[100]
Best Smallcap Stocks Year-to-Date:
CareMax [504.12%], Janux [397.91%], Viking [234.74%], Summit [232.76%], Novavax [213.13%], Longboard [208.84%], Avidity Biosciences[197.12%], Stoke [177.95%], Super Micro[175.98%], Sweetgreen [172.12%], NuScale Power[170.7%] Best Smallcap Stocks This Week:
Summit [156.95%], Insmed [150.23%], Forward Air[36.25%], Ikena Oncology[35.11%], Orchestra BioMed[32%], Credo [30.55%], Arcturus [27.58%], Semler Scientific[25.94%], Hallador Energy[25.72%], Foot Locker[25.65%], CommScope Holding[24.14%] Best Smallcap Stocks Daily:
Ambarella [20.60%], Eyenovia [13.48%], Accuray [12.74%], Slair Broadcast[12.08%], TPI Composites[12.07%], Akoustis [12.04%], Emergent BioSolutions[11.98%], Hallador Energy[11.29%], Aaron s[9.99%], Cogint [9.88%], Trinseo S.A[9.43%]