
 Login Sign Up


| |||||
 |  | ||||

| 12Stocks.com Market Intelligence |
Best MidCap Stocks
|
| In a hurry? Mid Cap Stocks Lists: Performance Trends Table, Stock Charts
Sort midcap stocks: Daily, Weekly, Year-to-Date, Market Cap & Trends. Filter midcap stocks list by sector: Show all, Tech, Finance, Energy, Staples, Retail, Industrial, Materials, Utilities and HealthCare Filter midcap stocks list by size:All MidCap Large Mid-Range Small |
| 12Stocks.com Mid Cap Stocks Performances & Trends Daily | |||||||||
|
|  The overall Smart Investing & Trading Score is 76 (0-bearish to 100-bullish) which puts Mid Cap index in short term neutral to bullish trend. The Smart Investing & Trading Score from previous trading session is 100 and a deterioration of trend continues.
| ||||||||
Here are the Smart Investing & Trading Scores of the most requested mid cap stocks at 12Stocks.com (click stock name for detailed review):
|


| 12Stocks.com: Top Performing Mid Cap Index Stocks | ||||||||||||||||||||||||||||||||||||||||||||||||
 The top performing Mid Cap Index stocks year to date are
Now, more recently, over last week, the top performing Mid Cap Index stocks on the move are


|
||||||||||||||||||||||||||||||||||||||||||||||||
| 12Stocks.com: Investing in Midcap Index with Stocks | |
|
The following table helps investors and traders sort through current performance and trends (as measured by Smart Investing & Trading Score) of various
stocks in the Midcap Index. Quick View: Move mouse or cursor over stock symbol (ticker) to view short-term technical chart and over stock name to view long term chart. Click on  to add stock symbol to your watchlist and to add stock symbol to your watchlist and  to view watchlist. Click on any ticker or stock name for detailed market intelligence report for that stock. to view watchlist. Click on any ticker or stock name for detailed market intelligence report for that stock. |
12Stocks.com Performance of Stocks in Midcap Index
| Ticker | Stock Name | Watchlist | Category | Recent Price | Smart Investing & Trading Score | Change % | Weekly Change% |
| CPRI | Capri |   | Consumer Staples | 35.95 | 40 | -0.55% | -0.48% |
| INGR | Ingredion | | Consumer Staples | 119.63 | 90 | 0.63% | -0.49% |
| GMED | Globus Medical | | Health Care | 64.40 | 83 | 0.70% | -0.49% |
| EME | EMCOR | | Industrials | 378.37 | 73 | 0.74% | -0.50% |
| AIZ | Assurant | | Financials | 175.60 | 32 | 0.07% | -0.51% |
| CIEN | Ciena | | Technology | 48.85 | 40 | -0.71% | -0.51% |
| ULTA | Ulta Beauty | | Services & Goods | 399.56 | 30 | -0.37% | -0.51% |
| WRB | W. R. | | Financials | 79.31 | 50 | 0.92% | -0.54% |
| ATR | Aptar | | Consumer Staples | 147.67 | 66 | 0.09% | -0.55% |
| COLM | Columbia Sportswear | | Consumer Staples | 83.61 | 68 | -0.48% | -0.55% |
| POST | Post | | Consumer Staples | 106.22 | 78 | -0.15% | -0.55% |
| VVV | Valvoline | | Energy | 41.77 | 8 | -1.11% | -0.55% |
| CRI | Carter s | | Consumer Staples | 68.66 | 17 | -1.61% | -0.56% |
| UGI | UGI | | Utilities | 24.77 | 68 | -0.96% | -0.56% |
| FITB | Fifth Third | | Financials | 38.56 | 76 | -0.10% | -0.57% |
| RSG | Republic Services | | Industrials | 188.16 | 51 | 0.25% | -0.57% |
| ACI | Albertsons | | Consumer Staples | 20.62 | 68 | -1.34% | -0.58% |
| JAZZ | Jazz | | Health Care | 108.99 | 18 | -1.36% | -0.58% |
| ED | Consolidated Edison | | Utilities | 97.10 | 76 | 0.20% | -0.61% |
| CNHI | CNH Industrial | | Industrials | 11.45 | 32 | -0.61% | -0.61% |
| CASY | Casey s | | Services & Goods | 335.48 | 76 | 0.46% | -0.63% |
| EMN | Eastman Chemical | | Materials | 100.38 | 66 | 0.31% | -0.64% |
| AAP | Advance Auto | | Services & Goods | 74.55 | 43 | 0.81% | -0.64% |
| GGG | Graco | | Industrials | 83.02 | 37 | -0.47% | -0.65% |
| PPG | PPG Industries | | Materials | 134.44 | 40 | -0.25% | -0.66% |
| For chart view version of above stock list: Chart View ➞ 0 - 25 , 25 - 50 , 50 - 75 , 75 - 100 , 100 - 125 , 125 - 150 , 150 - 175 , 175 - 200 , 200 - 225 , 225 - 250 , 250 - 275 , 275 - 300 , 300 - 325 , 325 - 350 , 350 - 375 , 375 - 400 , 400 - 425 , 425 - 450 , 450 - 475 , 475 - 500 , 500 - 525 , 525 - 550 , 550 - 575 , 575 - 600 , 600 - 625 , 625 - 650 , 650 - 675 , 675 - 700 , 700 - 725 , 725 - 750 , 750 - 775 | ||
 | Click To Change The Sort Order: By Market Cap or Company Size Performance: Year-to-date, Week and Day |  |
|
Get the most comprehensive stock market coverage daily at 12Stocks.com ➞ Best Stocks Today ➞ Best Stocks Weekly ➞ Best Stocks Year-to-Date ➞ Best Stocks Trends ➞  Best Stocks Today 12Stocks.com Best Nasdaq Stocks ➞ Best S&P 500 Stocks ➞ Best Tech Stocks ➞ Best Biotech Stocks ➞ |
| Detailed Overview of Midcap Stocks |
| Midcap Technical Overview, Leaders & Laggards, Top Midcap ETF Funds & Detailed Midcap Stocks List, Charts, Trends & More |
| Midcap: Technical Analysis, Trends & YTD Performance | |
| MidCap segment as represented by
MDY, an exchange-traded fund [ETF], holds basket of about four hundred midcap stocks from across all major sectors of the US stock market. The midcap index (contains stocks like Green Mountain Coffee Roasters and Tractor Supply Company) is up by 8.73% and is currently underperforming the overall market by -1.84% year-to-date. Below is a quick view of technical charts and trends: | |
 MDY Weekly Chart |
|
| Long Term Trend: Very Good | |
| Medium Term Trend: Very Good | |
 MDY Daily Chart |
|
| Short Term Trend: Not Good | |
| Overall Trend Score: 76 | |
| YTD Performance: 8.73% | |
| **Trend Scores & Views Are Only For Educational Purposes And Not For Investing | |
| 12Stocks.com: Investing in Midcap Index using Exchange Traded Funds | |
|
The following table shows list of key exchange traded funds (ETF) that
help investors track Midcap index. The following list also includes leveraged ETF funds that track twice or thrice the daily returns of Midcap indices. Short or inverse ETF funds move in the opposite direction to the index they track and are useful during market pullbacks or during bear markets. Quick View: Move mouse or cursor over ETF symbol (ticker) to view short-term technical chart and over ETF name to view long term chart. Click on ticker or stock name for detailed view. Click on to add stock symbol to your watchlist and to view watchlist. |
12Stocks.com List of ETFs that track Midcap Index
| Ticker | ETF Name | Watchlist | Recent Price | Smart Investing & Trading Score | Change % | Week % | Year-to-date % |
| IJH | iShares Core S&P Mid-Cap | | 60.31 | 68 | -0.46 | 0.84 | 8.8% |
| MDY | SPDR S&P MidCap 400 ETF | | 551.69 | 76 | 0.11 | 0.84 | 8.73% |
| IWR | iShares Russell Mid-Cap | | 83.29 | 76 | -0.28 | 1.07 | 7.15% |
| IWP | iShares Russell Mid-Cap Growth | | 112.01 | 70 | -0.29 | 1.53 | 7.23% |
| IWS | iShares Russell Mid-Cap Value | | 124.51 | 76 | -0.34 | 0.92 | 7.07% |
| IJK | iShares S&P Mid-Cap 400 Growth | | 90.28 | 71 | -0.05 | 0.39 | 13.96% |
| IJJ | iShares S&P Mid-Cap 400 Value | | 117.71 | 76 | -0.16 | 1.26 | 3.22% |
| MVV | ProShares Ultra MidCap400 | | 66.42 | 76 | 0.02 | 1.65 | 14.74% |
| XMLV | PowerShares S&P MidCap Low Volatil ETF | | 56.93 | 76 | -0.02 | 0.42 | 7.05% |
| UMDD | ProShares UltraPro MidCap400 | | 26.83 | 76 | -0.58 | 1.98 | 20.21% |
| SMDD | ProShares UltraPro Short MidCap400 | | 10.48 | 25 | 0.73 | -1.92 | -22.18% |
| MYY | ProShares Short MidCap400 | | 20.00 | 25 | 0.60 | -0.61 | -6.78% |
| MZZ | ProShares UltraShort MidCap400 | | 10.81 | 27 | 0.49 | -1.25 | -13.98% |
| 12Stocks.com: Charts, Trends, Fundamental Data and Performances of MidCap Stocks | |
|
We now take in-depth look at all MidCap stocks including charts, multi-period performances and overall trends (as measured by Smart Investing & Trading Score). One can sort MidCap stocks (click link to choose) by Daily, Weekly and by Year-to-Date performances. Also, one can sort by size of the company or by market capitalization. |
| Select Your Default Chart Type: | |||||
| |||||
| Click on stock symbol or name for detailed view. Click on to add stock symbol to your watchlist and to view watchlist. Quick View: Move mouse or cursor over "Daily" to quickly view daily technical stock chart and over "Weekly" to view weekly technical stock chart. | |||||

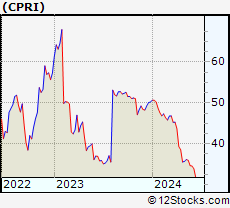 | CPRI Capri Holdings Limited |
| Sector: Consumer Staples | |
| SubSector: Textile - Apparel Clothing | |
| MarketCap: 1935.65 Millions | |
| Recent Price: 35.95 Smart Investing & Trading Score: 40 | |
| Day Percent Change: -0.55% Day Change: -0.20 | |
| Week Change: -0.48% Year-to-date Change: -28.4% | |
| CPRI Links: Profile News Message Board | |
| Charts:- Daily , Weekly | |
| Add CPRI to Watchlist: View: Get Complete CPRI Trend Analysis ➞ | |
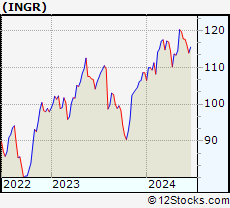 | INGR Ingredion Incorporated |
| Sector: Consumer Staples | |
| SubSector: Processed & Packaged Goods | |
| MarketCap: 5064.18 Millions | |
| Recent Price: 119.63 Smart Investing & Trading Score: 90 | |
| Day Percent Change: 0.63% Day Change: 0.75 | |
| Week Change: -0.49% Year-to-date Change: 10.2% | |
| INGR Links: Profile News Message Board | |
| Charts:- Daily , Weekly | |
| Add INGR to Watchlist: View: Get Complete INGR Trend Analysis ➞ | |
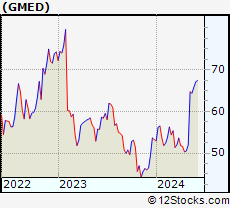 | GMED Globus Medical, Inc. |
| Sector: Health Care | |
| SubSector: Medical Appliances & Equipment | |
| MarketCap: 3965.5 Millions | |
| Recent Price: 64.40 Smart Investing & Trading Score: 83 | |
| Day Percent Change: 0.70% Day Change: 0.45 | |
| Week Change: -0.49% Year-to-date Change: 20.9% | |
| GMED Links: Profile News Message Board | |
| Charts:- Daily , Weekly | |
| Add GMED to Watchlist: View: Get Complete GMED Trend Analysis ➞ | |
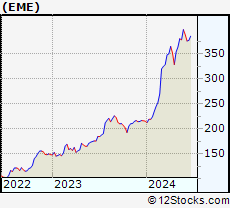 | EME EMCOR Group, Inc. |
| Sector: Industrials | |
| SubSector: General Contractors | |
| MarketCap: 3417.83 Millions | |
| Recent Price: 378.37 Smart Investing & Trading Score: 73 | |
| Day Percent Change: 0.74% Day Change: 2.78 | |
| Week Change: -0.5% Year-to-date Change: 75.6% | |
| EME Links: Profile News Message Board | |
| Charts:- Daily , Weekly | |
| Add EME to Watchlist: View: Get Complete EME Trend Analysis ➞ | |
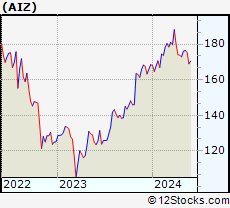 | AIZ Assurant, Inc. |
| Sector: Financials | |
| SubSector: Accident & Health Insurance | |
| MarketCap: 6110.3 Millions | |
| Recent Price: 175.60 Smart Investing & Trading Score: 32 | |
| Day Percent Change: 0.07% Day Change: 0.12 | |
| Week Change: -0.51% Year-to-date Change: 4.2% | |
| AIZ Links: Profile News Message Board | |
| Charts:- Daily , Weekly | |
| Add AIZ to Watchlist: View: Get Complete AIZ Trend Analysis ➞ | |
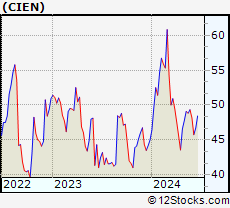 | CIEN Ciena Corporation |
| Sector: Technology | |
| SubSector: Communication Equipment | |
| MarketCap: 6206.99 Millions | |
| Recent Price: 48.85 Smart Investing & Trading Score: 40 | |
| Day Percent Change: -0.71% Day Change: -0.35 | |
| Week Change: -0.51% Year-to-date Change: 8.5% | |
| CIEN Links: Profile News Message Board | |
| Charts:- Daily , Weekly | |
| Add CIEN to Watchlist: View: Get Complete CIEN Trend Analysis ➞ | |
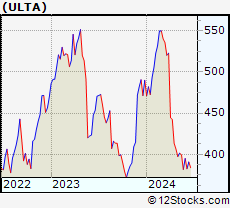 | ULTA Ulta Beauty, Inc. |
| Sector: Services & Goods | |
| SubSector: Specialty Retail, Other | |
| MarketCap: 9429.94 Millions | |
| Recent Price: 399.56 Smart Investing & Trading Score: 30 | |
| Day Percent Change: -0.37% Day Change: -1.48 | |
| Week Change: -0.51% Year-to-date Change: -18.5% | |
| ULTA Links: Profile News Message Board | |
| Charts:- Daily , Weekly | |
| Add ULTA to Watchlist: View: Get Complete ULTA Trend Analysis ➞ | |
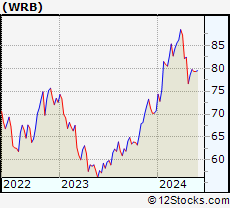 | WRB W. R. Berkley Corporation |
| Sector: Financials | |
| SubSector: Property & Casualty Insurance | |
| MarketCap: 9863.82 Millions | |
| Recent Price: 79.31 Smart Investing & Trading Score: 50 | |
| Day Percent Change: 0.92% Day Change: 0.72 | |
| Week Change: -0.54% Year-to-date Change: 12.2% | |
| WRB Links: Profile News Message Board | |
| Charts:- Daily , Weekly | |
| Add WRB to Watchlist: View: Get Complete WRB Trend Analysis ➞ | |
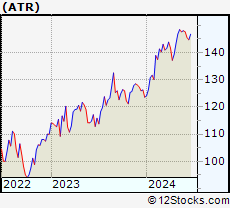 | ATR AptarGroup, Inc. |
| Sector: Consumer Staples | |
| SubSector: Packaging & Containers | |
| MarketCap: 6219.43 Millions | |
| Recent Price: 147.67 Smart Investing & Trading Score: 66 | |
| Day Percent Change: 0.09% Day Change: 0.13 | |
| Week Change: -0.55% Year-to-date Change: 19.5% | |
| ATR Links: Profile News Message Board | |
| Charts:- Daily , Weekly | |
| Add ATR to Watchlist: View: Get Complete ATR Trend Analysis ➞ | |
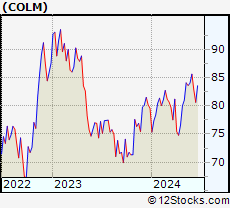 | COLM Columbia Sportswear Company |
| Sector: Consumer Staples | |
| SubSector: Textile - Apparel Clothing | |
| MarketCap: 4371.75 Millions | |
| Recent Price: 83.61 Smart Investing & Trading Score: 68 | |
| Day Percent Change: -0.48% Day Change: -0.40 | |
| Week Change: -0.55% Year-to-date Change: 5.1% | |
| COLM Links: Profile News Message Board | |
| Charts:- Daily , Weekly | |
| Add COLM to Watchlist: View: Get Complete COLM Trend Analysis ➞ | |
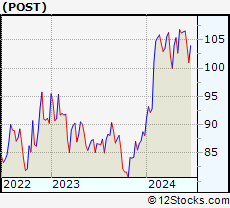 | POST Post Holdings, Inc. |
| Sector: Consumer Staples | |
| SubSector: Food - Major Diversified | |
| MarketCap: 5576.53 Millions | |
| Recent Price: 106.22 Smart Investing & Trading Score: 78 | |
| Day Percent Change: -0.15% Day Change: -0.16 | |
| Week Change: -0.55% Year-to-date Change: 20.6% | |
| POST Links: Profile News Message Board | |
| Charts:- Daily , Weekly | |
| Add POST to Watchlist: View: Get Complete POST Trend Analysis ➞ | |
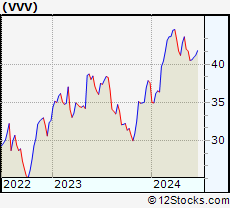 | VVV Valvoline Inc. |
| Sector: Energy | |
| SubSector: Oil & Gas Refining & Marketing | |
| MarketCap: 2225.94 Millions | |
| Recent Price: 41.77 Smart Investing & Trading Score: 8 | |
| Day Percent Change: -1.11% Day Change: -0.47 | |
| Week Change: -0.55% Year-to-date Change: 11.2% | |
| VVV Links: Profile News Message Board | |
| Charts:- Daily , Weekly | |
| Add VVV to Watchlist: View: Get Complete VVV Trend Analysis ➞ | |
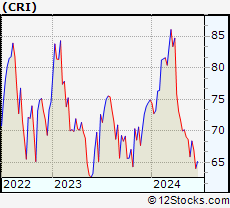 | CRI Carter s, Inc. |
| Sector: Consumer Staples | |
| SubSector: Textile - Apparel Clothing | |
| MarketCap: 3173.55 Millions | |
| Recent Price: 68.66 Smart Investing & Trading Score: 17 | |
| Day Percent Change: -1.61% Day Change: -1.12 | |
| Week Change: -0.56% Year-to-date Change: -8.3% | |
| CRI Links: Profile News Message Board | |
| Charts:- Daily , Weekly | |
| Add CRI to Watchlist: View: Get Complete CRI Trend Analysis ➞ | |
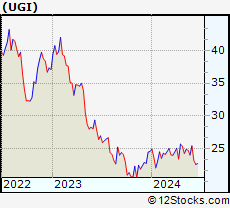 | UGI UGI Corporation |
| Sector: Utilities | |
| SubSector: Diversified Utilities | |
| MarketCap: 5872.8 Millions | |
| Recent Price: 24.77 Smart Investing & Trading Score: 68 | |
| Day Percent Change: -0.96% Day Change: -0.24 | |
| Week Change: -0.56% Year-to-date Change: 0.7% | |
| UGI Links: Profile News Message Board | |
| Charts:- Daily , Weekly | |
| Add UGI to Watchlist: View: Get Complete UGI Trend Analysis ➞ | |
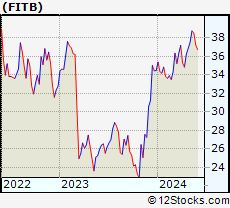 | FITB Fifth Third Bancorp |
| Sector: Financials | |
| SubSector: Regional - Midwest Banks | |
| MarketCap: 10197 Millions | |
| Recent Price: 38.56 Smart Investing & Trading Score: 76 | |
| Day Percent Change: -0.10% Day Change: -0.04 | |
| Week Change: -0.57% Year-to-date Change: 11.8% | |
| FITB Links: Profile News Message Board | |
| Charts:- Daily , Weekly | |
| Add FITB to Watchlist: View: Get Complete FITB Trend Analysis ➞ | |
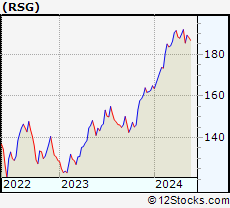 | RSG Republic Services, Inc. |
| Sector: Industrials | |
| SubSector: Waste Management | |
| MarketCap: 26178.6 Millions | |
| Recent Price: 188.16 Smart Investing & Trading Score: 51 | |
| Day Percent Change: 0.25% Day Change: 0.46 | |
| Week Change: -0.57% Year-to-date Change: 14.1% | |
| RSG Links: Profile News Message Board | |
| Charts:- Daily , Weekly | |
| Add RSG to Watchlist: View: Get Complete RSG Trend Analysis ➞ | |
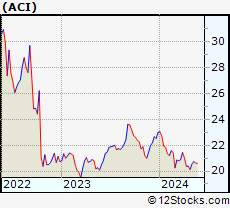 | ACI Albertsons Companies, Inc. |
| Sector: Consumer Staples | |
| SubSector: Grocery Stores | |
| MarketCap: 71347 Millions | |
| Recent Price: 20.62 Smart Investing & Trading Score: 68 | |
| Day Percent Change: -1.34% Day Change: -0.28 | |
| Week Change: -0.58% Year-to-date Change: -10.4% | |
| ACI Links: Profile News Message Board | |
| Charts:- Daily , Weekly | |
| Add ACI to Watchlist: View: Get Complete ACI Trend Analysis ➞ | |
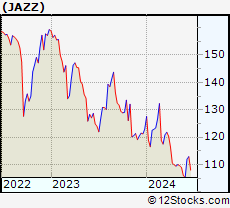 | JAZZ Jazz Pharmaceuticals plc |
| Sector: Health Care | |
| SubSector: Biotechnology | |
| MarketCap: 5576.05 Millions | |
| Recent Price: 108.99 Smart Investing & Trading Score: 18 | |
| Day Percent Change: -1.36% Day Change: -1.50 | |
| Week Change: -0.58% Year-to-date Change: -11.4% | |
| JAZZ Links: Profile News Message Board | |
| Charts:- Daily , Weekly | |
| Add JAZZ to Watchlist: View: Get Complete JAZZ Trend Analysis ➞ | |
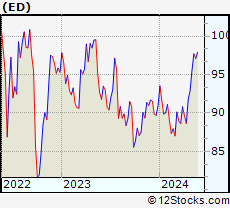 | ED Consolidated Edison, Inc. |
| Sector: Utilities | |
| SubSector: Electric Utilities | |
| MarketCap: 25012.3 Millions | |
| Recent Price: 97.10 Smart Investing & Trading Score: 76 | |
| Day Percent Change: 0.20% Day Change: 0.19 | |
| Week Change: -0.61% Year-to-date Change: 6.7% | |
| ED Links: Profile News Message Board | |
| Charts:- Daily , Weekly | |
| Add ED to Watchlist: View: Get Complete ED Trend Analysis ➞ | |
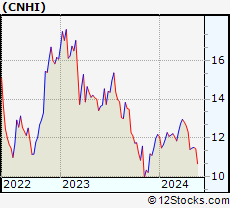 | CNHI CNH Industrial N.V. |
| Sector: Industrials | |
| SubSector: Farm & Construction Machinery | |
| MarketCap: 9366.57 Millions | |
| Recent Price: 11.45 Smart Investing & Trading Score: 32 | |
| Day Percent Change: -0.61% Day Change: -0.07 | |
| Week Change: -0.61% Year-to-date Change: -6.0% | |
| CNHI Links: Profile News Message Board | |
| Charts:- Daily , Weekly | |
| Add CNHI to Watchlist: View: Get Complete CNHI Trend Analysis ➞ | |
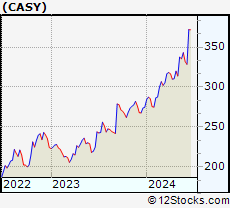 | CASY Casey s General Stores, Inc. |
| Sector: Services & Goods | |
| SubSector: Grocery Stores | |
| MarketCap: 5787.95 Millions | |
| Recent Price: 335.48 Smart Investing & Trading Score: 76 | |
| Day Percent Change: 0.46% Day Change: 1.55 | |
| Week Change: -0.63% Year-to-date Change: 22.1% | |
| CASY Links: Profile News Message Board | |
| Charts:- Daily , Weekly | |
| Add CASY to Watchlist: View: Get Complete CASY Trend Analysis ➞ | |
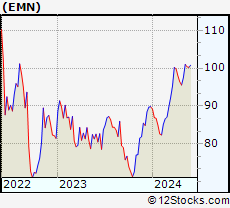 | EMN Eastman Chemical Company |
| Sector: Materials | |
| SubSector: Chemicals - Major Diversified | |
| MarketCap: 6217.06 Millions | |
| Recent Price: 100.38 Smart Investing & Trading Score: 66 | |
| Day Percent Change: 0.31% Day Change: 0.31 | |
| Week Change: -0.64% Year-to-date Change: 11.8% | |
| EMN Links: Profile News Message Board | |
| Charts:- Daily , Weekly | |
| Add EMN to Watchlist: View: Get Complete EMN Trend Analysis ➞ | |
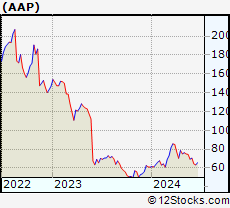 | AAP Advance Auto Parts, Inc. |
| Sector: Services & Goods | |
| SubSector: Auto Parts Stores | |
| MarketCap: 5977.7 Millions | |
| Recent Price: 74.55 Smart Investing & Trading Score: 43 | |
| Day Percent Change: 0.81% Day Change: 0.60 | |
| Week Change: -0.64% Year-to-date Change: 22.2% | |
| AAP Links: Profile News Message Board | |
| Charts:- Daily , Weekly | |
| Add AAP to Watchlist: View: Get Complete AAP Trend Analysis ➞ | |
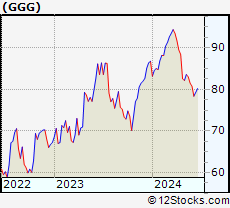 | GGG Graco Inc. |
| Sector: Industrials | |
| SubSector: Diversified Machinery | |
| MarketCap: 7739.76 Millions | |
| Recent Price: 83.02 Smart Investing & Trading Score: 37 | |
| Day Percent Change: -0.47% Day Change: -0.39 | |
| Week Change: -0.65% Year-to-date Change: -4.3% | |
| GGG Links: Profile News Message Board | |
| Charts:- Daily , Weekly | |
| Add GGG to Watchlist: View: Get Complete GGG Trend Analysis ➞ | |
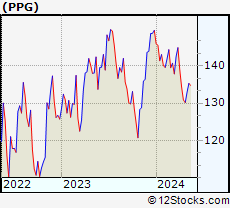 | PPG PPG Industries, Inc. |
| Sector: Materials | |
| SubSector: Specialty Chemicals | |
| MarketCap: 20285.5 Millions | |
| Recent Price: 134.44 Smart Investing & Trading Score: 40 | |
| Day Percent Change: -0.25% Day Change: -0.34 | |
| Week Change: -0.66% Year-to-date Change: -10.1% | |
| PPG Links: Profile News Message Board | |
| Charts:- Daily , Weekly | |
| Add PPG to Watchlist: View: Get Complete PPG Trend Analysis ➞ | |
| For tabular summary view of above stock list: Summary View ➞ 0 - 25 , 25 - 50 , 50 - 75 , 75 - 100 , 100 - 125 , 125 - 150 , 150 - 175 , 175 - 200 , 200 - 225 , 225 - 250 , 250 - 275 , 275 - 300 , 300 - 325 , 325 - 350 , 350 - 375 , 375 - 400 , 400 - 425 , 425 - 450 , 450 - 475 , 475 - 500 , 500 - 525 , 525 - 550 , 550 - 575 , 575 - 600 , 600 - 625 , 625 - 650 , 650 - 675 , 675 - 700 , 700 - 725 , 725 - 750 , 750 - 775 | ||
| Click To Change The Sort Order: By Market Cap or Company Size Performance: Year-to-date, Week and Day | |
| Select Chart Type: | ||
|
Best Stocks Today 12Stocks.com |
© 2024 12Stocks.com Terms & Conditions Privacy Contact Us
All Information Provided Only For Education And Not To Be Used For Investing or Trading. See Terms & Conditions


One More Thing ... Get Best Stocks Delivered Daily!
Never Ever Miss A Move With Our Top Ten Stocks Lists
Find Best Stocks In Any Market - Bull or Bear Market
Take A Peek At Our Top Ten Stocks Lists: Daily, Weekly, Year-to-Date & Top Trends
Find Best Stocks In Any Market - Bull or Bear Market
Take A Peek At Our Top Ten Stocks Lists: Daily, Weekly, Year-to-Date & Top Trends
Midcap Stocks With Best Up Trends [0-bearish to 100-bullish]: Robinhood Markets[100], SSR Mining[100], Littelfuse [100], Tractor Supply[100], DuPont de[100], Royal Gold[100], Alcoa [100], Range Resources[100], Arch Capital[100], Evercore [100], Prosperity Bancshares[100]
Best Midcap Stocks Year-to-Date:
Vistra Energy[144.24%], AppLovin [107.29%], Constellation Energy[81.97%], CAVA [77.74%], EMCOR [75.63%], ShockWave Medical[73.24%], Maravai LifeSciences[72.82%], Celsius [70.62%], Tenet [70%], Natera [69.96%], Pure Storage[65.87%] Best Midcap Stocks This Week:
AMC Entertainment[51.2%], Petco Health[50%], NovoCure [33.52%], GameStop [27.21%], Plug Power[26.95%], Robinhood Markets[23.78%], Doximity [19.94%], Ubiquiti [16.29%], Hawaiian Electric[15.12%], MP Materials[13.14%], Victorias Secret[13.12%] Best Midcap Stocks Daily:
Doximity [18.07%], Robinhood Markets[12.23%], Affirm [8.01%], SSR Mining[6.28%], Coinbase Global[4.23%], Littelfuse [4.13%], Rivian Automotive[3.65%], DoubleVerify [3.50%], Tractor Supply[3.42%], Iridium [3.42%], Ubiquiti [3.04%]