
 Login Sign Up


| |||||
 |  | ||||

| 12Stocks.com Market Intelligence |
Best MidCap Stocks
|
| In a hurry? Mid Cap Stocks Lists: Performance Trends Table, Stock Charts
Sort midcap stocks: Daily, Weekly, Year-to-Date, Market Cap & Trends. Filter midcap stocks list by sector: Show all, Tech, Finance, Energy, Staples, Retail, Industrial, Materials, Utilities and HealthCare Filter midcap stocks list by size:All MidCap Large Mid-Range Small |
| 12Stocks.com Mid Cap Stocks Performances & Trends Daily | |||||||||
|
|  The overall Smart Investing & Trading Score is 76 (0-bearish to 100-bullish) which puts Mid Cap index in short term neutral to bullish trend. The Smart Investing & Trading Score from previous trading session is 100 and a deterioration of trend continues.
| ||||||||
Here are the Smart Investing & Trading Scores of the most requested mid cap stocks at 12Stocks.com (click stock name for detailed review):
|


| 12Stocks.com: Top Performing Mid Cap Index Stocks | ||||||||||||||||||||||||||||||||||||||||||||||||
 The top performing Mid Cap Index stocks year to date are
Now, more recently, over last week, the top performing Mid Cap Index stocks on the move are


|
||||||||||||||||||||||||||||||||||||||||||||||||
| 12Stocks.com: Investing in Midcap Index with Stocks | |
|
The following table helps investors and traders sort through current performance and trends (as measured by Smart Investing & Trading Score) of various
stocks in the Midcap Index. Quick View: Move mouse or cursor over stock symbol (ticker) to view short-term technical chart and over stock name to view long term chart. Click on  to add stock symbol to your watchlist and to add stock symbol to your watchlist and  to view watchlist. Click on any ticker or stock name for detailed market intelligence report for that stock. to view watchlist. Click on any ticker or stock name for detailed market intelligence report for that stock. |
12Stocks.com Performance of Stocks in Midcap Index
| Ticker | Stock Name | Watchlist | Category | Recent Price | Smart Investing & Trading Score | Change % | Weekly Change% |
| AMC | AMC Entertainment |   | Services & Goods | 4.38 | 68 | -5.71% | 50.34% |
| WOOF | Petco Health | | Services & Goods | 2.48 | 69 | 1.02% | 49.70% |
| NVCR | NovoCure | | Health Care | 21.95 | 95 | -0.99% | 33.27% |
| PLUG | Plug Power | | Industrials | 3.22 | 42 | -6.12% | 25.78% |
| GME | GameStop | | Services & Goods | 21.13 | 68 | -23.64% | 21.02% |
| DOCS | Doximity | | Health Care | 27.95 | 74 | 17.73% | 19.60% |
| HOOD | Robinhood Markets | | Technology | 19.05 | 88 | 6.42% | 17.38% |
| HE | Hawaiian Electric | | Utilities | 11.73 | 74 | -0.64% | 17.37% |
| UI | Ubiquiti | | Technology | 144.90 | 95 | 2.00% | 15.11% |
| MP | MP Materials | | Materials | 18.30 | 93 | 1.22% | 13.45% |
| HTZ | Hertz Global | | Industrials | 5.54 | 47 | 0.45% | 13.39% |
| PODD | Insulet | | Health Care | 186.20 | 93 | 0.44% | 12.24% |
| MRCY | Mercury | | Technology | 31.33 | 100 | 0.32% | 11.93% |
| CELH | Celsius | | Consumer Staples | 92.68 | 73 | 0.12% | 11.92% |
| VSCO | Victorias Secret | | Services & Goods | 21.89 | 42 | 0.88% | 11.74% |
| AA | Alcoa | | Materials | 41.01 | 100 | 2.14% | 10.48% |
| GO | Grocery Outlet | | Services & Goods | 22.73 | 32 | 4.17% | 9.49% |
| ALGM | Allegro Micro | | Technology | 29.26 | 45 | -1.65% | 9.34% |
| VSAT | Viasat | | Technology | 18.75 | 74 | 1.52% | 9.08% |
| SSRM | SSR Mining | | Materials | 5.78 | 100 | 6.84% | 9.06% |
| CFLT | Confluent | | Technology | 32.03 | 69 | 1.59% | 8.87% |
| MRVI | Maravai LifeSciences | | Health Care | 11.33 | 95 | 2.07% | 8.32% |
| TTD | Trade Desk | | Technology | 94.50 | 95 | 1.40% | 8.29% |
| PSTG | Pure Storage | | Technology | 58.84 | 100 | -0.02% | 8.14% |
| ENPH | Enphase Energy | | Technology | 116.78 | 55 | -0.09% | 7.78% |
| For chart view version of above stock list: Chart View ➞ 0 - 25 , 25 - 50 , 50 - 75 , 75 - 100 , 100 - 125 , 125 - 150 , 150 - 175 , 175 - 200 , 200 - 225 , 225 - 250 , 250 - 275 , 275 - 300 , 300 - 325 , 325 - 350 , 350 - 375 , 375 - 400 , 400 - 425 , 425 - 450 , 450 - 475 , 475 - 500 , 500 - 525 , 525 - 550 , 550 - 575 , 575 - 600 , 600 - 625 , 625 - 650 , 650 - 675 , 675 - 700 , 700 - 725 , 725 - 750 , 750 - 775 | ||
 | Click To Change The Sort Order: By Market Cap or Company Size Performance: Year-to-date, Week and Day |  |
|
Get the most comprehensive stock market coverage daily at 12Stocks.com ➞ Best Stocks Today ➞ Best Stocks Weekly ➞ Best Stocks Year-to-Date ➞ Best Stocks Trends ➞  Best Stocks Today 12Stocks.com Best Nasdaq Stocks ➞ Best S&P 500 Stocks ➞ Best Tech Stocks ➞ Best Biotech Stocks ➞ |
| Detailed Overview of Midcap Stocks |
| Midcap Technical Overview, Leaders & Laggards, Top Midcap ETF Funds & Detailed Midcap Stocks List, Charts, Trends & More |
| Midcap: Technical Analysis, Trends & YTD Performance | |
| MidCap segment as represented by
MDY, an exchange-traded fund [ETF], holds basket of about four hundred midcap stocks from across all major sectors of the US stock market. The midcap index (contains stocks like Green Mountain Coffee Roasters and Tractor Supply Company) is up by 8.52% and is currently underperforming the overall market by -1.75% year-to-date. Below is a quick view of technical charts and trends: | |
 MDY Weekly Chart |
|
| Long Term Trend: Very Good | |
| Medium Term Trend: Very Good | |
 MDY Daily Chart |
|
| Short Term Trend: Not Good | |
| Overall Trend Score: 76 | |
| YTD Performance: 8.52% | |
| **Trend Scores & Views Are Only For Educational Purposes And Not For Investing | |
| 12Stocks.com: Investing in Midcap Index using Exchange Traded Funds | |
|
The following table shows list of key exchange traded funds (ETF) that
help investors track Midcap index. The following list also includes leveraged ETF funds that track twice or thrice the daily returns of Midcap indices. Short or inverse ETF funds move in the opposite direction to the index they track and are useful during market pullbacks or during bear markets. Quick View: Move mouse or cursor over ETF symbol (ticker) to view short-term technical chart and over ETF name to view long term chart. Click on ticker or stock name for detailed view. Click on to add stock symbol to your watchlist and to view watchlist. |
12Stocks.com List of ETFs that track Midcap Index
| Ticker | ETF Name | Watchlist | Recent Price | Smart Investing & Trading Score | Change % | Week % | Year-to-date % |
| IJH | iShares Core S&P Mid-Cap | | 60.26 | 76 | -0.54 | 0.75 | 8.71% |
| IWR | iShares Russell Mid-Cap | | 83.11 | 76 | -0.50 | 0.84 | 6.91% |
| MDY | SPDR S&P MidCap 400 ETF | | 550.60 | 76 | -0.09 | 0.64 | 8.52% |
| IWP | iShares Russell Mid-Cap Growth | | 111.68 | 70 | -0.59 | 1.23 | 6.91% |
| IJK | iShares S&P Mid-Cap 400 Growth | | 90.11 | 71 | -0.24 | 0.2 | 13.75% |
| IJJ | iShares S&P Mid-Cap 400 Value | | 117.52 | 76 | -0.32 | 1.09 | 3.05% |
| MVV | ProShares Ultra MidCap400 | | 66.04 | 76 | -0.56 | 1.06 | 14.08% |
| IWS | iShares Russell Mid-Cap Value | | 124.38 | 76 | -0.45 | 0.81 | 6.96% |
| XMLV | PowerShares S&P MidCap Low Volatil ETF | | 56.84 | 76 | -0.17 | 0.27 | 6.89% |
| UMDD | ProShares UltraPro MidCap400 | | 26.70 | 68 | -1.06 | 1.48 | 19.62% |
| SMDD | ProShares UltraPro Short MidCap400 | | 10.55 | 32 | 1.40 | -1.27 | -21.66% |
| MZZ | ProShares UltraShort MidCap400 | | 10.84 | 27 | 0.74 | -1 | -13.77% |
| MYY | ProShares Short MidCap400 | | 19.99 | 25 | 0.56 | -0.65 | -6.82% |
| 12Stocks.com: Charts, Trends, Fundamental Data and Performances of MidCap Stocks | |
|
We now take in-depth look at all MidCap stocks including charts, multi-period performances and overall trends (as measured by Smart Investing & Trading Score). One can sort MidCap stocks (click link to choose) by Daily, Weekly and by Year-to-Date performances. Also, one can sort by size of the company or by market capitalization. |
| Select Your Default Chart Type: | |||||
| |||||
| Click on stock symbol or name for detailed view. Click on to add stock symbol to your watchlist and to view watchlist. Quick View: Move mouse or cursor over "Daily" to quickly view daily technical stock chart and over "Weekly" to view weekly technical stock chart. | |||||

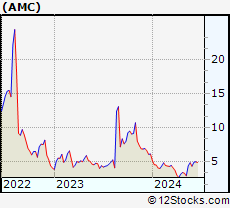 | AMC AMC Entertainment Holdings, Inc. |
| Sector: Services & Goods | |
| SubSector: Movie Production, Theaters | |
| MarketCap: 415.929 Millions | |
| Recent Price: 4.38 Smart Investing & Trading Score: 68 | |
| Day Percent Change: -5.71% Day Change: -0.26 | |
| Week Change: 50.34% Year-to-date Change: -28.5% | |
| AMC Links: Profile News Message Board | |
| Charts:- Daily , Weekly | |
| Add AMC to Watchlist: View: Get Complete AMC Trend Analysis ➞ | |
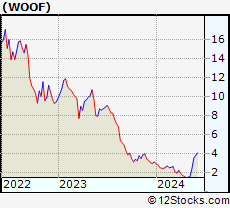 | WOOF Petco Health and Wellness Company, Inc. |
| Sector: Services & Goods | |
| SubSector: Specialty Retail | |
| MarketCap: 2030 Millions | |
| Recent Price: 2.48 Smart Investing & Trading Score: 69 | |
| Day Percent Change: 1.02% Day Change: 0.02 | |
| Week Change: 49.7% Year-to-date Change: -21.4% | |
| WOOF Links: Profile News Message Board | |
| Charts:- Daily , Weekly | |
| Add WOOF to Watchlist: View: Get Complete WOOF Trend Analysis ➞ | |
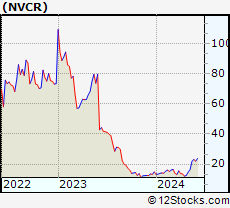 | NVCR NovoCure Limited |
| Sector: Health Care | |
| SubSector: Medical Appliances & Equipment | |
| MarketCap: 5939.5 Millions | |
| Recent Price: 21.95 Smart Investing & Trading Score: 95 | |
| Day Percent Change: -0.99% Day Change: -0.22 | |
| Week Change: 33.27% Year-to-date Change: 47.0% | |
| NVCR Links: Profile News Message Board | |
| Charts:- Daily , Weekly | |
| Add NVCR to Watchlist: View: Get Complete NVCR Trend Analysis ➞ | |
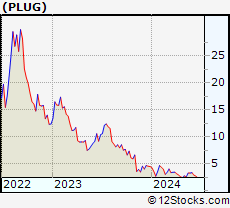 | PLUG Plug Power Inc. |
| Sector: Industrials | |
| SubSector: Industrial Electrical Equipment | |
| MarketCap: 1233.09 Millions | |
| Recent Price: 3.22 Smart Investing & Trading Score: 42 | |
| Day Percent Change: -6.12% Day Change: -0.21 | |
| Week Change: 25.78% Year-to-date Change: -28.4% | |
| PLUG Links: Profile News Message Board | |
| Charts:- Daily , Weekly | |
| Add PLUG to Watchlist: View: Get Complete PLUG Trend Analysis ➞ | |
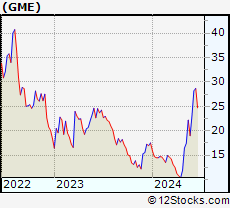 | GME GameStop Corp. |
| Sector: Services & Goods | |
| SubSector: Electronics Stores | |
| MarketCap: 257.8 Millions | |
| Recent Price: 21.13 Smart Investing & Trading Score: 68 | |
| Day Percent Change: -23.64% Day Change: -6.54 | |
| Week Change: 21.02% Year-to-date Change: 20.5% | |
| GME Links: Profile News Message Board | |
| Charts:- Daily , Weekly | |
| Add GME to Watchlist: View: Get Complete GME Trend Analysis ➞ | |
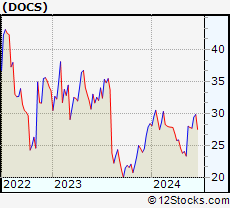 | DOCS Doximity, Inc. |
| Sector: Health Care | |
| SubSector: Health Information Services | |
| MarketCap: 6540 Millions | |
| Recent Price: 27.95 Smart Investing & Trading Score: 74 | |
| Day Percent Change: 17.73% Day Change: 4.21 | |
| Week Change: 19.6% Year-to-date Change: -1.7% | |
| DOCS Links: Profile News Message Board | |
| Charts:- Daily , Weekly | |
| Add DOCS to Watchlist: View: Get Complete DOCS Trend Analysis ➞ | |
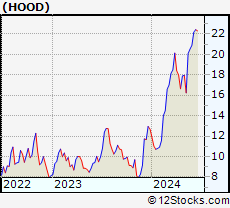 | HOOD Robinhood Markets, Inc. |
| Sector: Technology | |
| SubSector: Software - Infrastructure | |
| MarketCap: 9200 Millions | |
| Recent Price: 19.05 Smart Investing & Trading Score: 88 | |
| Day Percent Change: 6.42% Day Change: 1.15 | |
| Week Change: 17.38% Year-to-date Change: 50.2% | |
| HOOD Links: Profile News Message Board | |
| Charts:- Daily , Weekly | |
| Add HOOD to Watchlist: View: Get Complete HOOD Trend Analysis ➞ | |
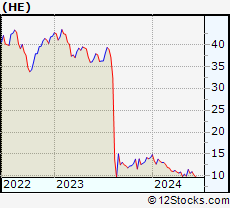 | HE Hawaiian Electric Industries, Inc. |
| Sector: Utilities | |
| SubSector: Electric Utilities | |
| MarketCap: 4527.64 Millions | |
| Recent Price: 11.73 Smart Investing & Trading Score: 74 | |
| Day Percent Change: -0.64% Day Change: -0.08 | |
| Week Change: 17.37% Year-to-date Change: -17.4% | |
| HE Links: Profile News Message Board | |
| Charts:- Daily , Weekly | |
| Add HE to Watchlist: View: Get Complete HE Trend Analysis ➞ | |
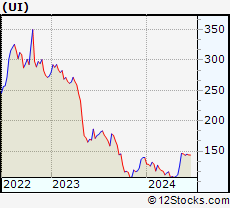 | UI Ubiquiti Inc. |
| Sector: Technology | |
| SubSector: Communication Equipment | |
| MarketCap: 9526.89 Millions | |
| Recent Price: 144.90 Smart Investing & Trading Score: 95 | |
| Day Percent Change: 2.00% Day Change: 2.84 | |
| Week Change: 15.11% Year-to-date Change: 3.8% | |
| UI Links: Profile News Message Board | |
| Charts:- Daily , Weekly | |
| Add UI to Watchlist: View: Get Complete UI Trend Analysis ➞ | |
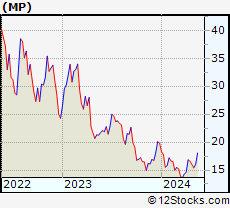 | MP MP Materials Corp. |
| Sector: Materials | |
| SubSector: Other Industrial Metals & Mining | |
| MarketCap: 41237 Millions | |
| Recent Price: 18.30 Smart Investing & Trading Score: 93 | |
| Day Percent Change: 1.22% Day Change: 0.22 | |
| Week Change: 13.45% Year-to-date Change: -7.8% | |
| MP Links: Profile News Message Board | |
| Charts:- Daily , Weekly | |
| Add MP to Watchlist: View: Get Complete MP Trend Analysis ➞ | |
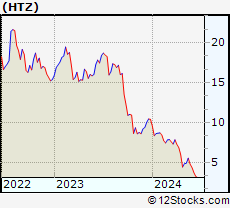 | HTZ Hertz Global Holdings, Inc. |
| Sector: Industrials | |
| SubSector: Rental & Leasing Services | |
| MarketCap: 5830 Millions | |
| Recent Price: 5.54 Smart Investing & Trading Score: 47 | |
| Day Percent Change: 0.45% Day Change: 0.03 | |
| Week Change: 13.39% Year-to-date Change: -46.6% | |
| HTZ Links: Profile News Message Board | |
| Charts:- Daily , Weekly | |
| Add HTZ to Watchlist: View: Get Complete HTZ Trend Analysis ➞ | |
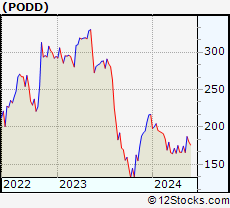 | PODD Insulet Corporation |
| Sector: Health Care | |
| SubSector: Medical Instruments & Supplies | |
| MarketCap: 9313.2 Millions | |
| Recent Price: 186.20 Smart Investing & Trading Score: 93 | |
| Day Percent Change: 0.44% Day Change: 0.82 | |
| Week Change: 12.24% Year-to-date Change: -14.2% | |
| PODD Links: Profile News Message Board | |
| Charts:- Daily , Weekly | |
| Add PODD to Watchlist: View: Get Complete PODD Trend Analysis ➞ | |
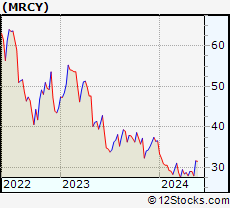 | MRCY Mercury Systems, Inc. |
| Sector: Technology | |
| SubSector: Computer Peripherals | |
| MarketCap: 3797.09 Millions | |
| Recent Price: 31.33 Smart Investing & Trading Score: 100 | |
| Day Percent Change: 0.32% Day Change: 0.10 | |
| Week Change: 11.93% Year-to-date Change: -14.3% | |
| MRCY Links: Profile News Message Board | |
| Charts:- Daily , Weekly | |
| Add MRCY to Watchlist: View: Get Complete MRCY Trend Analysis ➞ | |
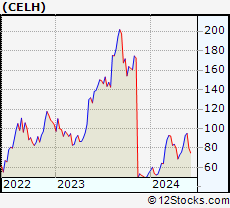 | CELH Celsius Holdings, Inc. |
| Sector: Consumer Staples | |
| SubSector: Beverages - Soft Drinks | |
| MarketCap: 280.32 Millions | |
| Recent Price: 92.68 Smart Investing & Trading Score: 73 | |
| Day Percent Change: 0.12% Day Change: 0.11 | |
| Week Change: 11.92% Year-to-date Change: 70.0% | |
| CELH Links: Profile News Message Board | |
| Charts:- Daily , Weekly | |
| Add CELH to Watchlist: View: Get Complete CELH Trend Analysis ➞ | |
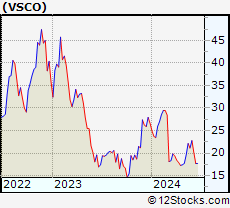 | VSCO Victorias Secret & Co. |
| Sector: Services & Goods | |
| SubSector: Apparel Retail | |
| MarketCap: 1340 Millions | |
| Recent Price: 21.89 Smart Investing & Trading Score: 42 | |
| Day Percent Change: 0.88% Day Change: 0.19 | |
| Week Change: 11.74% Year-to-date Change: -17.8% | |
| VSCO Links: Profile News Message Board | |
| Charts:- Daily , Weekly | |
| Add VSCO to Watchlist: View: Get Complete VSCO Trend Analysis ➞ | |
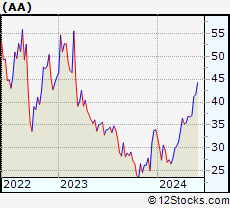 | AA Alcoa Corporation |
| Sector: Materials | |
| SubSector: Aluminum | |
| MarketCap: 1248.08 Millions | |
| Recent Price: 41.01 Smart Investing & Trading Score: 100 | |
| Day Percent Change: 2.14% Day Change: 0.86 | |
| Week Change: 10.48% Year-to-date Change: 20.6% | |
| AA Links: Profile News Message Board | |
| Charts:- Daily , Weekly | |
| Add AA to Watchlist: View: Get Complete AA Trend Analysis ➞ | |
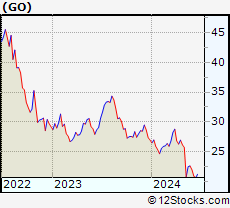 | GO Grocery Outlet Holding Corp. |
| Sector: Services & Goods | |
| SubSector: Grocery Stores | |
| MarketCap: 3065.95 Millions | |
| Recent Price: 22.73 Smart Investing & Trading Score: 32 | |
| Day Percent Change: 4.17% Day Change: 0.91 | |
| Week Change: 9.49% Year-to-date Change: -15.7% | |
| GO Links: Profile News Message Board | |
| Charts:- Daily , Weekly | |
| Add GO to Watchlist: View: Get Complete GO Trend Analysis ➞ | |
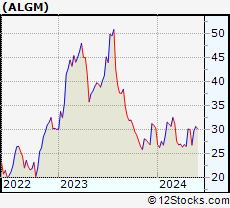 | ALGM Allegro MicroSystems, Inc. |
| Sector: Technology | |
| SubSector: Semiconductors | |
| MarketCap: 50287 Millions | |
| Recent Price: 29.26 Smart Investing & Trading Score: 45 | |
| Day Percent Change: -1.65% Day Change: -0.49 | |
| Week Change: 9.34% Year-to-date Change: -3.4% | |
| ALGM Links: Profile News Message Board | |
| Charts:- Daily , Weekly | |
| Add ALGM to Watchlist: View: Get Complete ALGM Trend Analysis ➞ | |
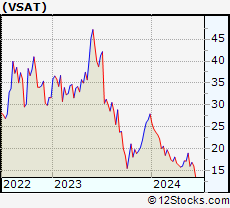 | VSAT Viasat, Inc. |
| Sector: Technology | |
| SubSector: Communication Equipment | |
| MarketCap: 1939.59 Millions | |
| Recent Price: 18.75 Smart Investing & Trading Score: 74 | |
| Day Percent Change: 1.52% Day Change: 0.28 | |
| Week Change: 9.08% Year-to-date Change: -32.9% | |
| VSAT Links: Profile News Message Board | |
| Charts:- Daily , Weekly | |
| Add VSAT to Watchlist: View: Get Complete VSAT Trend Analysis ➞ | |
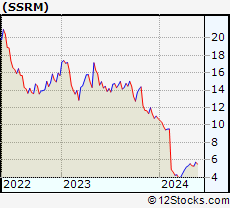 | SSRM SSR Mining Inc. |
| Sector: Materials | |
| SubSector: Gold | |
| MarketCap: 1546.09 Millions | |
| Recent Price: 5.78 Smart Investing & Trading Score: 100 | |
| Day Percent Change: 6.84% Day Change: 0.37 | |
| Week Change: 9.06% Year-to-date Change: -46.3% | |
| SSRM Links: Profile News Message Board | |
| Charts:- Daily , Weekly | |
| Add SSRM to Watchlist: View: Get Complete SSRM Trend Analysis ➞ | |
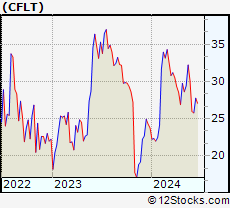 | CFLT Confluent, Inc. |
| Sector: Technology | |
| SubSector: Software - Infrastructure | |
| MarketCap: 10820 Millions | |
| Recent Price: 32.03 Smart Investing & Trading Score: 69 | |
| Day Percent Change: 1.59% Day Change: 0.50 | |
| Week Change: 8.87% Year-to-date Change: 34.9% | |
| CFLT Links: Profile News Message Board | |
| Charts:- Daily , Weekly | |
| Add CFLT to Watchlist: View: Get Complete CFLT Trend Analysis ➞ | |
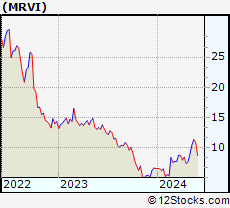 | MRVI Maravai LifeSciences Holdings, Inc. |
| Sector: Health Care | |
| SubSector: Biotechnology | |
| MarketCap: 67887 Millions | |
| Recent Price: 11.33 Smart Investing & Trading Score: 95 | |
| Day Percent Change: 2.07% Day Change: 0.23 | |
| Week Change: 8.32% Year-to-date Change: 73.0% | |
| MRVI Links: Profile News Message Board | |
| Charts:- Daily , Weekly | |
| Add MRVI to Watchlist: View: Get Complete MRVI Trend Analysis ➞ | |
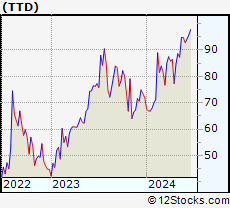 | TTD The Trade Desk, Inc. |
| Sector: Technology | |
| SubSector: Application Software | |
| MarketCap: 9006.92 Millions | |
| Recent Price: 94.50 Smart Investing & Trading Score: 95 | |
| Day Percent Change: 1.40% Day Change: 1.31 | |
| Week Change: 8.29% Year-to-date Change: 31.3% | |
| TTD Links: Profile News Message Board | |
| Charts:- Daily , Weekly | |
| Add TTD to Watchlist: View: Get Complete TTD Trend Analysis ➞ | |
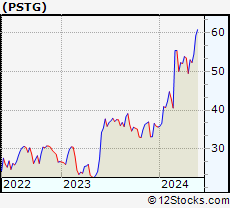 | PSTG Pure Storage, Inc. |
| Sector: Technology | |
| SubSector: Data Storage Devices | |
| MarketCap: 2993.99 Millions | |
| Recent Price: 58.84 Smart Investing & Trading Score: 100 | |
| Day Percent Change: -0.02% Day Change: -0.01 | |
| Week Change: 8.14% Year-to-date Change: 65.0% | |
| PSTG Links: Profile News Message Board | |
| Charts:- Daily , Weekly | |
| Add PSTG to Watchlist: View: Get Complete PSTG Trend Analysis ➞ | |
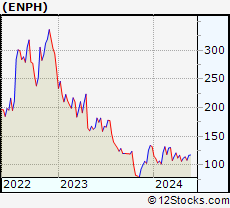 | ENPH Enphase Energy, Inc. |
| Sector: Technology | |
| SubSector: Semiconductor Equipment & Materials | |
| MarketCap: 4047.48 Millions | |
| Recent Price: 116.78 Smart Investing & Trading Score: 55 | |
| Day Percent Change: -0.09% Day Change: -0.11 | |
| Week Change: 7.78% Year-to-date Change: -11.6% | |
| ENPH Links: Profile News Message Board | |
| Charts:- Daily , Weekly | |
| Add ENPH to Watchlist: View: Get Complete ENPH Trend Analysis ➞ | |
| For tabular summary view of above stock list: Summary View ➞ 0 - 25 , 25 - 50 , 50 - 75 , 75 - 100 , 100 - 125 , 125 - 150 , 150 - 175 , 175 - 200 , 200 - 225 , 225 - 250 , 250 - 275 , 275 - 300 , 300 - 325 , 325 - 350 , 350 - 375 , 375 - 400 , 400 - 425 , 425 - 450 , 450 - 475 , 475 - 500 , 500 - 525 , 525 - 550 , 550 - 575 , 575 - 600 , 600 - 625 , 625 - 650 , 650 - 675 , 675 - 700 , 700 - 725 , 725 - 750 , 750 - 775 | ||
| Click To Change The Sort Order: By Market Cap or Company Size Performance: Year-to-date, Week and Day | |
| Select Chart Type: | ||
|
Best Stocks Today 12Stocks.com |
© 2024 12Stocks.com Terms & Conditions Privacy Contact Us
All Information Provided Only For Education And Not To Be Used For Investing or Trading. See Terms & Conditions


One More Thing ... Get Best Stocks Delivered Daily!
Never Ever Miss A Move With Our Top Ten Stocks Lists
Find Best Stocks In Any Market - Bull or Bear Market
Take A Peek At Our Top Ten Stocks Lists: Daily, Weekly, Year-to-Date & Top Trends
Find Best Stocks In Any Market - Bull or Bear Market
Take A Peek At Our Top Ten Stocks Lists: Daily, Weekly, Year-to-Date & Top Trends
Midcap Stocks With Best Up Trends [0-bearish to 100-bullish]: SSR Mining[100], DuPont de[100], Tractor Supply[100], Royal Gold[100], Range Resources[100], EQT [100], Alcoa [100], Arch Capital[100], Kirby [100], Baker Hughes[100], Aflac [100]
Best Midcap Stocks Year-to-Date:
Vistra Energy[144.65%], AppLovin [109.42%], Constellation Energy[85.36%], EMCOR [75.29%], CAVA [75.24%], ShockWave Medical[73.3%], Maravai LifeSciences[72.98%], Natera [70.43%], Tenet [69.99%], Celsius [69.99%], Pure Storage[65%] Best Midcap Stocks This Week:
AMC Entertainment[50.34%], Petco Health[49.7%], NovoCure [33.27%], Plug Power[25.78%], GameStop [21.02%], Doximity [19.6%], Robinhood Markets[17.38%], Hawaiian Electric[17.37%], Ubiquiti [15.11%], MP Materials[13.45%], Hertz Global[13.39%] Best Midcap Stocks Daily:
Doximity [17.73%], SSR Mining[6.84%], Robinhood Markets[6.42%], Grocery Outlet[4.17%], DoubleVerify [3.05%], Littelfuse [3.04%], DuPont de[2.89%], Tractor Supply[2.70%], Royal Gold[2.67%], DaVita [2.64%], Range Resources[2.60%]