
 Login Sign Up


| |||||
 |  | ||||

| 12Stocks.com Market Intelligence |
Best MidCap Stocks
|
| In a hurry? Mid Cap Stocks Lists: Performance Trends Table, Stock Charts
Sort midcap stocks: Daily, Weekly, Year-to-Date, Market Cap & Trends. Filter midcap stocks list by sector: Show all, Tech, Finance, Energy, Staples, Retail, Industrial, Materials, Utilities and HealthCare Filter midcap stocks list by size:All MidCap Large Mid-Range Small |
| 12Stocks.com Mid Cap Stocks Performances & Trends Daily | |||||||||
|
|  The overall Smart Investing & Trading Score is 76 (0-bearish to 100-bullish) which puts Mid Cap index in short term neutral to bullish trend. The Smart Investing & Trading Score from previous trading session is 75 and hence an improvement of trend.
| ||||||||
Here are the Smart Investing & Trading Scores of the most requested mid cap stocks at 12Stocks.com (click stock name for detailed review):
|


| 12Stocks.com: Top Performing Mid Cap Index Stocks | ||||||||||||||||||||||||||||||||||||||||||||||||
 The top performing Mid Cap Index stocks year to date are
Now, more recently, over last week, the top performing Mid Cap Index stocks on the move are


|
||||||||||||||||||||||||||||||||||||||||||||||||
| 12Stocks.com: Investing in Midcap Index with Stocks | |
|
The following table helps investors and traders sort through current performance and trends (as measured by Smart Investing & Trading Score) of various
stocks in the Midcap Index. Quick View: Move mouse or cursor over stock symbol (ticker) to view short-term technical chart and over stock name to view long term chart. Click on  to add stock symbol to your watchlist and to add stock symbol to your watchlist and  to view watchlist. Click on any ticker or stock name for detailed market intelligence report for that stock. to view watchlist. Click on any ticker or stock name for detailed market intelligence report for that stock. |
12Stocks.com Performance of Stocks in Midcap Index
| Ticker | Stock Name | Watchlist | Category | Recent Price | Smart Investing & Trading Score | Change % | YTD Change% |
| FSLR | First Solar |   | Technology | 212.15 | 100 | 8.05 | 23.14% |
| COIN | Coinbase Global | | Financials | 221.19 | 80 | 7.21 | 28.01% |
| M | Macy s | | Services & Goods | 20.08 | 73 | 5.13 | -0.20% |
| EXAS | Exact Sciences | | Health Care | 53.55 | 32 | 5.00 | -27.62% |
| RUN | Sunrun | | Technology | 11.99 | 20 | 4.99 | -38.92% |
| GO | Grocery Outlet | | Services & Goods | 23.00 | 24 | 4.66 | -14.67% |
| TNDM | Tandem Diabetes | | Health Care | 49.36 | 100 | 4.51 | 66.87% |
| CROX | Crocs | | Consumer Staples | 144.49 | 83 | 3.71 | 54.68% |
| AA | Alcoa | | Materials | 44.09 | 100 | 3.67 | 29.68% |
| CAVA | CAVA | | Services & Goods | 81.48 | 100 | 3.55 | 87.40% |
| VST | Vistra Energy | | Utilities | 94.24 | 56 | 2.98 | 144.65% |
| CEG | Constellation Energy | | Utilities | 218.90 | 85 | 2.89 | 86.92% |
| OHI | Omega | | Financials | 31.72 | 100 | 2.79 | 3.46% |
| HPQ | HP | | Technology | 32.69 | 100 | 2.73 | 8.64% |
| GLW | Corning | | Technology | 36.48 | 100 | 2.70 | 19.80% |
| KEX | Kirby | | Transports | 121.74 | 95 | 2.66 | 55.12% |
| LYV | Live Nation | | Services & Goods | 101.98 | 100 | 2.56 | 8.95% |
| HOOD | Robinhood Markets | | Technology | 20.66 | 100 | 2.56 | 62.93% |
| CG | Carlyle | | Financials | 44.40 | 64 | 2.36 | 9.11% |
| YETI | YETI | | Consumer Staples | 40.08 | 37 | 2.35 | -22.60% |
| UAA | Under Armour | | Consumer Staples | 6.85 | 45 | 2.24 | -22.07% |
| AZEK | AZEK | | Industrials | 47.25 | 22 | 2.16 | 23.53% |
| LNC | Loln National | | Financials | 30.67 | 95 | 2.10 | 13.72% |
| CW | Curtiss-Wright | | Industrials | 285.21 | 100 | 2.08 | 28.02% |
| RCL | Royal Caribbean | | Services & Goods | 150.75 | 95 | 2.06 | 16.42% |
| For chart view version of above stock list: Chart View ➞ 0 - 25 , 25 - 50 , 50 - 75 , 75 - 100 , 100 - 125 , 125 - 150 , 150 - 175 , 175 - 200 , 200 - 225 , 225 - 250 , 250 - 275 , 275 - 300 , 300 - 325 , 325 - 350 , 350 - 375 , 375 - 400 , 400 - 425 , 425 - 450 , 450 - 475 , 475 - 500 , 500 - 525 , 525 - 550 , 550 - 575 , 575 - 600 , 600 - 625 , 625 - 650 , 650 - 675 , 675 - 700 , 700 - 725 , 725 - 750 , 750 - 775 | ||
 | Click To Change The Sort Order: By Market Cap or Company Size Performance: Year-to-date, Week and Day |  |
|
Get the most comprehensive stock market coverage daily at 12Stocks.com ➞ Best Stocks Today ➞ Best Stocks Weekly ➞ Best Stocks Year-to-Date ➞ Best Stocks Trends ➞  Best Stocks Today 12Stocks.com Best Nasdaq Stocks ➞ Best S&P 500 Stocks ➞ Best Tech Stocks ➞ Best Biotech Stocks ➞ |
| Detailed Overview of Midcap Stocks |
| Midcap Technical Overview, Leaders & Laggards, Top Midcap ETF Funds & Detailed Midcap Stocks List, Charts, Trends & More |
| Midcap: Technical Analysis, Trends & YTD Performance | |
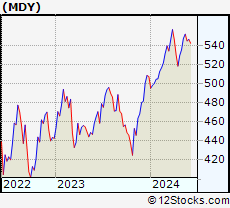
| MidCap segment as represented by
MDY, an exchange-traded fund [ETF], holds basket of about four hundred midcap stocks from across all major sectors of the US stock market. The midcap index (contains stocks like Green Mountain Coffee Roasters and Tractor Supply Company) is up by 8.63% and is currently underperforming the overall market by -2.28% year-to-date. Below is a quick view of technical charts and trends: | |
 MDY Weekly Chart |
|
| Long Term Trend: Very Good | |
| Medium Term Trend: Very Good | |
 MDY Daily Chart |
|
| Short Term Trend: Not Good | |
| Overall Trend Score: 76 | |
| YTD Performance: 8.63% | |
| **Trend Scores & Views Are Only For Educational Purposes And Not For Investing | |
| 12Stocks.com: Investing in Midcap Index using Exchange Traded Funds | |
|
The following table shows list of key exchange traded funds (ETF) that
help investors track Midcap index. The following list also includes leveraged ETF funds that track twice or thrice the daily returns of Midcap indices. Short or inverse ETF funds move in the opposite direction to the index they track and are useful during market pullbacks or during bear markets. Quick View: Move mouse or cursor over ETF symbol (ticker) to view short-term technical chart and over ETF name to view long term chart. Click on ticker or stock name for detailed view. Click on to add stock symbol to your watchlist and to view watchlist. |
12Stocks.com List of ETFs that track Midcap Index
| Ticker | ETF Name | Watchlist | Recent Price | Smart Investing & Trading Score | Change % | Week % | Year-to-date % |
| IJH | iShares Core S&P Mid-Cap | | 60.27 | 69 | -0.12 | -0.07 | 8.73% |
| IWR | iShares Russell Mid-Cap | | 83.25 | 69 | -0.13 | -0.05 | 7.1% |
| IWP | iShares Russell Mid-Cap Growth | | 111.81 | 51 | -0.43 | -0.18 | 7.04% |
| MDY | SPDR S&P MidCap 400 ETF | | 551.16 | 76 | -0.10 | -0.1 | 8.63% |
| IJK | iShares S&P Mid-Cap 400 Growth | | 90.52 | 56 | -0.19 | 0.27 | 14.26% |
| IWS | iShares Russell Mid-Cap Value | | 124.57 | 69 | -0.02 | 0.05 | 7.12% |
| IJJ | iShares S&P Mid-Cap 400 Value | | 117.16 | 61 | -0.19 | -0.47 | 2.74% |
| XMLV | PowerShares S&P MidCap Low Volatil ETF | | 56.93 | 73 | 0.09 | 0 | 7.05% |
| UMDD | ProShares UltraPro MidCap400 | | 26.77 | 68 | -0.45 | -0.22 | 19.94% |
| MVV | ProShares Ultra MidCap400 | | 66.29 | 74 | -0.31 | -0.2 | 14.51% |
| SMDD | ProShares UltraPro Short MidCap400 | | 10.50 | 37 | 0.67 | 0.22 | -22.01% |
| MZZ | ProShares UltraShort MidCap400 | | 10.84 | 27 | 0.25 | 0.25 | -13.77% |
| MYY | ProShares Short MidCap400 | | 20.06 | 32 | 0.35 | 0.3 | -6.5% |
| 12Stocks.com: Charts, Trends, Fundamental Data and Performances of MidCap Stocks | |
|
We now take in-depth look at all MidCap stocks including charts, multi-period performances and overall trends (as measured by Smart Investing & Trading Score). One can sort MidCap stocks (click link to choose) by Daily, Weekly and by Year-to-Date performances. Also, one can sort by size of the company or by market capitalization. |
| Select Your Default Chart Type: | |||||
| |||||
| Click on stock symbol or name for detailed view. Click on to add stock symbol to your watchlist and to view watchlist. Quick View: Move mouse or cursor over "Daily" to quickly view daily technical stock chart and over "Weekly" to view weekly technical stock chart. | |||||

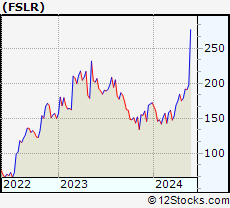 | FSLR First Solar, Inc. |
| Sector: Technology | |
| SubSector: Semiconductor - Specialized | |
| MarketCap: 3617.9 Millions | |
| Recent Price: 212.15 Smart Investing & Trading Score: 100 | |
| Day Percent Change: 8.05% Day Change: 15.81 | |
| Week Change: 7.37% Year-to-date Change: 23.1% | |
| FSLR Links: Profile News Message Board | |
| Charts:- Daily , Weekly | |
| Add FSLR to Watchlist: View: Get Complete FSLR Trend Analysis ➞ | |
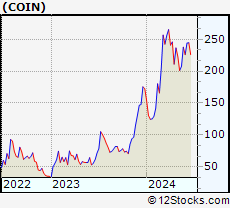 | COIN Coinbase Global, Inc. |
| Sector: Financials | |
| SubSector: Financial Data & Stock Exchanges | |
| MarketCap: 16390 Millions | |
| Recent Price: 221.19 Smart Investing & Trading Score: 80 | |
| Day Percent Change: 7.21% Day Change: 14.88 | |
| Week Change: 6.55% Year-to-date Change: 28.0% | |
| COIN Links: Profile News Message Board | |
| Charts:- Daily , Weekly | |
| Add COIN to Watchlist: View: Get Complete COIN Trend Analysis ➞ | |
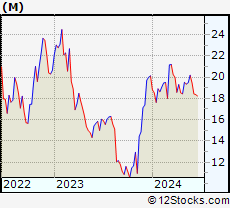 | M Macy s, Inc. |
| Sector: Services & Goods | |
| SubSector: Department Stores | |
| MarketCap: 2391.72 Millions | |
| Recent Price: 20.08 Smart Investing & Trading Score: 73 | |
| Day Percent Change: 5.13% Day Change: 0.98 | |
| Week Change: 3.03% Year-to-date Change: -0.2% | |
| M Links: Profile News Message Board | |
| Charts:- Daily , Weekly | |
| Add M to Watchlist: View: Get Complete M Trend Analysis ➞ | |
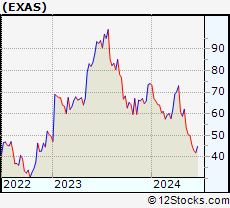 | EXAS Exact Sciences Corporation |
| Sector: Health Care | |
| SubSector: Medical Laboratories & Research | |
| MarketCap: 8572 Millions | |
| Recent Price: 53.55 Smart Investing & Trading Score: 32 | |
| Day Percent Change: 5.00% Day Change: 2.55 | |
| Week Change: 6.29% Year-to-date Change: -27.6% | |
| EXAS Links: Profile News Message Board | |
| Charts:- Daily , Weekly | |
| Add EXAS to Watchlist: View: Get Complete EXAS Trend Analysis ➞ | |
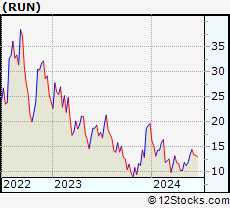 | RUN Sunrun Inc. |
| Sector: Technology | |
| SubSector: Semiconductor - Specialized | |
| MarketCap: 1286.2 Millions | |
| Recent Price: 11.99 Smart Investing & Trading Score: 20 | |
| Day Percent Change: 4.99% Day Change: 0.57 | |
| Week Change: 0.84% Year-to-date Change: -38.9% | |
| RUN Links: Profile News Message Board | |
| Charts:- Daily , Weekly | |
| Add RUN to Watchlist: View: Get Complete RUN Trend Analysis ➞ | |
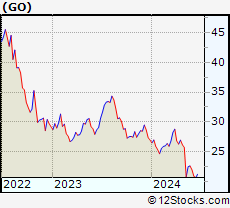 | GO Grocery Outlet Holding Corp. |
| Sector: Services & Goods | |
| SubSector: Grocery Stores | |
| MarketCap: 3065.95 Millions | |
| Recent Price: 23.00 Smart Investing & Trading Score: 24 | |
| Day Percent Change: 4.66% Day Change: 1.02 | |
| Week Change: 2.38% Year-to-date Change: -14.7% | |
| GO Links: Profile News Message Board | |
| Charts:- Daily , Weekly | |
| Add GO to Watchlist: View: Get Complete GO Trend Analysis ➞ | |
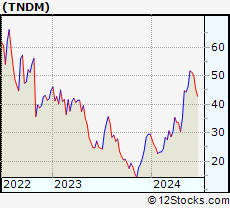 | TNDM Tandem Diabetes Care, Inc. |
| Sector: Health Care | |
| SubSector: Medical Instruments & Supplies | |
| MarketCap: 3359.1 Millions | |
| Recent Price: 49.36 Smart Investing & Trading Score: 100 | |
| Day Percent Change: 4.51% Day Change: 2.13 | |
| Week Change: 6.68% Year-to-date Change: 66.9% | |
| TNDM Links: Profile News Message Board | |
| Charts:- Daily , Weekly | |
| Add TNDM to Watchlist: View: Get Complete TNDM Trend Analysis ➞ | |
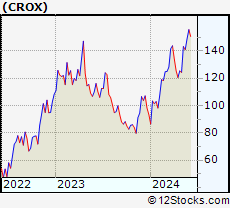 | CROX Crocs, Inc. |
| Sector: Consumer Staples | |
| SubSector: Textile - Apparel Footwear & Accessories | |
| MarketCap: 823.47 Millions | |
| Recent Price: 144.49 Smart Investing & Trading Score: 83 | |
| Day Percent Change: 3.71% Day Change: 5.17 | |
| Week Change: 2.51% Year-to-date Change: 54.7% | |
| CROX Links: Profile News Message Board | |
| Charts:- Daily , Weekly | |
| Add CROX to Watchlist: View: Get Complete CROX Trend Analysis ➞ | |
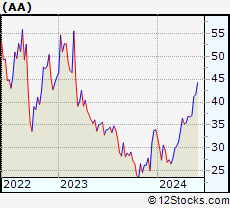 | AA Alcoa Corporation |
| Sector: Materials | |
| SubSector: Aluminum | |
| MarketCap: 1248.08 Millions | |
| Recent Price: 44.09 Smart Investing & Trading Score: 100 | |
| Day Percent Change: 3.67% Day Change: 1.56 | |
| Week Change: 6.96% Year-to-date Change: 29.7% | |
| AA Links: Profile News Message Board | |
| Charts:- Daily , Weekly | |
| Add AA to Watchlist: View: Get Complete AA Trend Analysis ➞ | |
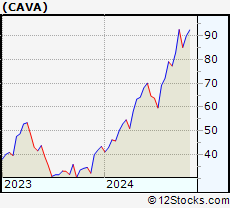 | CAVA CAVA Group, Inc. |
| Sector: Services & Goods | |
| SubSector: Restaurants | |
| MarketCap: 4510 Millions | |
| Recent Price: 81.48 Smart Investing & Trading Score: 100 | |
| Day Percent Change: 3.55% Day Change: 2.79 | |
| Week Change: 5.43% Year-to-date Change: 87.4% | |
| CAVA Links: Profile News Message Board | |
| Charts:- Daily , Weekly | |
| Add CAVA to Watchlist: View: Get Complete CAVA Trend Analysis ➞ | |
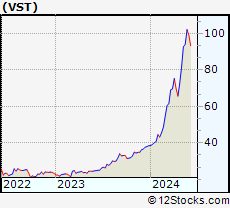 | VST Vistra Energy Corp. |
| Sector: Utilities | |
| SubSector: Electric Utilities | |
| MarketCap: 8396.44 Millions | |
| Recent Price: 94.24 Smart Investing & Trading Score: 56 | |
| Day Percent Change: 2.98% Day Change: 2.73 | |
| Week Change: 0.17% Year-to-date Change: 144.7% | |
| VST Links: Profile News Message Board | |
| Charts:- Daily , Weekly | |
| Add VST to Watchlist: View: Get Complete VST Trend Analysis ➞ | |
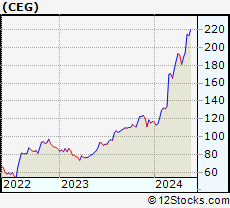 | CEG Constellation Energy Corporation |
| Sector: Utilities | |
| SubSector: Utilities - Renewable | |
| MarketCap: 29600 Millions | |
| Recent Price: 218.90 Smart Investing & Trading Score: 85 | |
| Day Percent Change: 2.89% Day Change: 6.15 | |
| Week Change: 2.72% Year-to-date Change: 86.9% | |
| CEG Links: Profile News Message Board | |
| Charts:- Daily , Weekly | |
| Add CEG to Watchlist: View: Get Complete CEG Trend Analysis ➞ | |
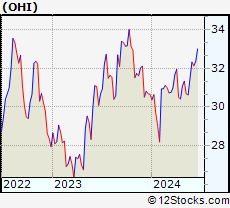 | OHI Omega Healthcare Investors, Inc. |
| Sector: Financials | |
| SubSector: REIT - Healthcare Facilities | |
| MarketCap: 6433.84 Millions | |
| Recent Price: 31.72 Smart Investing & Trading Score: 100 | |
| Day Percent Change: 2.79% Day Change: 0.86 | |
| Week Change: 3.56% Year-to-date Change: 3.5% | |
| OHI Links: Profile News Message Board | |
| Charts:- Daily , Weekly | |
| Add OHI to Watchlist: View: Get Complete OHI Trend Analysis ➞ | |
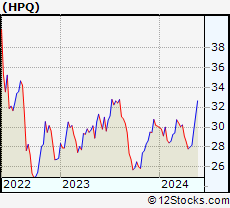 | HPQ HP Inc. |
| Sector: Technology | |
| SubSector: Diversified Computer Systems | |
| MarketCap: 22107.8 Millions | |
| Recent Price: 32.69 Smart Investing & Trading Score: 100 | |
| Day Percent Change: 2.73% Day Change: 0.87 | |
| Week Change: 4.81% Year-to-date Change: 8.6% | |
| HPQ Links: Profile News Message Board | |
| Charts:- Daily , Weekly | |
| Add HPQ to Watchlist: View: Get Complete HPQ Trend Analysis ➞ | |
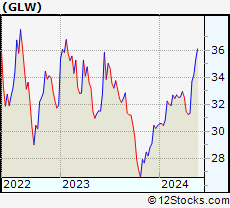 | GLW Corning Incorporated |
| Sector: Technology | |
| SubSector: Diversified Electronics | |
| MarketCap: 16287.6 Millions | |
| Recent Price: 36.48 Smart Investing & Trading Score: 100 | |
| Day Percent Change: 2.70% Day Change: 0.96 | |
| Week Change: 3.2% Year-to-date Change: 19.8% | |
| GLW Links: Profile News Message Board | |
| Charts:- Daily , Weekly | |
| Add GLW to Watchlist: View: Get Complete GLW Trend Analysis ➞ | |
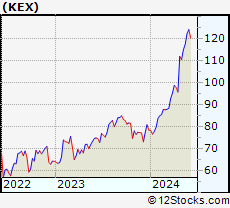 | KEX Kirby Corporation |
| Sector: Transports | |
| SubSector: Shipping | |
| MarketCap: 2533.34 Millions | |
| Recent Price: 121.74 Smart Investing & Trading Score: 95 | |
| Day Percent Change: 2.66% Day Change: 3.15 | |
| Week Change: 3.55% Year-to-date Change: 55.1% | |
| KEX Links: Profile News Message Board | |
| Charts:- Daily , Weekly | |
| Add KEX to Watchlist: View: Get Complete KEX Trend Analysis ➞ | |
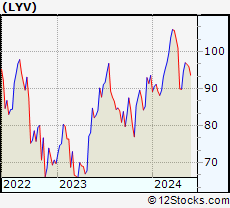 | LYV Live Nation Entertainment, Inc. |
| Sector: Services & Goods | |
| SubSector: Entertainment - Diversified | |
| MarketCap: 8457.17 Millions | |
| Recent Price: 101.98 Smart Investing & Trading Score: 100 | |
| Day Percent Change: 2.56% Day Change: 2.55 | |
| Week Change: 5.58% Year-to-date Change: 9.0% | |
| LYV Links: Profile News Message Board | |
| Charts:- Daily , Weekly | |
| Add LYV to Watchlist: View: Get Complete LYV Trend Analysis ➞ | |
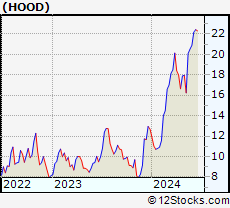 | HOOD Robinhood Markets, Inc. |
| Sector: Technology | |
| SubSector: Software - Infrastructure | |
| MarketCap: 9200 Millions | |
| Recent Price: 20.66 Smart Investing & Trading Score: 100 | |
| Day Percent Change: 2.56% Day Change: 0.52 | |
| Week Change: 2.84% Year-to-date Change: 62.9% | |
| HOOD Links: Profile News Message Board | |
| Charts:- Daily , Weekly | |
| Add HOOD to Watchlist: View: Get Complete HOOD Trend Analysis ➞ | |
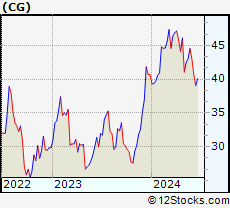 | CG The Carlyle Group Inc. |
| Sector: Financials | |
| SubSector: Asset Management | |
| MarketCap: 7269.33 Millions | |
| Recent Price: 44.40 Smart Investing & Trading Score: 64 | |
| Day Percent Change: 2.36% Day Change: 1.03 | |
| Week Change: 3.12% Year-to-date Change: 9.1% | |
| CG Links: Profile News Message Board | |
| Charts:- Daily , Weekly | |
| Add CG to Watchlist: View: Get Complete CG Trend Analysis ➞ | |
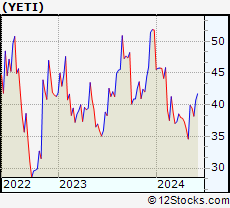 | YETI YETI Holdings, Inc. |
| Sector: Consumer Staples | |
| SubSector: Packaging & Containers | |
| MarketCap: 1495.53 Millions | |
| Recent Price: 40.08 Smart Investing & Trading Score: 37 | |
| Day Percent Change: 2.35% Day Change: 0.92 | |
| Week Change: 1.47% Year-to-date Change: -22.6% | |
| YETI Links: Profile News Message Board | |
| Charts:- Daily , Weekly | |
| Add YETI to Watchlist: View: Get Complete YETI Trend Analysis ➞ | |
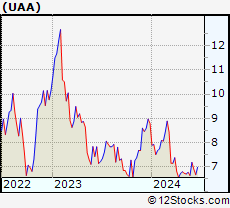 | UAA Under Armour, Inc. |
| Sector: Consumer Staples | |
| SubSector: Textile - Apparel Clothing | |
| MarketCap: 4066.75 Millions | |
| Recent Price: 6.85 Smart Investing & Trading Score: 45 | |
| Day Percent Change: 2.24% Day Change: 0.15 | |
| Week Change: 1.03% Year-to-date Change: -22.1% | |
| UAA Links: Profile News Message Board | |
| Charts:- Daily , Weekly | |
| Add UAA to Watchlist: View: Get Complete UAA Trend Analysis ➞ | |
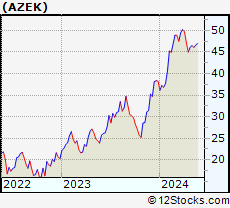 | AZEK The AZEK Company Inc. |
| Sector: Industrials | |
| SubSector: Building Products & Equipment | |
| MarketCap: 55127 Millions | |
| Recent Price: 47.25 Smart Investing & Trading Score: 22 | |
| Day Percent Change: 2.16% Day Change: 1.00 | |
| Week Change: 1.33% Year-to-date Change: 23.5% | |
| AZEK Links: Profile News Message Board | |
| Charts:- Daily , Weekly | |
| Add AZEK to Watchlist: View: Get Complete AZEK Trend Analysis ➞ | |
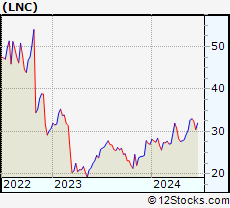 | LNC Lincoln National Corporation |
| Sector: Financials | |
| SubSector: Life Insurance | |
| MarketCap: 4545.26 Millions | |
| Recent Price: 30.67 Smart Investing & Trading Score: 95 | |
| Day Percent Change: 2.10% Day Change: 0.63 | |
| Week Change: 1.35% Year-to-date Change: 13.7% | |
| LNC Links: Profile News Message Board | |
| Charts:- Daily , Weekly | |
| Add LNC to Watchlist: View: Get Complete LNC Trend Analysis ➞ | |
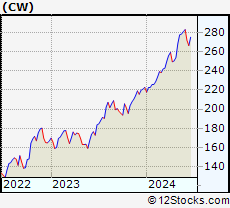 | CW Curtiss-Wright Corporation |
| Sector: Industrials | |
| SubSector: Diversified Machinery | |
| MarketCap: 4057.56 Millions | |
| Recent Price: 285.21 Smart Investing & Trading Score: 100 | |
| Day Percent Change: 2.08% Day Change: 5.82 | |
| Week Change: 2.52% Year-to-date Change: 28.0% | |
| CW Links: Profile News Message Board | |
| Charts:- Daily , Weekly | |
| Add CW to Watchlist: View: Get Complete CW Trend Analysis ➞ | |
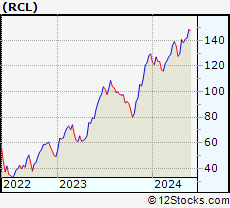 | RCL Royal Caribbean Cruises Ltd. |
| Sector: Services & Goods | |
| SubSector: Resorts & Casinos | |
| MarketCap: 7294.14 Millions | |
| Recent Price: 150.75 Smart Investing & Trading Score: 95 | |
| Day Percent Change: 2.06% Day Change: 3.05 | |
| Week Change: 6.22% Year-to-date Change: 16.4% | |
| RCL Links: Profile News Message Board | |
| Charts:- Daily , Weekly | |
| Add RCL to Watchlist: View: Get Complete RCL Trend Analysis ➞ | |
| For tabular summary view of above stock list: Summary View ➞ 0 - 25 , 25 - 50 , 50 - 75 , 75 - 100 , 100 - 125 , 125 - 150 , 150 - 175 , 175 - 200 , 200 - 225 , 225 - 250 , 250 - 275 , 275 - 300 , 300 - 325 , 325 - 350 , 350 - 375 , 375 - 400 , 400 - 425 , 425 - 450 , 450 - 475 , 475 - 500 , 500 - 525 , 525 - 550 , 550 - 575 , 575 - 600 , 600 - 625 , 625 - 650 , 650 - 675 , 675 - 700 , 700 - 725 , 725 - 750 , 750 - 775 | ||
| Click To Change The Sort Order: By Market Cap or Company Size Performance: Year-to-date, Week and Day | |
| Select Chart Type: | ||
|
Best Stocks Today 12Stocks.com |
© 2024 12Stocks.com Terms & Conditions Privacy Contact Us
All Information Provided Only For Education And Not To Be Used For Investing or Trading. See Terms & Conditions


One More Thing ... Get Best Stocks Delivered Daily!
Never Ever Miss A Move With Our Top Ten Stocks Lists
Find Best Stocks In Any Market - Bull or Bear Market
Take A Peek At Our Top Ten Stocks Lists: Daily, Weekly, Year-to-Date & Top Trends
Find Best Stocks In Any Market - Bull or Bear Market
Take A Peek At Our Top Ten Stocks Lists: Daily, Weekly, Year-to-Date & Top Trends
Midcap Stocks With Best Up Trends [0-bearish to 100-bullish]: First Solar[100], Tandem Diabetes[100], Alcoa [100], CAVA [100], Omega [100], HP [100], Corning [100], Live Nation[100], Robinhood Markets[100], Curtiss-Wright [100], Generac [100]
Best Midcap Stocks Year-to-Date:
Vistra Energy[144.65%], AppLovin [110.72%], CAVA [87.4%], Constellation Energy[86.92%], EMCOR [80.22%], Celsius [75.97%], ShockWave Medical[72.98%], Natera [72.83%], Tenet [72.5%], Pure Storage[68%], Tandem Diabetes[66.87%] Best Midcap Stocks This Week:
Carnival [8%], Norwegian Cruise[7.49%], First Solar[7.37%], Alcoa [6.96%], Tandem Diabetes[6.68%], Coinbase Global[6.55%], Generac [6.53%], Teradyne [6.3%], Exact Sciences[6.29%], Royal Caribbean[6.22%], AMC Entertainment[5.68%] Best Midcap Stocks Daily:
First Solar[8.05%], Coinbase Global[7.21%], Macy s[5.13%], Exact Sciences[5.00%], Sunrun [4.99%], Grocery Outlet[4.66%], Tandem Diabetes[4.51%], Crocs [3.71%], Alcoa [3.67%], CAVA [3.55%], Vistra Energy[2.98%]