
 Login Sign Up


| |||||
 |  | ||||

| 12Stocks.com Market Intelligence |
Best MidCap Stocks
|
| In a hurry? Mid Cap Stocks Lists: Performance Trends Table, Stock Charts
Sort midcap stocks: Daily, Weekly, Year-to-Date, Market Cap & Trends. Filter midcap stocks list by sector: Show all, Tech, Finance, Energy, Staples, Retail, Industrial, Materials, Utilities and HealthCare Filter midcap stocks list by size:All MidCap Large Mid-Range Small |
| 12Stocks.com Mid Cap Stocks Performances & Trends Daily | |||||||||
|
|  The overall Smart Investing & Trading Score is 76 (0-bearish to 100-bullish) which puts Mid Cap index in short term neutral to bullish trend. The Smart Investing & Trading Score from previous trading session is 100 and a deterioration of trend continues.
| ||||||||
Here are the Smart Investing & Trading Scores of the most requested mid cap stocks at 12Stocks.com (click stock name for detailed review):
|


| 12Stocks.com: Top Performing Mid Cap Index Stocks | ||||||||||||||||||||||||||||||||||||||||||||||||
 The top performing Mid Cap Index stocks year to date are
Now, more recently, over last week, the top performing Mid Cap Index stocks on the move are


|
||||||||||||||||||||||||||||||||||||||||||||||||
| 12Stocks.com: Investing in Midcap Index with Stocks | |
|
The following table helps investors and traders sort through current performance and trends (as measured by Smart Investing & Trading Score) of various
stocks in the Midcap Index. Quick View: Move mouse or cursor over stock symbol (ticker) to view short-term technical chart and over stock name to view long term chart. Click on  to add stock symbol to your watchlist and to add stock symbol to your watchlist and  to view watchlist. Click on any ticker or stock name for detailed market intelligence report for that stock. to view watchlist. Click on any ticker or stock name for detailed market intelligence report for that stock. |
12Stocks.com Performance of Stocks in Midcap Index
| Ticker | Stock Name | Watchlist | Category | Recent Price | Smart Investing & Trading Score | Change % | Weekly Change% |
| RGA | Reinsurance |   | Financials | 212.37 | 95 | 1.02% | 1.72% |
| ELAN | Elanco Animal | | Health Care | 17.19 | 76 | 1.24% | 1.72% |
| WBS | Webster Financial | | Financials | 46.66 | 59 | 0.69% | 1.70% |
| PCOR | Procore Technologies | | Technology | 69.46 | 42 | 0.33% | 1.70% |
| MTCH | Match | | Technology | 31.21 | 27 | -0.48% | 1.69% |
| CHRW | C.H. Robinson | | Transports | 84.11 | 83 | 1.15% | 1.68% |
| DLR | Digital Realty | | Financials | 143.83 | 47 | -0.77% | 1.68% |
| MAA | Mid-America Apartment | | Financials | 137.74 | 76 | 0.64% | 1.68% |
| AFG | American Financial | | Financials | 133.55 | 100 | 0.01% | 1.67% |
| DVA | DaVita | | Health Care | 139.82 | 95 | 2.45% | 1.67% |
| TDC | Teradata | | Technology | 33.57 | 20 | -1.15% | 1.67% |
| APA | Apache | | Energy | 30.88 | 68 | 1.21% | 1.65% |
| DFS | Discover Financial | | Financials | 125.42 | 63 | 0.49% | 1.64% |
| RNR | RenaissanceRe | | Financials | 229.43 | 90 | 1.14% | 1.63% |
| OGE | OGE Energy | | Utilities | 36.96 | 90 | 0.35% | 1.59% |
| LAD | Lithia Motors | | Services & Goods | 268.46 | 32 | -0.18% | 1.59% |
| LBRDA | Liberty Broadband | | Technology | 53.68 | 50 | -1.11% | 1.59% |
| THG | Hanover Insurance | | Financials | 137.56 | 100 | 0.79% | 1.58% |
| PNW | Pinnacle West | | Utilities | 78.44 | 100 | 0.80% | 1.55% |
| KMX | CarMax | | Services & Goods | 72.82 | 32 | -0.22% | 1.55% |
| PPL | PPL | | Utilities | 29.59 | 90 | -0.07% | 1.54% |
| SWKS | Skyworks Solutions | | Technology | 93.62 | 27 | -0.50% | 1.54% |
| OLN | Olin | | Materials | 56.15 | 76 | -0.46% | 1.52% |
| IR | Ingersoll Rand | | Industrials | 92.65 | 68 | 1.37% | 1.52% |
| VST | Vistra Energy | | Utilities | 94.08 | 83 | 1.01% | 1.50% |
| For chart view version of above stock list: Chart View ➞ 0 - 25 , 25 - 50 , 50 - 75 , 75 - 100 , 100 - 125 , 125 - 150 , 150 - 175 , 175 - 200 , 200 - 225 , 225 - 250 , 250 - 275 , 275 - 300 , 300 - 325 , 325 - 350 , 350 - 375 , 375 - 400 , 400 - 425 , 425 - 450 , 450 - 475 , 475 - 500 , 500 - 525 , 525 - 550 , 550 - 575 , 575 - 600 , 600 - 625 , 625 - 650 , 650 - 675 , 675 - 700 , 700 - 725 , 725 - 750 , 750 - 775 | ||
 | Click To Change The Sort Order: By Market Cap or Company Size Performance: Year-to-date, Week and Day |  |
|
Get the most comprehensive stock market coverage daily at 12Stocks.com ➞ Best Stocks Today ➞ Best Stocks Weekly ➞ Best Stocks Year-to-Date ➞ Best Stocks Trends ➞  Best Stocks Today 12Stocks.com Best Nasdaq Stocks ➞ Best S&P 500 Stocks ➞ Best Tech Stocks ➞ Best Biotech Stocks ➞ |
| Detailed Overview of Midcap Stocks |
| Midcap Technical Overview, Leaders & Laggards, Top Midcap ETF Funds & Detailed Midcap Stocks List, Charts, Trends & More |
| Midcap: Technical Analysis, Trends & YTD Performance | |
| MidCap segment as represented by
MDY, an exchange-traded fund [ETF], holds basket of about four hundred midcap stocks from across all major sectors of the US stock market. The midcap index (contains stocks like Green Mountain Coffee Roasters and Tractor Supply Company) is up by 8.73% and is currently underperforming the overall market by -1.84% year-to-date. Below is a quick view of technical charts and trends: | |
 MDY Weekly Chart |
|
| Long Term Trend: Very Good | |
| Medium Term Trend: Very Good | |
 MDY Daily Chart |
|
| Short Term Trend: Not Good | |
| Overall Trend Score: 76 | |
| YTD Performance: 8.73% | |
| **Trend Scores & Views Are Only For Educational Purposes And Not For Investing | |
| 12Stocks.com: Investing in Midcap Index using Exchange Traded Funds | |
|
The following table shows list of key exchange traded funds (ETF) that
help investors track Midcap index. The following list also includes leveraged ETF funds that track twice or thrice the daily returns of Midcap indices. Short or inverse ETF funds move in the opposite direction to the index they track and are useful during market pullbacks or during bear markets. Quick View: Move mouse or cursor over ETF symbol (ticker) to view short-term technical chart and over ETF name to view long term chart. Click on ticker or stock name for detailed view. Click on to add stock symbol to your watchlist and to view watchlist. |
12Stocks.com List of ETFs that track Midcap Index
| Ticker | ETF Name | Watchlist | Recent Price | Smart Investing & Trading Score | Change % | Week % | Year-to-date % |
| IJH | iShares Core S&P Mid-Cap | | 60.31 | 68 | -0.46 | 0.84 | 8.8% |
| MDY | SPDR S&P MidCap 400 ETF | | 551.69 | 76 | 0.11 | 0.84 | 8.73% |
| IWR | iShares Russell Mid-Cap | | 83.29 | 76 | -0.28 | 1.07 | 7.15% |
| IWP | iShares Russell Mid-Cap Growth | | 112.01 | 70 | -0.29 | 1.53 | 7.23% |
| IWS | iShares Russell Mid-Cap Value | | 124.51 | 76 | -0.34 | 0.92 | 7.07% |
| IJK | iShares S&P Mid-Cap 400 Growth | | 90.28 | 71 | -0.05 | 0.39 | 13.96% |
| IJJ | iShares S&P Mid-Cap 400 Value | | 117.71 | 76 | -0.16 | 1.26 | 3.22% |
| MVV | ProShares Ultra MidCap400 | | 66.42 | 76 | 0.02 | 1.65 | 14.74% |
| XMLV | PowerShares S&P MidCap Low Volatil ETF | | 56.93 | 76 | -0.02 | 0.42 | 7.05% |
| UMDD | ProShares UltraPro MidCap400 | | 26.83 | 76 | -0.58 | 1.98 | 20.21% |
| SMDD | ProShares UltraPro Short MidCap400 | | 10.48 | 25 | 0.73 | -1.92 | -22.18% |
| MYY | ProShares Short MidCap400 | | 20.00 | 25 | 0.60 | -0.61 | -6.78% |
| MZZ | ProShares UltraShort MidCap400 | | 10.81 | 27 | 0.49 | -1.25 | -13.98% |
| 12Stocks.com: Charts, Trends, Fundamental Data and Performances of MidCap Stocks | |
|
We now take in-depth look at all MidCap stocks including charts, multi-period performances and overall trends (as measured by Smart Investing & Trading Score). One can sort MidCap stocks (click link to choose) by Daily, Weekly and by Year-to-Date performances. Also, one can sort by size of the company or by market capitalization. |
| Select Your Default Chart Type: | |||||
| |||||
| Click on stock symbol or name for detailed view. Click on to add stock symbol to your watchlist and to view watchlist. Quick View: Move mouse or cursor over "Daily" to quickly view daily technical stock chart and over "Weekly" to view weekly technical stock chart. | |||||

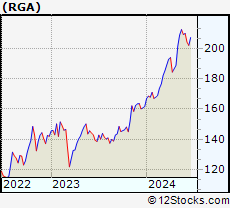 | RGA Reinsurance Group of America, Incorporated |
| Sector: Financials | |
| SubSector: Life Insurance | |
| MarketCap: 4423.36 Millions | |
| Recent Price: 212.37 Smart Investing & Trading Score: 95 | |
| Day Percent Change: 1.02% Day Change: 2.14 | |
| Week Change: 1.72% Year-to-date Change: 31.3% | |
| RGA Links: Profile News Message Board | |
| Charts:- Daily , Weekly | |
| Add RGA to Watchlist: View: Get Complete RGA Trend Analysis ➞ | |
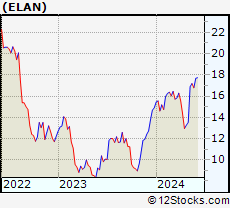 | ELAN Elanco Animal Health Incorporated |
| Sector: Health Care | |
| SubSector: Drugs - Generic | |
| MarketCap: 7752.15 Millions | |
| Recent Price: 17.19 Smart Investing & Trading Score: 76 | |
| Day Percent Change: 1.24% Day Change: 0.21 | |
| Week Change: 1.72% Year-to-date Change: 15.4% | |
| ELAN Links: Profile News Message Board | |
| Charts:- Daily , Weekly | |
| Add ELAN to Watchlist: View: Get Complete ELAN Trend Analysis ➞ | |
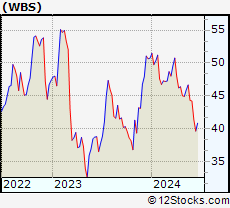 | WBS Webster Financial Corporation |
| Sector: Financials | |
| SubSector: Regional - Northeast Banks | |
| MarketCap: 2111.59 Millions | |
| Recent Price: 46.66 Smart Investing & Trading Score: 59 | |
| Day Percent Change: 0.69% Day Change: 0.32 | |
| Week Change: 1.7% Year-to-date Change: -8.1% | |
| WBS Links: Profile News Message Board | |
| Charts:- Daily , Weekly | |
| Add WBS to Watchlist: View: Get Complete WBS Trend Analysis ➞ | |
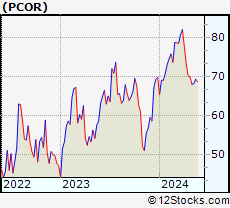 | PCOR Procore Technologies, Inc. |
| Sector: Technology | |
| SubSector: Software - Application | |
| MarketCap: 9180 Millions | |
| Recent Price: 69.46 Smart Investing & Trading Score: 42 | |
| Day Percent Change: 0.33% Day Change: 0.23 | |
| Week Change: 1.7% Year-to-date Change: -0.6% | |
| PCOR Links: Profile News Message Board | |
| Charts:- Daily , Weekly | |
| Add PCOR to Watchlist: View: Get Complete PCOR Trend Analysis ➞ | |
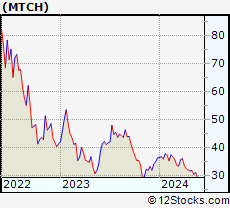 | MTCH Match Group, Inc. |
| Sector: Technology | |
| SubSector: Internet Information Providers | |
| MarketCap: 14655.8 Millions | |
| Recent Price: 31.21 Smart Investing & Trading Score: 27 | |
| Day Percent Change: -0.48% Day Change: -0.15 | |
| Week Change: 1.69% Year-to-date Change: -14.5% | |
| MTCH Links: Profile News Message Board | |
| Charts:- Daily , Weekly | |
| Add MTCH to Watchlist: View: Get Complete MTCH Trend Analysis ➞ | |
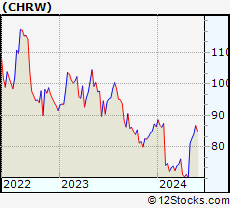 | CHRW C.H. Robinson Worldwide, Inc. |
| Sector: Transports | |
| SubSector: Air Delivery & Freight Services | |
| MarketCap: 9194.78 Millions | |
| Recent Price: 84.11 Smart Investing & Trading Score: 83 | |
| Day Percent Change: 1.15% Day Change: 0.96 | |
| Week Change: 1.68% Year-to-date Change: -2.6% | |
| CHRW Links: Profile News Message Board | |
| Charts:- Daily , Weekly | |
| Add CHRW to Watchlist: View: Get Complete CHRW Trend Analysis ➞ | |
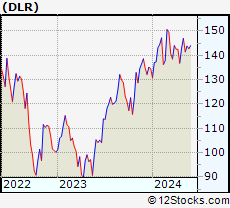 | DLR Digital Realty Trust, Inc. |
| Sector: Financials | |
| SubSector: REIT - Office | |
| MarketCap: 27038.6 Millions | |
| Recent Price: 143.83 Smart Investing & Trading Score: 47 | |
| Day Percent Change: -0.77% Day Change: -1.11 | |
| Week Change: 1.68% Year-to-date Change: 6.9% | |
| DLR Links: Profile News Message Board | |
| Charts:- Daily , Weekly | |
| Add DLR to Watchlist: View: Get Complete DLR Trend Analysis ➞ | |
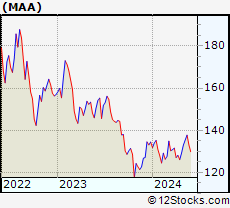 | MAA Mid-America Apartment Communities, Inc. |
| Sector: Financials | |
| SubSector: REIT - Residential | |
| MarketCap: 11385.5 Millions | |
| Recent Price: 137.74 Smart Investing & Trading Score: 76 | |
| Day Percent Change: 0.64% Day Change: 0.88 | |
| Week Change: 1.68% Year-to-date Change: 2.4% | |
| MAA Links: Profile News Message Board | |
| Charts:- Daily , Weekly | |
| Add MAA to Watchlist: View: Get Complete MAA Trend Analysis ➞ | |
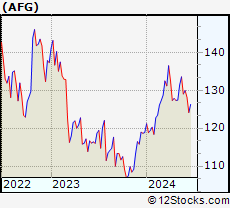 | AFG American Financial Group, Inc. |
| Sector: Financials | |
| SubSector: Property & Casualty Insurance | |
| MarketCap: 5353.82 Millions | |
| Recent Price: 133.55 Smart Investing & Trading Score: 100 | |
| Day Percent Change: 0.01% Day Change: 0.02 | |
| Week Change: 1.67% Year-to-date Change: 12.3% | |
| AFG Links: Profile News Message Board | |
| Charts:- Daily , Weekly | |
| Add AFG to Watchlist: View: Get Complete AFG Trend Analysis ➞ | |
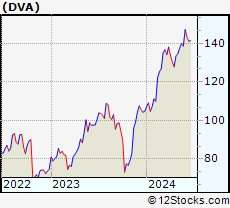 | DVA DaVita Inc. |
| Sector: Health Care | |
| SubSector: Specialized Health Services | |
| MarketCap: 8954.36 Millions | |
| Recent Price: 139.82 Smart Investing & Trading Score: 95 | |
| Day Percent Change: 2.45% Day Change: 3.34 | |
| Week Change: 1.67% Year-to-date Change: 33.5% | |
| DVA Links: Profile News Message Board | |
| Charts:- Daily , Weekly | |
| Add DVA to Watchlist: View: Get Complete DVA Trend Analysis ➞ | |
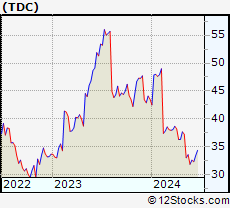 | TDC Teradata Corporation |
| Sector: Technology | |
| SubSector: Information Technology Services | |
| MarketCap: 2229.48 Millions | |
| Recent Price: 33.57 Smart Investing & Trading Score: 20 | |
| Day Percent Change: -1.15% Day Change: -0.39 | |
| Week Change: 1.67% Year-to-date Change: -22.9% | |
| TDC Links: Profile News Message Board | |
| Charts:- Daily , Weekly | |
| Add TDC to Watchlist: View: Get Complete TDC Trend Analysis ➞ | |
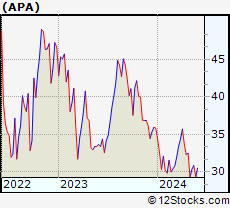 | APA Apache Corporation |
| Sector: Energy | |
| SubSector: Independent Oil & Gas | |
| MarketCap: 1937.53 Millions | |
| Recent Price: 30.88 Smart Investing & Trading Score: 68 | |
| Day Percent Change: 1.21% Day Change: 0.37 | |
| Week Change: 1.65% Year-to-date Change: -13.9% | |
| APA Links: Profile News Message Board | |
| Charts:- Daily , Weekly | |
| Add APA to Watchlist: View: Get Complete APA Trend Analysis ➞ | |
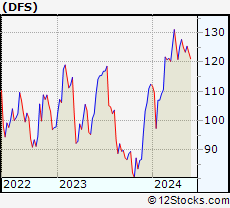 | DFS Discover Financial Services |
| Sector: Financials | |
| SubSector: Credit Services | |
| MarketCap: 9228.88 Millions | |
| Recent Price: 125.42 Smart Investing & Trading Score: 63 | |
| Day Percent Change: 0.49% Day Change: 0.61 | |
| Week Change: 1.64% Year-to-date Change: 11.6% | |
| DFS Links: Profile News Message Board | |
| Charts:- Daily , Weekly | |
| Add DFS to Watchlist: View: Get Complete DFS Trend Analysis ➞ | |
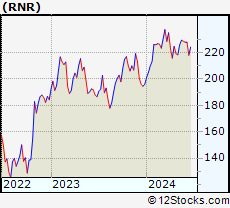 | RNR RenaissanceRe Holdings Ltd. |
| Sector: Financials | |
| SubSector: Property & Casualty Insurance | |
| MarketCap: 6153.32 Millions | |
| Recent Price: 229.43 Smart Investing & Trading Score: 90 | |
| Day Percent Change: 1.14% Day Change: 2.58 | |
| Week Change: 1.63% Year-to-date Change: 17.1% | |
| RNR Links: Profile News Message Board | |
| Charts:- Daily , Weekly | |
| Add RNR to Watchlist: View: Get Complete RNR Trend Analysis ➞ | |
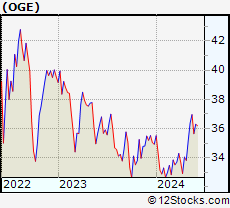 | OGE OGE Energy Corp. |
| Sector: Utilities | |
| SubSector: Electric Utilities | |
| MarketCap: 5454.34 Millions | |
| Recent Price: 36.96 Smart Investing & Trading Score: 90 | |
| Day Percent Change: 0.35% Day Change: 0.13 | |
| Week Change: 1.59% Year-to-date Change: 5.8% | |
| OGE Links: Profile News Message Board | |
| Charts:- Daily , Weekly | |
| Add OGE to Watchlist: View: Get Complete OGE Trend Analysis ➞ | |
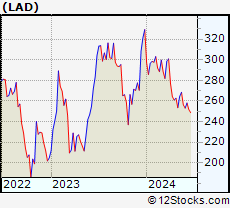 | LAD Lithia Motors, Inc. |
| Sector: Services & Goods | |
| SubSector: Auto Dealerships | |
| MarketCap: 1727.21 Millions | |
| Recent Price: 268.46 Smart Investing & Trading Score: 32 | |
| Day Percent Change: -0.18% Day Change: -0.49 | |
| Week Change: 1.59% Year-to-date Change: -18.5% | |
| LAD Links: Profile News Message Board | |
| Charts:- Daily , Weekly | |
| Add LAD to Watchlist: View: Get Complete LAD Trend Analysis ➞ | |
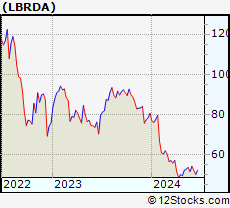 | LBRDA Liberty Broadband Corporation |
| Sector: Technology | |
| SubSector: CATV Systems | |
| MarketCap: 17001.5 Millions | |
| Recent Price: 53.68 Smart Investing & Trading Score: 50 | |
| Day Percent Change: -1.11% Day Change: -0.60 | |
| Week Change: 1.59% Year-to-date Change: -33.4% | |
| LBRDA Links: Profile News Message Board | |
| Charts:- Daily , Weekly | |
| Add LBRDA to Watchlist: View: Get Complete LBRDA Trend Analysis ➞ | |
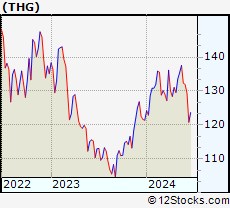 | THG The Hanover Insurance Group, Inc. |
| Sector: Financials | |
| SubSector: Property & Casualty Insurance | |
| MarketCap: 3677.92 Millions | |
| Recent Price: 137.56 Smart Investing & Trading Score: 100 | |
| Day Percent Change: 0.79% Day Change: 1.08 | |
| Week Change: 1.58% Year-to-date Change: 13.3% | |
| THG Links: Profile News Message Board | |
| Charts:- Daily , Weekly | |
| Add THG to Watchlist: View: Get Complete THG Trend Analysis ➞ | |
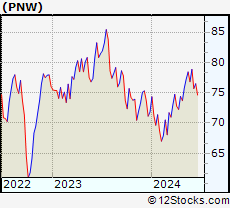 | PNW Pinnacle West Capital Corporation |
| Sector: Utilities | |
| SubSector: Electric Utilities | |
| MarketCap: 8240.24 Millions | |
| Recent Price: 78.44 Smart Investing & Trading Score: 100 | |
| Day Percent Change: 0.80% Day Change: 0.62 | |
| Week Change: 1.55% Year-to-date Change: 9.2% | |
| PNW Links: Profile News Message Board | |
| Charts:- Daily , Weekly | |
| Add PNW to Watchlist: View: Get Complete PNW Trend Analysis ➞ | |
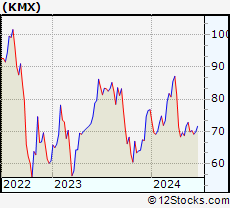 | KMX CarMax, Inc. |
| Sector: Services & Goods | |
| SubSector: Auto Dealerships | |
| MarketCap: 8121.71 Millions | |
| Recent Price: 72.82 Smart Investing & Trading Score: 32 | |
| Day Percent Change: -0.22% Day Change: -0.16 | |
| Week Change: 1.55% Year-to-date Change: -5.1% | |
| KMX Links: Profile News Message Board | |
| Charts:- Daily , Weekly | |
| Add KMX to Watchlist: View: Get Complete KMX Trend Analysis ➞ | |
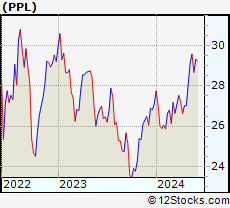 | PPL PPL Corporation |
| Sector: Utilities | |
| SubSector: Electric Utilities | |
| MarketCap: 16588.8 Millions | |
| Recent Price: 29.59 Smart Investing & Trading Score: 90 | |
| Day Percent Change: -0.07% Day Change: -0.02 | |
| Week Change: 1.54% Year-to-date Change: 9.2% | |
| PPL Links: Profile News Message Board | |
| Charts:- Daily , Weekly | |
| Add PPL to Watchlist: View: Get Complete PPL Trend Analysis ➞ | |
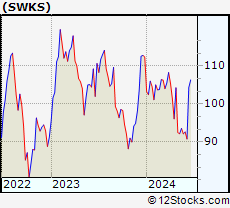 | SWKS Skyworks Solutions, Inc. |
| Sector: Technology | |
| SubSector: Semiconductor - Integrated Circuits | |
| MarketCap: 13981 Millions | |
| Recent Price: 93.62 Smart Investing & Trading Score: 27 | |
| Day Percent Change: -0.50% Day Change: -0.47 | |
| Week Change: 1.54% Year-to-date Change: -16.7% | |
| SWKS Links: Profile News Message Board | |
| Charts:- Daily , Weekly | |
| Add SWKS to Watchlist: View: Get Complete SWKS Trend Analysis ➞ | |
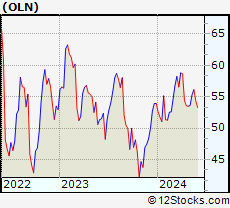 | OLN Olin Corporation |
| Sector: Materials | |
| SubSector: Specialty Chemicals | |
| MarketCap: 2126.87 Millions | |
| Recent Price: 56.15 Smart Investing & Trading Score: 76 | |
| Day Percent Change: -0.46% Day Change: -0.26 | |
| Week Change: 1.52% Year-to-date Change: 4.1% | |
| OLN Links: Profile News Message Board | |
| Charts:- Daily , Weekly | |
| Add OLN to Watchlist: View: Get Complete OLN Trend Analysis ➞ | |
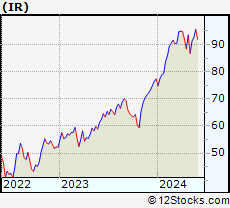 | IR Ingersoll Rand Inc. |
| Sector: Industrials | |
| SubSector: Diversified Machinery | |
| MarketCap: 8970.56 Millions | |
| Recent Price: 92.65 Smart Investing & Trading Score: 68 | |
| Day Percent Change: 1.37% Day Change: 1.25 | |
| Week Change: 1.52% Year-to-date Change: 19.8% | |
| IR Links: Profile News Message Board | |
| Charts:- Daily , Weekly | |
| Add IR to Watchlist: View: Get Complete IR Trend Analysis ➞ | |
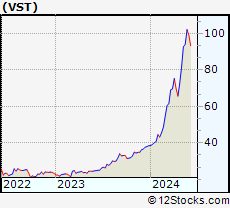 | VST Vistra Energy Corp. |
| Sector: Utilities | |
| SubSector: Electric Utilities | |
| MarketCap: 8396.44 Millions | |
| Recent Price: 94.08 Smart Investing & Trading Score: 83 | |
| Day Percent Change: 1.01% Day Change: 0.94 | |
| Week Change: 1.5% Year-to-date Change: 144.2% | |
| VST Links: Profile News Message Board | |
| Charts:- Daily , Weekly | |
| Add VST to Watchlist: View: Get Complete VST Trend Analysis ➞ | |
| For tabular summary view of above stock list: Summary View ➞ 0 - 25 , 25 - 50 , 50 - 75 , 75 - 100 , 100 - 125 , 125 - 150 , 150 - 175 , 175 - 200 , 200 - 225 , 225 - 250 , 250 - 275 , 275 - 300 , 300 - 325 , 325 - 350 , 350 - 375 , 375 - 400 , 400 - 425 , 425 - 450 , 450 - 475 , 475 - 500 , 500 - 525 , 525 - 550 , 550 - 575 , 575 - 600 , 600 - 625 , 625 - 650 , 650 - 675 , 675 - 700 , 700 - 725 , 725 - 750 , 750 - 775 | ||
| Click To Change The Sort Order: By Market Cap or Company Size Performance: Year-to-date, Week and Day | |
| Select Chart Type: | ||
|
Best Stocks Today 12Stocks.com |
© 2024 12Stocks.com Terms & Conditions Privacy Contact Us
All Information Provided Only For Education And Not To Be Used For Investing or Trading. See Terms & Conditions


One More Thing ... Get Best Stocks Delivered Daily!
Never Ever Miss A Move With Our Top Ten Stocks Lists
Find Best Stocks In Any Market - Bull or Bear Market
Take A Peek At Our Top Ten Stocks Lists: Daily, Weekly, Year-to-Date & Top Trends
Find Best Stocks In Any Market - Bull or Bear Market
Take A Peek At Our Top Ten Stocks Lists: Daily, Weekly, Year-to-Date & Top Trends
Midcap Stocks With Best Up Trends [0-bearish to 100-bullish]: Robinhood Markets[100], SSR Mining[100], Littelfuse [100], Tractor Supply[100], DuPont de[100], Royal Gold[100], Alcoa [100], Range Resources[100], Arch Capital[100], Evercore [100], Prosperity Bancshares[100]
Best Midcap Stocks Year-to-Date:
Vistra Energy[144.24%], AppLovin [107.29%], Constellation Energy[81.97%], CAVA [77.74%], EMCOR [75.63%], ShockWave Medical[73.24%], Maravai LifeSciences[72.82%], Celsius [70.62%], Tenet [70%], Natera [69.96%], Pure Storage[65.87%] Best Midcap Stocks This Week:
AMC Entertainment[51.2%], Petco Health[50%], NovoCure [33.52%], GameStop [27.21%], Plug Power[26.95%], Robinhood Markets[23.78%], Doximity [19.94%], Ubiquiti [16.29%], Hawaiian Electric[15.12%], MP Materials[13.14%], Victorias Secret[13.12%] Best Midcap Stocks Daily:
Doximity [18.07%], Robinhood Markets[12.23%], Affirm [8.01%], SSR Mining[6.28%], Coinbase Global[4.23%], Littelfuse [4.13%], Rivian Automotive[3.65%], DoubleVerify [3.50%], Tractor Supply[3.42%], Iridium [3.42%], Ubiquiti [3.04%]