
 Login Sign Up


| |||||
 |  | ||||

| 12Stocks.com Market Intelligence |
Best MidCap Stocks
|
| In a hurry? Mid Cap Stocks Lists: Performance Trends Table, Stock Charts
Sort midcap stocks: Daily, Weekly, Year-to-Date, Market Cap & Trends. Filter midcap stocks list by sector: Show all, Tech, Finance, Energy, Staples, Retail, Industrial, Materials, Utilities and HealthCare Filter midcap stocks list by size:All MidCap Large Mid-Range Small |
| 12Stocks.com Mid Cap Stocks Performances & Trends Daily | |||||||||
|
|  The overall Smart Investing & Trading Score is 76 (0-bearish to 100-bullish) which puts Mid Cap index in short term neutral to bullish trend. The Smart Investing & Trading Score from previous trading session is 100 and a deterioration of trend continues.
| ||||||||
Here are the Smart Investing & Trading Scores of the most requested mid cap stocks at 12Stocks.com (click stock name for detailed review):
|


| 12Stocks.com: Top Performing Mid Cap Index Stocks | ||||||||||||||||||||||||||||||||||||||||||||||||
 The top performing Mid Cap Index stocks year to date are
Now, more recently, over last week, the top performing Mid Cap Index stocks on the move are


|
||||||||||||||||||||||||||||||||||||||||||||||||
| 12Stocks.com: Investing in Midcap Index with Stocks | |
|
The following table helps investors and traders sort through current performance and trends (as measured by Smart Investing & Trading Score) of various
stocks in the Midcap Index. Quick View: Move mouse or cursor over stock symbol (ticker) to view short-term technical chart and over stock name to view long term chart. Click on  to add stock symbol to your watchlist and to add stock symbol to your watchlist and  to view watchlist. Click on any ticker or stock name for detailed market intelligence report for that stock. to view watchlist. Click on any ticker or stock name for detailed market intelligence report for that stock. |
12Stocks.com Performance of Stocks in Midcap Index
| Ticker | Stock Name | Watchlist | Category | Recent Price | Smart Investing & Trading Score | Change % | Weekly Change% |
| CLF | Cleveland-Cliffs |   | Materials | 17.51 | 12 | -0.91% | 1.10% |
| HBAN | Huntington Bancshares | | Financials | 14.21 | 83 | 0.28% | 1.07% |
| AMG | Affiliated Managers | | Financials | 159.34 | 63 | 0.23% | 1.06% |
| CHH | Choice Hotels | | Services & Goods | 118.40 | 58 | -1.38% | 1.06% |
| THC | Tenet | | Health Care | 128.47 | 76 | 0.42% | 1.05% |
| EXPE | Expedia | | Services & Goods | 114.01 | 35 | 0.49% | 1.04% |
| CR | Crane Co | | Industrials | 145.41 | 63 | -0.12% | 1.04% |
| CCK | Crown | | Consumer Staples | 84.90 | 83 | -0.41% | 1.04% |
| LKQ | LKQ | | Consumer Staples | 44.67 | 64 | 1.18% | 1.04% |
| UAA | Under Armour | | Consumer Staples | 6.78 | 18 | 1.04% | 1.04% |
| SNV | Synovus Financial | | Financials | 40.11 | 76 | 1.11% | 1.03% |
| HAYW | Hayward | | Industrials | 14.69 | 50 | 0.07% | 1.03% |
| AVB | AvalonBay Communities | | Financials | 198.89 | 76 | 0.42% | 1.02% |
| DHI | D.R. Horton | | Industrials | 151.50 | 73 | 0.35% | 1.02% |
| ST | Sensata Technologies | | Technology | 42.77 | 76 | 0.30% | 1.02% |
| PSX | Phillips 66 | | Energy | 147.08 | 58 | 0.84% | 1.02% |
| DBX | Dropbox | | Technology | 23.73 | 17 | -0.96% | 1.02% |
| BPOP | Popular | | Financials | 91.84 | 76 | -0.79% | 1.01% |
| TSN | Tyson Foods | | Consumer Staples | 60.25 | 51 | -1.12% | 1.01% |
| CINF | Cinnati Financial | | Financials | 120.06 | 100 | 1.30% | 1.00% |
| ITT | ITT | | Industrials | 139.36 | 78 | 0.63% | 0.99% |
| WMS | Advanced Drainage | | Consumer Staples | 174.13 | 76 | 0.98% | 0.98% |
| DTE | DTE Energy | | Utilities | 116.60 | 90 | -0.15% | 0.96% |
| SBAC | SBA | | Technology | 199.38 | 50 | -1.72% | 0.95% |
| ACGL | Arch Capital | | Financials | 100.99 | 100 | 2.20% | 0.94% |
| For chart view version of above stock list: Chart View ➞ 0 - 25 , 25 - 50 , 50 - 75 , 75 - 100 , 100 - 125 , 125 - 150 , 150 - 175 , 175 - 200 , 200 - 225 , 225 - 250 , 250 - 275 , 275 - 300 , 300 - 325 , 325 - 350 , 350 - 375 , 375 - 400 , 400 - 425 , 425 - 450 , 450 - 475 , 475 - 500 , 500 - 525 , 525 - 550 , 550 - 575 , 575 - 600 , 600 - 625 , 625 - 650 , 650 - 675 , 675 - 700 , 700 - 725 , 725 - 750 , 750 - 775 | ||
 | Click To Change The Sort Order: By Market Cap or Company Size Performance: Year-to-date, Week and Day |  |
|
Get the most comprehensive stock market coverage daily at 12Stocks.com ➞ Best Stocks Today ➞ Best Stocks Weekly ➞ Best Stocks Year-to-Date ➞ Best Stocks Trends ➞  Best Stocks Today 12Stocks.com Best Nasdaq Stocks ➞ Best S&P 500 Stocks ➞ Best Tech Stocks ➞ Best Biotech Stocks ➞ |
| Detailed Overview of Midcap Stocks |
| Midcap Technical Overview, Leaders & Laggards, Top Midcap ETF Funds & Detailed Midcap Stocks List, Charts, Trends & More |
| Midcap: Technical Analysis, Trends & YTD Performance | |
| MidCap segment as represented by
MDY, an exchange-traded fund [ETF], holds basket of about four hundred midcap stocks from across all major sectors of the US stock market. The midcap index (contains stocks like Green Mountain Coffee Roasters and Tractor Supply Company) is up by 8.73% and is currently underperforming the overall market by -1.84% year-to-date. Below is a quick view of technical charts and trends: | |
 MDY Weekly Chart |
|
| Long Term Trend: Very Good | |
| Medium Term Trend: Very Good | |
 MDY Daily Chart |
|
| Short Term Trend: Not Good | |
| Overall Trend Score: 76 | |
| YTD Performance: 8.73% | |
| **Trend Scores & Views Are Only For Educational Purposes And Not For Investing | |
| 12Stocks.com: Investing in Midcap Index using Exchange Traded Funds | |
|
The following table shows list of key exchange traded funds (ETF) that
help investors track Midcap index. The following list also includes leveraged ETF funds that track twice or thrice the daily returns of Midcap indices. Short or inverse ETF funds move in the opposite direction to the index they track and are useful during market pullbacks or during bear markets. Quick View: Move mouse or cursor over ETF symbol (ticker) to view short-term technical chart and over ETF name to view long term chart. Click on ticker or stock name for detailed view. Click on to add stock symbol to your watchlist and to view watchlist. |
12Stocks.com List of ETFs that track Midcap Index
| Ticker | ETF Name | Watchlist | Recent Price | Smart Investing & Trading Score | Change % | Week % | Year-to-date % |
| IJH | iShares Core S&P Mid-Cap | | 60.31 | 68 | -0.46 | 0.84 | 8.8% |
| MDY | SPDR S&P MidCap 400 ETF | | 551.69 | 76 | 0.11 | 0.84 | 8.73% |
| IWR | iShares Russell Mid-Cap | | 83.29 | 76 | -0.28 | 1.07 | 7.15% |
| IWP | iShares Russell Mid-Cap Growth | | 112.01 | 70 | -0.29 | 1.53 | 7.23% |
| IWS | iShares Russell Mid-Cap Value | | 124.51 | 76 | -0.34 | 0.92 | 7.07% |
| IJK | iShares S&P Mid-Cap 400 Growth | | 90.28 | 71 | -0.05 | 0.39 | 13.96% |
| IJJ | iShares S&P Mid-Cap 400 Value | | 117.71 | 76 | -0.16 | 1.26 | 3.22% |
| MVV | ProShares Ultra MidCap400 | | 66.42 | 76 | 0.02 | 1.65 | 14.74% |
| XMLV | PowerShares S&P MidCap Low Volatil ETF | | 56.93 | 76 | -0.02 | 0.42 | 7.05% |
| UMDD | ProShares UltraPro MidCap400 | | 26.83 | 76 | -0.58 | 1.98 | 20.21% |
| SMDD | ProShares UltraPro Short MidCap400 | | 10.48 | 25 | 0.73 | -1.92 | -22.18% |
| MYY | ProShares Short MidCap400 | | 20.00 | 25 | 0.60 | -0.61 | -6.78% |
| MZZ | ProShares UltraShort MidCap400 | | 10.81 | 27 | 0.49 | -1.25 | -13.98% |
| 12Stocks.com: Charts, Trends, Fundamental Data and Performances of MidCap Stocks | |
|
We now take in-depth look at all MidCap stocks including charts, multi-period performances and overall trends (as measured by Smart Investing & Trading Score). One can sort MidCap stocks (click link to choose) by Daily, Weekly and by Year-to-Date performances. Also, one can sort by size of the company or by market capitalization. |
| Select Your Default Chart Type: | |||||
| |||||
| Click on stock symbol or name for detailed view. Click on to add stock symbol to your watchlist and to view watchlist. Quick View: Move mouse or cursor over "Daily" to quickly view daily technical stock chart and over "Weekly" to view weekly technical stock chart. | |||||

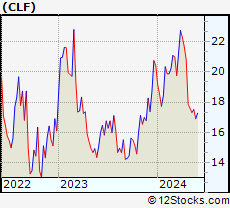 | CLF Cleveland-Cliffs Inc. |
| Sector: Materials | |
| SubSector: Industrial Metals & Minerals | |
| MarketCap: 957.61 Millions | |
| Recent Price: 17.51 Smart Investing & Trading Score: 12 | |
| Day Percent Change: -0.91% Day Change: -0.16 | |
| Week Change: 1.1% Year-to-date Change: -14.3% | |
| CLF Links: Profile News Message Board | |
| Charts:- Daily , Weekly | |
| Add CLF to Watchlist: View: Get Complete CLF Trend Analysis ➞ | |
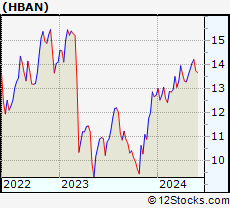 | HBAN Huntington Bancshares Incorporated |
| Sector: Financials | |
| SubSector: Regional - Midwest Banks | |
| MarketCap: 8468.1 Millions | |
| Recent Price: 14.21 Smart Investing & Trading Score: 83 | |
| Day Percent Change: 0.28% Day Change: 0.04 | |
| Week Change: 1.07% Year-to-date Change: 11.7% | |
| HBAN Links: Profile News Message Board | |
| Charts:- Daily , Weekly | |
| Add HBAN to Watchlist: View: Get Complete HBAN Trend Analysis ➞ | |
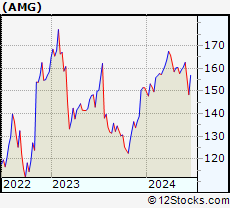 | AMG Affiliated Managers Group, Inc. |
| Sector: Financials | |
| SubSector: Asset Management | |
| MarketCap: 2849.63 Millions | |
| Recent Price: 159.34 Smart Investing & Trading Score: 63 | |
| Day Percent Change: 0.23% Day Change: 0.37 | |
| Week Change: 1.06% Year-to-date Change: 5.2% | |
| AMG Links: Profile News Message Board | |
| Charts:- Daily , Weekly | |
| Add AMG to Watchlist: View: Get Complete AMG Trend Analysis ➞ | |
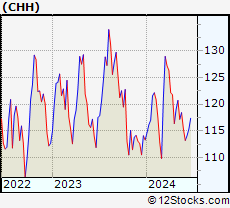 | CHH Choice Hotels International, Inc. |
| Sector: Services & Goods | |
| SubSector: Lodging | |
| MarketCap: 3427.56 Millions | |
| Recent Price: 118.40 Smart Investing & Trading Score: 58 | |
| Day Percent Change: -1.38% Day Change: -1.66 | |
| Week Change: 1.06% Year-to-date Change: 4.5% | |
| CHH Links: Profile News Message Board | |
| Charts:- Daily , Weekly | |
| Add CHH to Watchlist: View: Get Complete CHH Trend Analysis ➞ | |
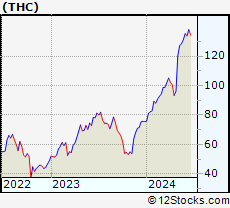 | THC Tenet Healthcare Corporation |
| Sector: Health Care | |
| SubSector: Hospitals | |
| MarketCap: 1544.46 Millions | |
| Recent Price: 128.47 Smart Investing & Trading Score: 76 | |
| Day Percent Change: 0.42% Day Change: 0.54 | |
| Week Change: 1.05% Year-to-date Change: 70.0% | |
| THC Links: Profile News Message Board | |
| Charts:- Daily , Weekly | |
| Add THC to Watchlist: View: Get Complete THC Trend Analysis ➞ | |
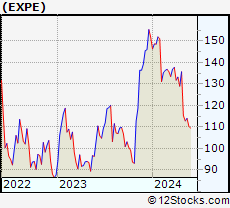 | EXPE Expedia Group, Inc. |
| Sector: Services & Goods | |
| SubSector: Lodging | |
| MarketCap: 8052.96 Millions | |
| Recent Price: 114.01 Smart Investing & Trading Score: 35 | |
| Day Percent Change: 0.49% Day Change: 0.56 | |
| Week Change: 1.04% Year-to-date Change: -24.9% | |
| EXPE Links: Profile News Message Board | |
| Charts:- Daily , Weekly | |
| Add EXPE to Watchlist: View: Get Complete EXPE Trend Analysis ➞ | |
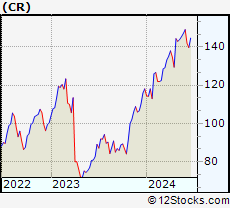 | CR Crane Co. |
| Sector: Industrials | |
| SubSector: Diversified Machinery | |
| MarketCap: 2715.16 Millions | |
| Recent Price: 145.41 Smart Investing & Trading Score: 63 | |
| Day Percent Change: -0.12% Day Change: -0.17 | |
| Week Change: 1.04% Year-to-date Change: 23.1% | |
| CR Links: Profile News Message Board | |
| Charts:- Daily , Weekly | |
| Add CR to Watchlist: View: Get Complete CR Trend Analysis ➞ | |
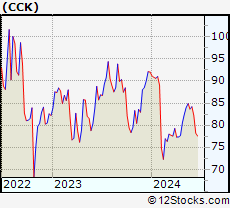 | CCK Crown Holdings, Inc. |
| Sector: Consumer Staples | |
| SubSector: Packaging & Containers | |
| MarketCap: 7198.03 Millions | |
| Recent Price: 84.90 Smart Investing & Trading Score: 83 | |
| Day Percent Change: -0.41% Day Change: -0.35 | |
| Week Change: 1.04% Year-to-date Change: -7.8% | |
| CCK Links: Profile News Message Board | |
| Charts:- Daily , Weekly | |
| Add CCK to Watchlist: View: Get Complete CCK Trend Analysis ➞ | |
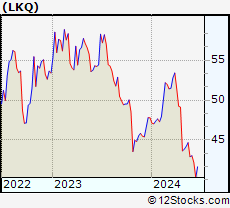 | LKQ LKQ Corporation |
| Sector: Consumer Staples | |
| SubSector: Auto Parts | |
| MarketCap: 5633.79 Millions | |
| Recent Price: 44.67 Smart Investing & Trading Score: 64 | |
| Day Percent Change: 1.18% Day Change: 0.52 | |
| Week Change: 1.04% Year-to-date Change: -6.5% | |
| LKQ Links: Profile News Message Board | |
| Charts:- Daily , Weekly | |
| Add LKQ to Watchlist: View: Get Complete LKQ Trend Analysis ➞ | |
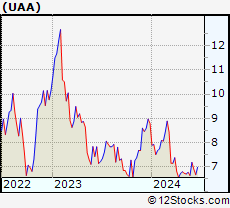 | UAA Under Armour, Inc. |
| Sector: Consumer Staples | |
| SubSector: Textile - Apparel Clothing | |
| MarketCap: 4066.75 Millions | |
| Recent Price: 6.78 Smart Investing & Trading Score: 18 | |
| Day Percent Change: 1.04% Day Change: 0.07 | |
| Week Change: 1.04% Year-to-date Change: -22.9% | |
| UAA Links: Profile News Message Board | |
| Charts:- Daily , Weekly | |
| Add UAA to Watchlist: View: Get Complete UAA Trend Analysis ➞ | |
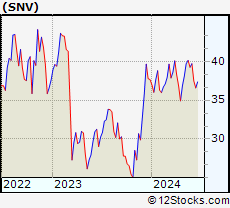 | SNV Synovus Financial Corp. |
| Sector: Financials | |
| SubSector: Regional - Mid-Atlantic Banks | |
| MarketCap: 2697.29 Millions | |
| Recent Price: 40.11 Smart Investing & Trading Score: 76 | |
| Day Percent Change: 1.11% Day Change: 0.44 | |
| Week Change: 1.03% Year-to-date Change: 6.5% | |
| SNV Links: Profile News Message Board | |
| Charts:- Daily , Weekly | |
| Add SNV to Watchlist: View: Get Complete SNV Trend Analysis ➞ | |
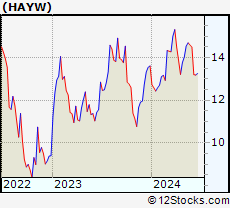 | HAYW Hayward Holdings, Inc. |
| Sector: Industrials | |
| SubSector: Electrical Equipment & Parts | |
| MarketCap: 2670 Millions | |
| Recent Price: 14.69 Smart Investing & Trading Score: 50 | |
| Day Percent Change: 0.07% Day Change: 0.01 | |
| Week Change: 1.03% Year-to-date Change: 7.9% | |
| HAYW Links: Profile News Message Board | |
| Charts:- Daily , Weekly | |
| Add HAYW to Watchlist: View: Get Complete HAYW Trend Analysis ➞ | |
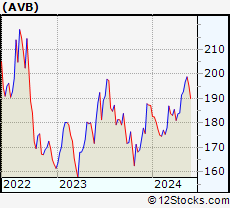 | AVB AvalonBay Communities, Inc. |
| Sector: Financials | |
| SubSector: REIT - Residential | |
| MarketCap: 19921.9 Millions | |
| Recent Price: 198.89 Smart Investing & Trading Score: 76 | |
| Day Percent Change: 0.42% Day Change: 0.84 | |
| Week Change: 1.02% Year-to-date Change: 6.2% | |
| AVB Links: Profile News Message Board | |
| Charts:- Daily , Weekly | |
| Add AVB to Watchlist: View: Get Complete AVB Trend Analysis ➞ | |
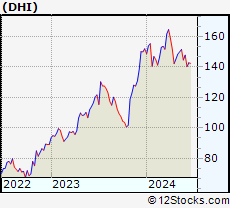 | DHI D.R. Horton, Inc. |
| Sector: Industrials | |
| SubSector: Residential Construction | |
| MarketCap: 13372.6 Millions | |
| Recent Price: 151.50 Smart Investing & Trading Score: 73 | |
| Day Percent Change: 0.35% Day Change: 0.53 | |
| Week Change: 1.02% Year-to-date Change: -0.3% | |
| DHI Links: Profile News Message Board | |
| Charts:- Daily , Weekly | |
| Add DHI to Watchlist: View: Get Complete DHI Trend Analysis ➞ | |
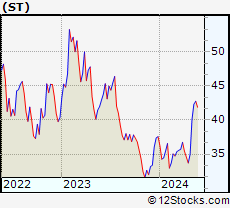 | ST Sensata Technologies Holding plc |
| Sector: Technology | |
| SubSector: Scientific & Technical Instruments | |
| MarketCap: 4434.23 Millions | |
| Recent Price: 42.77 Smart Investing & Trading Score: 76 | |
| Day Percent Change: 0.30% Day Change: 0.13 | |
| Week Change: 1.02% Year-to-date Change: 13.8% | |
| ST Links: Profile News Message Board | |
| Charts:- Daily , Weekly | |
| Add ST to Watchlist: View: Get Complete ST Trend Analysis ➞ | |
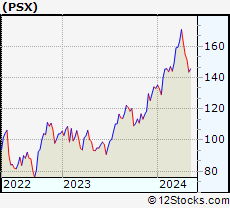 | PSX Phillips 66 |
| Sector: Energy | |
| SubSector: Oil & Gas Refining & Marketing | |
| MarketCap: 25253.6 Millions | |
| Recent Price: 147.08 Smart Investing & Trading Score: 58 | |
| Day Percent Change: 0.84% Day Change: 1.23 | |
| Week Change: 1.02% Year-to-date Change: 10.5% | |
| PSX Links: Profile News Message Board | |
| Charts:- Daily , Weekly | |
| Add PSX to Watchlist: View: Get Complete PSX Trend Analysis ➞ | |
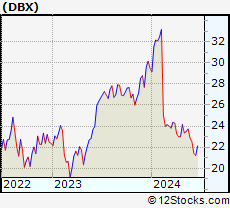 | DBX Dropbox, Inc. |
| Sector: Technology | |
| SubSector: Application Software | |
| MarketCap: 7588.32 Millions | |
| Recent Price: 23.73 Smart Investing & Trading Score: 17 | |
| Day Percent Change: -0.96% Day Change: -0.23 | |
| Week Change: 1.02% Year-to-date Change: -19.5% | |
| DBX Links: Profile News Message Board | |
| Charts:- Daily , Weekly | |
| Add DBX to Watchlist: View: Get Complete DBX Trend Analysis ➞ | |
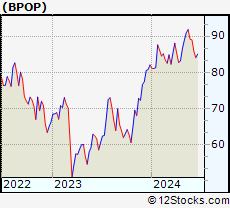 | BPOP Popular, Inc. |
| Sector: Financials | |
| SubSector: Foreign Regional Banks | |
| MarketCap: 2671.99 Millions | |
| Recent Price: 91.84 Smart Investing & Trading Score: 76 | |
| Day Percent Change: -0.79% Day Change: -0.73 | |
| Week Change: 1.01% Year-to-date Change: 11.9% | |
| BPOP Links: Profile News Message Board | |
| Charts:- Daily , Weekly | |
| Add BPOP to Watchlist: View: Get Complete BPOP Trend Analysis ➞ | |
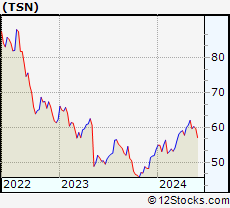 | TSN Tyson Foods, Inc. |
| Sector: Consumer Staples | |
| SubSector: Meat Products | |
| MarketCap: 22124.1 Millions | |
| Recent Price: 60.25 Smart Investing & Trading Score: 51 | |
| Day Percent Change: -1.12% Day Change: -0.68 | |
| Week Change: 1.01% Year-to-date Change: 12.1% | |
| TSN Links: Profile News Message Board | |
| Charts:- Daily , Weekly | |
| Add TSN to Watchlist: View: Get Complete TSN Trend Analysis ➞ | |
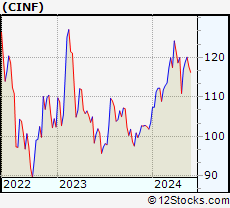 | CINF Cincinnati Financial Corporation |
| Sector: Financials | |
| SubSector: Property & Casualty Insurance | |
| MarketCap: 13637 Millions | |
| Recent Price: 120.06 Smart Investing & Trading Score: 100 | |
| Day Percent Change: 1.30% Day Change: 1.54 | |
| Week Change: 1% Year-to-date Change: 16.0% | |
| CINF Links: Profile News Message Board | |
| Charts:- Daily , Weekly | |
| Add CINF to Watchlist: View: Get Complete CINF Trend Analysis ➞ | |
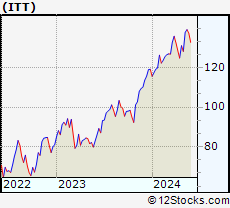 | ITT ITT Inc. |
| Sector: Industrials | |
| SubSector: Diversified Machinery | |
| MarketCap: 3783.06 Millions | |
| Recent Price: 139.36 Smart Investing & Trading Score: 78 | |
| Day Percent Change: 0.63% Day Change: 0.87 | |
| Week Change: 0.99% Year-to-date Change: 16.8% | |
| ITT Links: Profile News Message Board | |
| Charts:- Daily , Weekly | |
| Add ITT to Watchlist: View: Get Complete ITT Trend Analysis ➞ | |
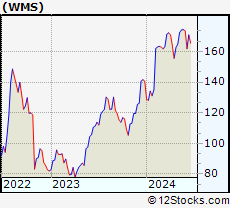 | WMS Advanced Drainage Systems, Inc. |
| Sector: Consumer Staples | |
| SubSector: Rubber & Plastics | |
| MarketCap: 2139.7 Millions | |
| Recent Price: 174.13 Smart Investing & Trading Score: 76 | |
| Day Percent Change: 0.98% Day Change: 1.69 | |
| Week Change: 0.98% Year-to-date Change: 23.8% | |
| WMS Links: Profile News Message Board | |
| Charts:- Daily , Weekly | |
| Add WMS to Watchlist: View: Get Complete WMS Trend Analysis ➞ | |
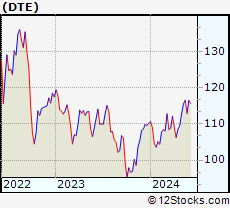 | DTE DTE Energy Company |
| Sector: Utilities | |
| SubSector: Electric Utilities | |
| MarketCap: 18218.1 Millions | |
| Recent Price: 116.60 Smart Investing & Trading Score: 90 | |
| Day Percent Change: -0.15% Day Change: -0.18 | |
| Week Change: 0.96% Year-to-date Change: 5.8% | |
| DTE Links: Profile News Message Board | |
| Charts:- Daily , Weekly | |
| Add DTE to Watchlist: View: Get Complete DTE Trend Analysis ➞ | |
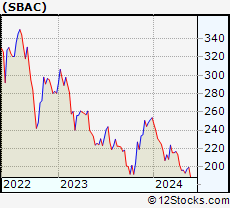 | SBAC SBA Communications Corporation |
| Sector: Technology | |
| SubSector: Diversified Communication Services | |
| MarketCap: 26712.3 Millions | |
| Recent Price: 199.38 Smart Investing & Trading Score: 50 | |
| Day Percent Change: -1.72% Day Change: -3.49 | |
| Week Change: 0.95% Year-to-date Change: -21.4% | |
| SBAC Links: Profile News Message Board | |
| Charts:- Daily , Weekly | |
| Add SBAC to Watchlist: View: Get Complete SBAC Trend Analysis ➞ | |
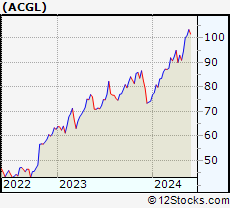 | ACGL Arch Capital Group Ltd. |
| Sector: Financials | |
| SubSector: Property & Casualty Insurance | |
| MarketCap: 12350.9 Millions | |
| Recent Price: 100.99 Smart Investing & Trading Score: 100 | |
| Day Percent Change: 2.20% Day Change: 2.17 | |
| Week Change: 0.94% Year-to-date Change: 36.0% | |
| ACGL Links: Profile News Message Board | |
| Charts:- Daily , Weekly | |
| Add ACGL to Watchlist: View: Get Complete ACGL Trend Analysis ➞ | |
| For tabular summary view of above stock list: Summary View ➞ 0 - 25 , 25 - 50 , 50 - 75 , 75 - 100 , 100 - 125 , 125 - 150 , 150 - 175 , 175 - 200 , 200 - 225 , 225 - 250 , 250 - 275 , 275 - 300 , 300 - 325 , 325 - 350 , 350 - 375 , 375 - 400 , 400 - 425 , 425 - 450 , 450 - 475 , 475 - 500 , 500 - 525 , 525 - 550 , 550 - 575 , 575 - 600 , 600 - 625 , 625 - 650 , 650 - 675 , 675 - 700 , 700 - 725 , 725 - 750 , 750 - 775 | ||
| Click To Change The Sort Order: By Market Cap or Company Size Performance: Year-to-date, Week and Day | |
| Select Chart Type: | ||
|
Best Stocks Today 12Stocks.com |
© 2024 12Stocks.com Terms & Conditions Privacy Contact Us
All Information Provided Only For Education And Not To Be Used For Investing or Trading. See Terms & Conditions


One More Thing ... Get Best Stocks Delivered Daily!
Never Ever Miss A Move With Our Top Ten Stocks Lists
Find Best Stocks In Any Market - Bull or Bear Market
Take A Peek At Our Top Ten Stocks Lists: Daily, Weekly, Year-to-Date & Top Trends
Find Best Stocks In Any Market - Bull or Bear Market
Take A Peek At Our Top Ten Stocks Lists: Daily, Weekly, Year-to-Date & Top Trends
Midcap Stocks With Best Up Trends [0-bearish to 100-bullish]: Robinhood Markets[100], SSR Mining[100], Littelfuse [100], Tractor Supply[100], DuPont de[100], Royal Gold[100], Alcoa [100], Range Resources[100], Arch Capital[100], Evercore [100], Prosperity Bancshares[100]
Best Midcap Stocks Year-to-Date:
Vistra Energy[144.24%], AppLovin [107.29%], Constellation Energy[81.97%], CAVA [77.74%], EMCOR [75.63%], ShockWave Medical[73.24%], Maravai LifeSciences[72.82%], Celsius [70.62%], Tenet [70%], Natera [69.96%], Pure Storage[65.87%] Best Midcap Stocks This Week:
AMC Entertainment[51.2%], Petco Health[50%], NovoCure [33.52%], GameStop [27.21%], Plug Power[26.95%], Robinhood Markets[23.78%], Doximity [19.94%], Ubiquiti [16.29%], Hawaiian Electric[15.12%], MP Materials[13.14%], Victorias Secret[13.12%] Best Midcap Stocks Daily:
Doximity [18.07%], Robinhood Markets[12.23%], Affirm [8.01%], SSR Mining[6.28%], Coinbase Global[4.23%], Littelfuse [4.13%], Rivian Automotive[3.65%], DoubleVerify [3.50%], Tractor Supply[3.42%], Iridium [3.42%], Ubiquiti [3.04%]