
 Login Sign Up


| |||||
 |  | ||||

| 12Stocks.com Market Intelligence |
Best MidCap Stocks
|
| In a hurry? Mid Cap Stocks Lists: Performance Trends Table, Stock Charts
Sort midcap stocks: Daily, Weekly, Year-to-Date, Market Cap & Trends. Filter midcap stocks list by sector: Show all, Tech, Finance, Energy, Staples, Retail, Industrial, Materials, Utilities and HealthCare Filter midcap stocks list by size:All MidCap Large Mid-Range Small |
| 12Stocks.com Mid Cap Stocks Performances & Trends Daily | |||||||||
|
|  The overall Smart Investing & Trading Score is 76 (0-bearish to 100-bullish) which puts Mid Cap index in short term neutral to bullish trend. The Smart Investing & Trading Score from previous trading session is 100 and a deterioration of trend continues.
| ||||||||
Here are the Smart Investing & Trading Scores of the most requested mid cap stocks at 12Stocks.com (click stock name for detailed review):
|


| 12Stocks.com: Top Performing Mid Cap Index Stocks | ||||||||||||||||||||||||||||||||||||||||||||||||
 The top performing Mid Cap Index stocks year to date are
Now, more recently, over last week, the top performing Mid Cap Index stocks on the move are


|
||||||||||||||||||||||||||||||||||||||||||||||||
| 12Stocks.com: Investing in Midcap Index with Stocks | |
|
The following table helps investors and traders sort through current performance and trends (as measured by Smart Investing & Trading Score) of various
stocks in the Midcap Index. Quick View: Move mouse or cursor over stock symbol (ticker) to view short-term technical chart and over stock name to view long term chart. Click on  to add stock symbol to your watchlist and to add stock symbol to your watchlist and  to view watchlist. Click on any ticker or stock name for detailed market intelligence report for that stock. to view watchlist. Click on any ticker or stock name for detailed market intelligence report for that stock. |
12Stocks.com Performance of Stocks in Midcap Index
| Ticker | Stock Name | Watchlist | Category | Recent Price | Smart Investing & Trading Score | Change % | Weekly Change% |
| EBAY | eBay |   | Services & Goods | 51.48 | 43 | -2.31% | 0.94% |
| TTC | Toro | | Industrials | 88.24 | 42 | -0.59% | 0.94% |
| SKX | Skechers U.S.A | | Consumer Staples | 68.42 | 68 | 0.25% | 0.94% |
| ETR | Entergy | | Utilities | 113.03 | 90 | -0.30% | 0.93% |
| TPG | TPG | | Financials | 42.89 | 15 | -1.31% | 0.92% |
| APO | Apollo Global | | Financials | 113.08 | 78 | 0.31% | 0.91% |
| TYL | Tyler Technologies | | Technology | 489.14 | 90 | 0.24% | 0.90% |
| ROIV | Roivant Sciences | | Health Care | 11.23 | 32 | -1.58% | 0.90% |
| RYAN | Ryan Specialty | | Financials | 54.19 | 90 | 0.06% | 0.89% |
| CUZ | Cousins Properties | | Financials | 23.82 | 68 | -0.38% | 0.85% |
| AVTR | Avantor | | Materials | 24.99 | 81 | 0.04% | 0.85% |
| EGP | East Properties | | Financials | 165.87 | 40 | -0.55% | 0.84% |
| CLH | Clean Harbors | | Industrials | 213.11 | 83 | 1.03% | 0.84% |
| MTD | Mettler-Toledo | | Health Care | 1522.75 | 90 | -0.51% | 0.83% |
| PINC | Premier | | Technology | 19.66 | 28 | -0.61% | 0.82% |
| LDOS | Leidos | | Technology | 148.67 | 83 | 0.75% | 0.81% |
| DDOG | Datadog | | Technology | 120.07 | 25 | -0.45% | 0.77% |
| PNR | Pentair | | Industrials | 83.95 | 78 | 0.43% | 0.76% |
| QRVO | Qorvo | | Technology | 98.43 | 25 | -1.09% | 0.76% |
| CNA | CNA Financial | | Financials | 45.28 | 100 | 0.56% | 0.73% |
| HCP | HashiCorp | | Technology | 33.04 | 78 | 0.33% | 0.73% |
| SPG | Simon Property | | Financials | 148.79 | 58 | 0.09% | 0.72% |
| PEG | Public Service | | Utilities | 74.54 | 83 | 0.43% | 0.72% |
| M | Macy s | | Services & Goods | 19.49 | 75 | -0.66% | 0.72% |
| FR | First Industrial | | Financials | 48.06 | 40 | -0.37% | 0.71% |
| For chart view version of above stock list: Chart View ➞ 0 - 25 , 25 - 50 , 50 - 75 , 75 - 100 , 100 - 125 , 125 - 150 , 150 - 175 , 175 - 200 , 200 - 225 , 225 - 250 , 250 - 275 , 275 - 300 , 300 - 325 , 325 - 350 , 350 - 375 , 375 - 400 , 400 - 425 , 425 - 450 , 450 - 475 , 475 - 500 , 500 - 525 , 525 - 550 , 550 - 575 , 575 - 600 , 600 - 625 , 625 - 650 , 650 - 675 , 675 - 700 , 700 - 725 , 725 - 750 , 750 - 775 | ||
 | Click To Change The Sort Order: By Market Cap or Company Size Performance: Year-to-date, Week and Day |  |
|
Get the most comprehensive stock market coverage daily at 12Stocks.com ➞ Best Stocks Today ➞ Best Stocks Weekly ➞ Best Stocks Year-to-Date ➞ Best Stocks Trends ➞  Best Stocks Today 12Stocks.com Best Nasdaq Stocks ➞ Best S&P 500 Stocks ➞ Best Tech Stocks ➞ Best Biotech Stocks ➞ |
| Detailed Overview of Midcap Stocks |
| Midcap Technical Overview, Leaders & Laggards, Top Midcap ETF Funds & Detailed Midcap Stocks List, Charts, Trends & More |
| Midcap: Technical Analysis, Trends & YTD Performance | |
| MidCap segment as represented by
MDY, an exchange-traded fund [ETF], holds basket of about four hundred midcap stocks from across all major sectors of the US stock market. The midcap index (contains stocks like Green Mountain Coffee Roasters and Tractor Supply Company) is up by 8.73% and is currently underperforming the overall market by -1.84% year-to-date. Below is a quick view of technical charts and trends: | |
 MDY Weekly Chart |
|
| Long Term Trend: Very Good | |
| Medium Term Trend: Very Good | |
 MDY Daily Chart |
|
| Short Term Trend: Not Good | |
| Overall Trend Score: 76 | |
| YTD Performance: 8.73% | |
| **Trend Scores & Views Are Only For Educational Purposes And Not For Investing | |
| 12Stocks.com: Investing in Midcap Index using Exchange Traded Funds | |
|
The following table shows list of key exchange traded funds (ETF) that
help investors track Midcap index. The following list also includes leveraged ETF funds that track twice or thrice the daily returns of Midcap indices. Short or inverse ETF funds move in the opposite direction to the index they track and are useful during market pullbacks or during bear markets. Quick View: Move mouse or cursor over ETF symbol (ticker) to view short-term technical chart and over ETF name to view long term chart. Click on ticker or stock name for detailed view. Click on to add stock symbol to your watchlist and to view watchlist. |
12Stocks.com List of ETFs that track Midcap Index
| Ticker | ETF Name | Watchlist | Recent Price | Smart Investing & Trading Score | Change % | Week % | Year-to-date % |
| IJH | iShares Core S&P Mid-Cap | | 60.31 | 68 | -0.46 | 0.84 | 8.8% |
| MDY | SPDR S&P MidCap 400 ETF | | 551.69 | 76 | 0.11 | 0.84 | 8.73% |
| IWR | iShares Russell Mid-Cap | | 83.29 | 76 | -0.28 | 1.07 | 7.15% |
| IWP | iShares Russell Mid-Cap Growth | | 112.01 | 70 | -0.29 | 1.53 | 7.23% |
| IWS | iShares Russell Mid-Cap Value | | 124.51 | 76 | -0.34 | 0.92 | 7.07% |
| IJK | iShares S&P Mid-Cap 400 Growth | | 90.28 | 71 | -0.05 | 0.39 | 13.96% |
| IJJ | iShares S&P Mid-Cap 400 Value | | 117.71 | 76 | -0.16 | 1.26 | 3.22% |
| MVV | ProShares Ultra MidCap400 | | 66.42 | 76 | 0.02 | 1.65 | 14.74% |
| XMLV | PowerShares S&P MidCap Low Volatil ETF | | 56.93 | 76 | -0.02 | 0.42 | 7.05% |
| UMDD | ProShares UltraPro MidCap400 | | 26.83 | 76 | -0.58 | 1.98 | 20.21% |
| SMDD | ProShares UltraPro Short MidCap400 | | 10.48 | 25 | 0.73 | -1.92 | -22.18% |
| MYY | ProShares Short MidCap400 | | 20.00 | 25 | 0.60 | -0.61 | -6.78% |
| MZZ | ProShares UltraShort MidCap400 | | 10.81 | 27 | 0.49 | -1.25 | -13.98% |
| 12Stocks.com: Charts, Trends, Fundamental Data and Performances of MidCap Stocks | |
|
We now take in-depth look at all MidCap stocks including charts, multi-period performances and overall trends (as measured by Smart Investing & Trading Score). One can sort MidCap stocks (click link to choose) by Daily, Weekly and by Year-to-Date performances. Also, one can sort by size of the company or by market capitalization. |
| Select Your Default Chart Type: | |||||
| |||||
| Click on stock symbol or name for detailed view. Click on to add stock symbol to your watchlist and to view watchlist. Quick View: Move mouse or cursor over "Daily" to quickly view daily technical stock chart and over "Weekly" to view weekly technical stock chart. | |||||

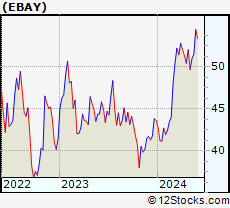 | EBAY eBay Inc. |
| Sector: Services & Goods | |
| SubSector: Specialty Retail, Other | |
| MarketCap: 23152.3 Millions | |
| Recent Price: 51.48 Smart Investing & Trading Score: 43 | |
| Day Percent Change: -2.31% Day Change: -1.22 | |
| Week Change: 0.94% Year-to-date Change: 18.0% | |
| EBAY Links: Profile News Message Board | |
| Charts:- Daily , Weekly | |
| Add EBAY to Watchlist: View: Get Complete EBAY Trend Analysis ➞ | |
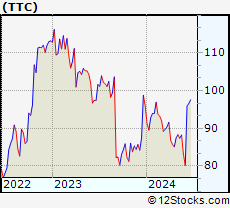 | TTC The Toro Company |
| Sector: Industrials | |
| SubSector: Small Tools & Accessories | |
| MarketCap: 6426.96 Millions | |
| Recent Price: 88.24 Smart Investing & Trading Score: 42 | |
| Day Percent Change: -0.59% Day Change: -0.52 | |
| Week Change: 0.94% Year-to-date Change: -8.1% | |
| TTC Links: Profile News Message Board | |
| Charts:- Daily , Weekly | |
| Add TTC to Watchlist: View: Get Complete TTC Trend Analysis ➞ | |
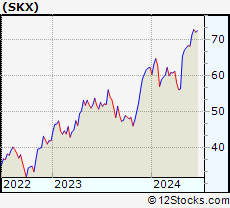 | SKX Skechers U.S.A., Inc. |
| Sector: Consumer Staples | |
| SubSector: Textile - Apparel Footwear & Accessories | |
| MarketCap: 3620.1 Millions | |
| Recent Price: 68.42 Smart Investing & Trading Score: 68 | |
| Day Percent Change: 0.25% Day Change: 0.17 | |
| Week Change: 0.94% Year-to-date Change: 9.8% | |
| SKX Links: Profile News Message Board | |
| Charts:- Daily , Weekly | |
| Add SKX to Watchlist: View: Get Complete SKX Trend Analysis ➞ | |
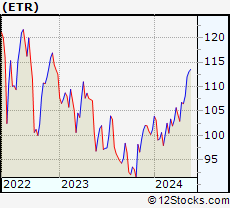 | ETR Entergy Corporation |
| Sector: Utilities | |
| SubSector: Electric Utilities | |
| MarketCap: 17545 Millions | |
| Recent Price: 113.03 Smart Investing & Trading Score: 90 | |
| Day Percent Change: -0.30% Day Change: -0.34 | |
| Week Change: 0.93% Year-to-date Change: 11.7% | |
| ETR Links: Profile News Message Board | |
| Charts:- Daily , Weekly | |
| Add ETR to Watchlist: View: Get Complete ETR Trend Analysis ➞ | |
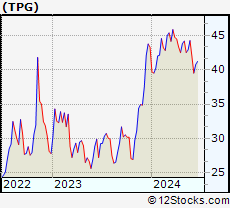 | TPG TPG Inc. |
| Sector: Financials | |
| SubSector: Asset Management | |
| MarketCap: 8700 Millions | |
| Recent Price: 42.89 Smart Investing & Trading Score: 15 | |
| Day Percent Change: -1.31% Day Change: -0.57 | |
| Week Change: 0.92% Year-to-date Change: -0.9% | |
| TPG Links: Profile News Message Board | |
| Charts:- Daily , Weekly | |
| Add TPG to Watchlist: View: Get Complete TPG Trend Analysis ➞ | |
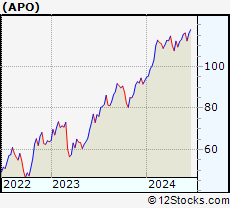 | APO Apollo Global Management, Inc. |
| Sector: Financials | |
| SubSector: Diversified Investments | |
| MarketCap: 12706 Millions | |
| Recent Price: 113.08 Smart Investing & Trading Score: 78 | |
| Day Percent Change: 0.31% Day Change: 0.35 | |
| Week Change: 0.91% Year-to-date Change: 21.3% | |
| APO Links: Profile News Message Board | |
| Charts:- Daily , Weekly | |
| Add APO to Watchlist: View: Get Complete APO Trend Analysis ➞ | |
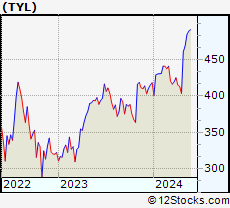 | TYL Tyler Technologies, Inc. |
| Sector: Technology | |
| SubSector: Technical & System Software | |
| MarketCap: 10785 Millions | |
| Recent Price: 489.14 Smart Investing & Trading Score: 90 | |
| Day Percent Change: 0.24% Day Change: 1.17 | |
| Week Change: 0.9% Year-to-date Change: 17.0% | |
| TYL Links: Profile News Message Board | |
| Charts:- Daily , Weekly | |
| Add TYL to Watchlist: View: Get Complete TYL Trend Analysis ➞ | |
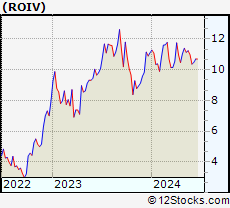 | ROIV Roivant Sciences Ltd. |
| Sector: Health Care | |
| SubSector: Biotechnology | |
| MarketCap: 7780 Millions | |
| Recent Price: 11.23 Smart Investing & Trading Score: 32 | |
| Day Percent Change: -1.58% Day Change: -0.18 | |
| Week Change: 0.9% Year-to-date Change: 1.1% | |
| ROIV Links: Profile News Message Board | |
| Charts:- Daily , Weekly | |
| Add ROIV to Watchlist: View: Get Complete ROIV Trend Analysis ➞ | |
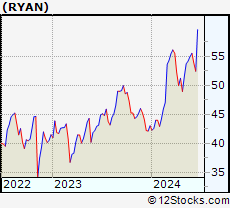 | RYAN Ryan Specialty Holdings, Inc. |
| Sector: Financials | |
| SubSector: Insurance - Specialty | |
| MarketCap: 11630 Millions | |
| Recent Price: 54.19 Smart Investing & Trading Score: 90 | |
| Day Percent Change: 0.06% Day Change: 0.03 | |
| Week Change: 0.89% Year-to-date Change: 25.9% | |
| RYAN Links: Profile News Message Board | |
| Charts:- Daily , Weekly | |
| Add RYAN to Watchlist: View: Get Complete RYAN Trend Analysis ➞ | |
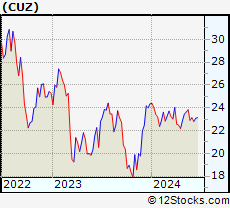 | CUZ Cousins Properties Incorporated |
| Sector: Financials | |
| SubSector: REIT - Diversified | |
| MarketCap: 3828.13 Millions | |
| Recent Price: 23.82 Smart Investing & Trading Score: 68 | |
| Day Percent Change: -0.38% Day Change: -0.09 | |
| Week Change: 0.85% Year-to-date Change: -2.2% | |
| CUZ Links: Profile News Message Board | |
| Charts:- Daily , Weekly | |
| Add CUZ to Watchlist: View: Get Complete CUZ Trend Analysis ➞ | |
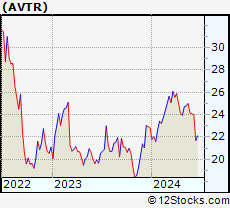 | AVTR Avantor, Inc. |
| Sector: Materials | |
| SubSector: Specialty Chemicals | |
| MarketCap: 6954 Millions | |
| Recent Price: 24.99 Smart Investing & Trading Score: 81 | |
| Day Percent Change: 0.04% Day Change: 0.01 | |
| Week Change: 0.85% Year-to-date Change: 9.5% | |
| AVTR Links: Profile News Message Board | |
| Charts:- Daily , Weekly | |
| Add AVTR to Watchlist: View: Get Complete AVTR Trend Analysis ➞ | |
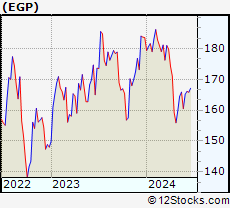 | EGP EastGroup Properties, Inc. |
| Sector: Financials | |
| SubSector: REIT - Industrial | |
| MarketCap: 4034.29 Millions | |
| Recent Price: 165.87 Smart Investing & Trading Score: 40 | |
| Day Percent Change: -0.55% Day Change: -0.92 | |
| Week Change: 0.84% Year-to-date Change: -9.6% | |
| EGP Links: Profile News Message Board | |
| Charts:- Daily , Weekly | |
| Add EGP to Watchlist: View: Get Complete EGP Trend Analysis ➞ | |
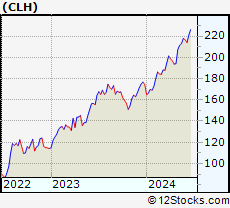 | CLH Clean Harbors, Inc. |
| Sector: Industrials | |
| SubSector: Waste Management | |
| MarketCap: 2391.28 Millions | |
| Recent Price: 213.11 Smart Investing & Trading Score: 83 | |
| Day Percent Change: 1.03% Day Change: 2.18 | |
| Week Change: 0.84% Year-to-date Change: 22.1% | |
| CLH Links: Profile News Message Board | |
| Charts:- Daily , Weekly | |
| Add CLH to Watchlist: View: Get Complete CLH Trend Analysis ➞ | |
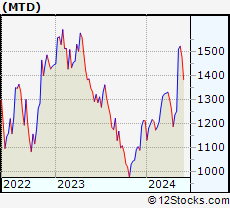 | MTD Mettler-Toledo International Inc. |
| Sector: Health Care | |
| SubSector: Medical Instruments & Supplies | |
| MarketCap: 15973.1 Millions | |
| Recent Price: 1522.75 Smart Investing & Trading Score: 90 | |
| Day Percent Change: -0.51% Day Change: -7.80 | |
| Week Change: 0.83% Year-to-date Change: 25.5% | |
| MTD Links: Profile News Message Board | |
| Charts:- Daily , Weekly | |
| Add MTD to Watchlist: View: Get Complete MTD Trend Analysis ➞ | |
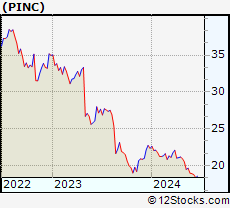 | PINC Premier, Inc. |
| Sector: Technology | |
| SubSector: Healthcare Information Services | |
| MarketCap: 2044.85 Millions | |
| Recent Price: 19.66 Smart Investing & Trading Score: 28 | |
| Day Percent Change: -0.61% Day Change: -0.12 | |
| Week Change: 0.82% Year-to-date Change: -12.1% | |
| PINC Links: Profile News Message Board | |
| Charts:- Daily , Weekly | |
| Add PINC to Watchlist: View: Get Complete PINC Trend Analysis ➞ | |
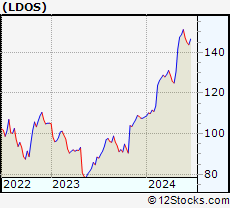 | LDOS Leidos Holdings, Inc. |
| Sector: Technology | |
| SubSector: Information Technology Services | |
| MarketCap: 11707.5 Millions | |
| Recent Price: 148.67 Smart Investing & Trading Score: 83 | |
| Day Percent Change: 0.75% Day Change: 1.11 | |
| Week Change: 0.81% Year-to-date Change: 37.4% | |
| LDOS Links: Profile News Message Board | |
| Charts:- Daily , Weekly | |
| Add LDOS to Watchlist: View: Get Complete LDOS Trend Analysis ➞ | |
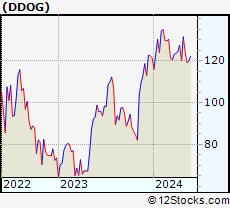 | DDOG Datadog, Inc. |
| Sector: Technology | |
| SubSector: Application Software | |
| MarketCap: 10653.2 Millions | |
| Recent Price: 120.07 Smart Investing & Trading Score: 25 | |
| Day Percent Change: -0.45% Day Change: -0.54 | |
| Week Change: 0.77% Year-to-date Change: -1.1% | |
| DDOG Links: Profile News Message Board | |
| Charts:- Daily , Weekly | |
| Add DDOG to Watchlist: View: Get Complete DDOG Trend Analysis ➞ | |
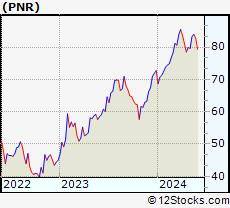 | PNR Pentair plc |
| Sector: Industrials | |
| SubSector: Industrial Equipment & Components | |
| MarketCap: 4326.59 Millions | |
| Recent Price: 83.95 Smart Investing & Trading Score: 78 | |
| Day Percent Change: 0.43% Day Change: 0.36 | |
| Week Change: 0.76% Year-to-date Change: 15.5% | |
| PNR Links: Profile News Message Board | |
| Charts:- Daily , Weekly | |
| Add PNR to Watchlist: View: Get Complete PNR Trend Analysis ➞ | |
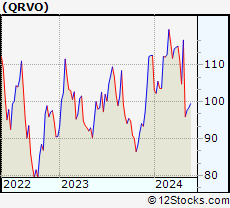 | QRVO Qorvo, Inc. |
| Sector: Technology | |
| SubSector: Semiconductor - Broad Line | |
| MarketCap: 9524.32 Millions | |
| Recent Price: 98.43 Smart Investing & Trading Score: 25 | |
| Day Percent Change: -1.09% Day Change: -1.08 | |
| Week Change: 0.76% Year-to-date Change: -12.6% | |
| QRVO Links: Profile News Message Board | |
| Charts:- Daily , Weekly | |
| Add QRVO to Watchlist: View: Get Complete QRVO Trend Analysis ➞ | |
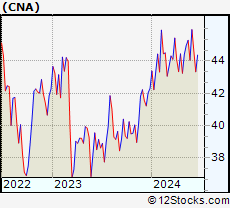 | CNA CNA Financial Corporation |
| Sector: Financials | |
| SubSector: Property & Casualty Insurance | |
| MarketCap: 9123.32 Millions | |
| Recent Price: 45.28 Smart Investing & Trading Score: 100 | |
| Day Percent Change: 0.56% Day Change: 0.25 | |
| Week Change: 0.73% Year-to-date Change: 7.0% | |
| CNA Links: Profile News Message Board | |
| Charts:- Daily , Weekly | |
| Add CNA to Watchlist: View: Get Complete CNA Trend Analysis ➞ | |
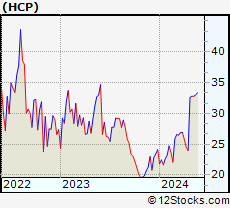 | HCP HashiCorp, Inc. |
| Sector: Technology | |
| SubSector: Software - Infrastructure | |
| MarketCap: 5070 Millions | |
| Recent Price: 33.04 Smart Investing & Trading Score: 78 | |
| Day Percent Change: 0.33% Day Change: 0.11 | |
| Week Change: 0.73% Year-to-date Change: 37.0% | |
| HCP Links: Profile News Message Board | |
| Charts:- Daily , Weekly | |
| Add HCP to Watchlist: View: Get Complete HCP Trend Analysis ➞ | |
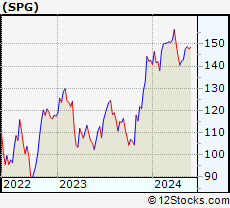 | SPG Simon Property Group, Inc. |
| Sector: Financials | |
| SubSector: REIT - Retail | |
| MarketCap: 17959.6 Millions | |
| Recent Price: 148.79 Smart Investing & Trading Score: 58 | |
| Day Percent Change: 0.09% Day Change: 0.13 | |
| Week Change: 0.72% Year-to-date Change: 4.3% | |
| SPG Links: Profile News Message Board | |
| Charts:- Daily , Weekly | |
| Add SPG to Watchlist: View: Get Complete SPG Trend Analysis ➞ | |
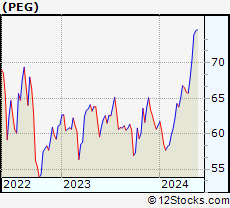 | PEG Public Service Enterprise Group Incorporated |
| Sector: Utilities | |
| SubSector: Diversified Utilities | |
| MarketCap: 20886 Millions | |
| Recent Price: 74.54 Smart Investing & Trading Score: 83 | |
| Day Percent Change: 0.43% Day Change: 0.32 | |
| Week Change: 0.72% Year-to-date Change: 21.9% | |
| PEG Links: Profile News Message Board | |
| Charts:- Daily , Weekly | |
| Add PEG to Watchlist: View: Get Complete PEG Trend Analysis ➞ | |
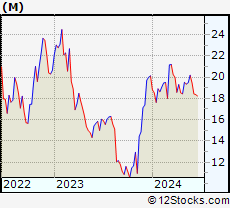 | M Macy s, Inc. |
| Sector: Services & Goods | |
| SubSector: Department Stores | |
| MarketCap: 2391.72 Millions | |
| Recent Price: 19.49 Smart Investing & Trading Score: 75 | |
| Day Percent Change: -0.66% Day Change: -0.13 | |
| Week Change: 0.72% Year-to-date Change: -3.1% | |
| M Links: Profile News Message Board | |
| Charts:- Daily , Weekly | |
| Add M to Watchlist: View: Get Complete M Trend Analysis ➞ | |
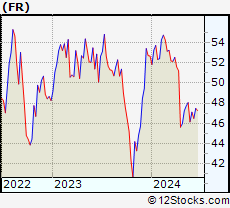 | FR First Industrial Realty Trust, Inc. |
| Sector: Financials | |
| SubSector: REIT - Industrial | |
| MarketCap: 3883.39 Millions | |
| Recent Price: 48.06 Smart Investing & Trading Score: 40 | |
| Day Percent Change: -0.37% Day Change: -0.18 | |
| Week Change: 0.71% Year-to-date Change: -8.8% | |
| FR Links: Profile News Message Board | |
| Charts:- Daily , Weekly | |
| Add FR to Watchlist: View: Get Complete FR Trend Analysis ➞ | |
| For tabular summary view of above stock list: Summary View ➞ 0 - 25 , 25 - 50 , 50 - 75 , 75 - 100 , 100 - 125 , 125 - 150 , 150 - 175 , 175 - 200 , 200 - 225 , 225 - 250 , 250 - 275 , 275 - 300 , 300 - 325 , 325 - 350 , 350 - 375 , 375 - 400 , 400 - 425 , 425 - 450 , 450 - 475 , 475 - 500 , 500 - 525 , 525 - 550 , 550 - 575 , 575 - 600 , 600 - 625 , 625 - 650 , 650 - 675 , 675 - 700 , 700 - 725 , 725 - 750 , 750 - 775 | ||
| Click To Change The Sort Order: By Market Cap or Company Size Performance: Year-to-date, Week and Day | |
| Select Chart Type: | ||
|
Best Stocks Today 12Stocks.com |
© 2024 12Stocks.com Terms & Conditions Privacy Contact Us
All Information Provided Only For Education And Not To Be Used For Investing or Trading. See Terms & Conditions


One More Thing ... Get Best Stocks Delivered Daily!
Never Ever Miss A Move With Our Top Ten Stocks Lists
Find Best Stocks In Any Market - Bull or Bear Market
Take A Peek At Our Top Ten Stocks Lists: Daily, Weekly, Year-to-Date & Top Trends
Find Best Stocks In Any Market - Bull or Bear Market
Take A Peek At Our Top Ten Stocks Lists: Daily, Weekly, Year-to-Date & Top Trends
Midcap Stocks With Best Up Trends [0-bearish to 100-bullish]: Robinhood Markets[100], SSR Mining[100], Littelfuse [100], Tractor Supply[100], DuPont de[100], Royal Gold[100], Alcoa [100], Range Resources[100], Arch Capital[100], Evercore [100], Prosperity Bancshares[100]
Best Midcap Stocks Year-to-Date:
Vistra Energy[144.24%], AppLovin [107.29%], Constellation Energy[81.97%], CAVA [77.74%], EMCOR [75.63%], ShockWave Medical[73.24%], Maravai LifeSciences[72.82%], Celsius [70.62%], Tenet [70%], Natera [69.96%], Pure Storage[65.87%] Best Midcap Stocks This Week:
AMC Entertainment[51.2%], Petco Health[50%], NovoCure [33.52%], GameStop [27.21%], Plug Power[26.95%], Robinhood Markets[23.78%], Doximity [19.94%], Ubiquiti [16.29%], Hawaiian Electric[15.12%], MP Materials[13.14%], Victorias Secret[13.12%] Best Midcap Stocks Daily:
Doximity [18.07%], Robinhood Markets[12.23%], Affirm [8.01%], SSR Mining[6.28%], Coinbase Global[4.23%], Littelfuse [4.13%], Rivian Automotive[3.65%], DoubleVerify [3.50%], Tractor Supply[3.42%], Iridium [3.42%], Ubiquiti [3.04%]