
 Login Sign Up


| |||||
 |  | ||||

| 12Stocks.com Market Intelligence |
Best MidCap Stocks
|
| In a hurry? Mid Cap Stocks Lists: Performance Trends Table, Stock Charts
Sort midcap stocks: Daily, Weekly, Year-to-Date, Market Cap & Trends. Filter midcap stocks list by sector: Show all, Tech, Finance, Energy, Staples, Retail, Industrial, Materials, Utilities and HealthCare Filter midcap stocks list by size:All MidCap Large Mid-Range Small |
| 12Stocks.com Mid Cap Stocks Performances & Trends Daily | |||||||||
|
|  The overall Smart Investing & Trading Score is 76 (0-bearish to 100-bullish) which puts Mid Cap index in short term neutral to bullish trend. The Smart Investing & Trading Score from previous trading session is 100 and a deterioration of trend continues.
| ||||||||
Here are the Smart Investing & Trading Scores of the most requested mid cap stocks at 12Stocks.com (click stock name for detailed review):
|


| 12Stocks.com: Top Performing Mid Cap Index Stocks | ||||||||||||||||||||||||||||||||||||||||||||||||
 The top performing Mid Cap Index stocks year to date are
Now, more recently, over last week, the top performing Mid Cap Index stocks on the move are


|
||||||||||||||||||||||||||||||||||||||||||||||||
| 12Stocks.com: Investing in Midcap Index with Stocks | |
|
The following table helps investors and traders sort through current performance and trends (as measured by Smart Investing & Trading Score) of various
stocks in the Midcap Index. Quick View: Move mouse or cursor over stock symbol (ticker) to view short-term technical chart and over stock name to view long term chart. Click on  to add stock symbol to your watchlist and to add stock symbol to your watchlist and  to view watchlist. Click on any ticker or stock name for detailed market intelligence report for that stock. to view watchlist. Click on any ticker or stock name for detailed market intelligence report for that stock. |
12Stocks.com Performance of Stocks in Midcap Index
| Ticker | Stock Name | Watchlist | Category | Recent Price | Smart Investing & Trading Score | Change % | Weekly Change% |
| QDEL | Quidel |   | Health Care | 42.82 | 42 | -2.66% | 0.49% |
| COLB | Columbia Banking | | Financials | 20.42 | 75 | 0.39% | 0.49% |
| ILMN | Illumina | | Health Care | 111.07 | 7 | -2.96% | 0.49% |
| RLI | RLI | | Financials | 148.77 | 100 | 0.89% | 0.48% |
| EA | Electronic Arts | | Technology | 127.75 | 33 | -1.09% | 0.48% |
| MORN | Morningstar | | Technology | 299.77 | 58 | -0.07% | 0.47% |
| MHK | Mohawk Industries | | Consumer Staples | 120.36 | 63 | -0.42% | 0.46% |
| AEE | Ameren | | Utilities | 74.74 | 71 | -0.21% | 0.46% |
| HST | Host Hotels | | Financials | 18.42 | 18 | -1.76% | 0.44% |
| RL | Ralph Lauren | | Consumer Staples | 167.88 | 57 | 1.08% | 0.44% |
| WYNN | Wynn Resorts | | Services & Goods | 96.79 | 32 | -0.33% | 0.41% |
| CE | Celanese | | Materials | 157.34 | 51 | 1.07% | 0.41% |
| IPGP | IPG Photonics | | Technology | 88.61 | 61 | 0.01% | 0.40% |
| CTRA | Contura Energy | | Materials | 28.19 | 68 | 0.64% | 0.39% |
| FTV | Fortive | | Technology | 77.16 | 45 | -0.22% | 0.36% |
| FNB | F.N.B | | Financials | 14.15 | 76 | 0.71% | 0.35% |
| AL | Air Lease | | Transports | 49.27 | 54 | -0.30% | 0.35% |
| CW | Curtiss-Wright | | Industrials | 278.21 | 90 | 0.59% | 0.32% |
| OMC | Omnicom | | Services & Goods | 96.13 | 63 | -0.54% | 0.32% |
| AVY | Avery Dennison | | Consumer Staples | 226.30 | 76 | 0.77% | 0.31% |
| SWK | Stanley Black | | Industrials | 90.12 | 51 | 0.37% | 0.31% |
| TREX | Trex | | Industrials | 87.65 | 7 | -1.13% | 0.31% |
| AIRC | Apartment ome | | Financials | 38.72 | 83 | 0.16% | 0.31% |
| EWBC | East West | | Financials | 77.41 | 71 | 0.08% | 0.27% |
| NVST | Envista | | Health Care | 18.53 | 10 | -3.14% | 0.27% |
| For chart view version of above stock list: Chart View ➞ 0 - 25 , 25 - 50 , 50 - 75 , 75 - 100 , 100 - 125 , 125 - 150 , 150 - 175 , 175 - 200 , 200 - 225 , 225 - 250 , 250 - 275 , 275 - 300 , 300 - 325 , 325 - 350 , 350 - 375 , 375 - 400 , 400 - 425 , 425 - 450 , 450 - 475 , 475 - 500 , 500 - 525 , 525 - 550 , 550 - 575 , 575 - 600 , 600 - 625 , 625 - 650 , 650 - 675 , 675 - 700 , 700 - 725 , 725 - 750 , 750 - 775 | ||
 | Click To Change The Sort Order: By Market Cap or Company Size Performance: Year-to-date, Week and Day |  |
|
Get the most comprehensive stock market coverage daily at 12Stocks.com ➞ Best Stocks Today ➞ Best Stocks Weekly ➞ Best Stocks Year-to-Date ➞ Best Stocks Trends ➞  Best Stocks Today 12Stocks.com Best Nasdaq Stocks ➞ Best S&P 500 Stocks ➞ Best Tech Stocks ➞ Best Biotech Stocks ➞ |
| Detailed Overview of Midcap Stocks |
| Midcap Technical Overview, Leaders & Laggards, Top Midcap ETF Funds & Detailed Midcap Stocks List, Charts, Trends & More |
| Midcap: Technical Analysis, Trends & YTD Performance | |
| MidCap segment as represented by
MDY, an exchange-traded fund [ETF], holds basket of about four hundred midcap stocks from across all major sectors of the US stock market. The midcap index (contains stocks like Green Mountain Coffee Roasters and Tractor Supply Company) is up by 8.73% and is currently underperforming the overall market by -1.84% year-to-date. Below is a quick view of technical charts and trends: | |
 MDY Weekly Chart |
|
| Long Term Trend: Very Good | |
| Medium Term Trend: Very Good | |
 MDY Daily Chart |
|
| Short Term Trend: Not Good | |
| Overall Trend Score: 76 | |
| YTD Performance: 8.73% | |
| **Trend Scores & Views Are Only For Educational Purposes And Not For Investing | |
| 12Stocks.com: Investing in Midcap Index using Exchange Traded Funds | |
|
The following table shows list of key exchange traded funds (ETF) that
help investors track Midcap index. The following list also includes leveraged ETF funds that track twice or thrice the daily returns of Midcap indices. Short or inverse ETF funds move in the opposite direction to the index they track and are useful during market pullbacks or during bear markets. Quick View: Move mouse or cursor over ETF symbol (ticker) to view short-term technical chart and over ETF name to view long term chart. Click on ticker or stock name for detailed view. Click on to add stock symbol to your watchlist and to view watchlist. |
12Stocks.com List of ETFs that track Midcap Index
| Ticker | ETF Name | Watchlist | Recent Price | Smart Investing & Trading Score | Change % | Week % | Year-to-date % |
| IJH | iShares Core S&P Mid-Cap | | 60.31 | 68 | -0.46 | 0.84 | 8.8% |
| MDY | SPDR S&P MidCap 400 ETF | | 551.69 | 76 | 0.11 | 0.84 | 8.73% |
| IWR | iShares Russell Mid-Cap | | 83.29 | 76 | -0.28 | 1.07 | 7.15% |
| IWP | iShares Russell Mid-Cap Growth | | 112.01 | 70 | -0.29 | 1.53 | 7.23% |
| IWS | iShares Russell Mid-Cap Value | | 124.51 | 76 | -0.34 | 0.92 | 7.07% |
| IJK | iShares S&P Mid-Cap 400 Growth | | 90.28 | 71 | -0.05 | 0.39 | 13.96% |
| IJJ | iShares S&P Mid-Cap 400 Value | | 117.71 | 76 | -0.16 | 1.26 | 3.22% |
| MVV | ProShares Ultra MidCap400 | | 66.42 | 76 | 0.02 | 1.65 | 14.74% |
| XMLV | PowerShares S&P MidCap Low Volatil ETF | | 56.93 | 76 | -0.02 | 0.42 | 7.05% |
| UMDD | ProShares UltraPro MidCap400 | | 26.83 | 76 | -0.58 | 1.98 | 20.21% |
| SMDD | ProShares UltraPro Short MidCap400 | | 10.48 | 25 | 0.73 | -1.92 | -22.18% |
| MYY | ProShares Short MidCap400 | | 20.00 | 25 | 0.60 | -0.61 | -6.78% |
| MZZ | ProShares UltraShort MidCap400 | | 10.81 | 27 | 0.49 | -1.25 | -13.98% |
| 12Stocks.com: Charts, Trends, Fundamental Data and Performances of MidCap Stocks | |
|
We now take in-depth look at all MidCap stocks including charts, multi-period performances and overall trends (as measured by Smart Investing & Trading Score). One can sort MidCap stocks (click link to choose) by Daily, Weekly and by Year-to-Date performances. Also, one can sort by size of the company or by market capitalization. |
| Select Your Default Chart Type: | |||||
| |||||
| Click on stock symbol or name for detailed view. Click on to add stock symbol to your watchlist and to view watchlist. Quick View: Move mouse or cursor over "Daily" to quickly view daily technical stock chart and over "Weekly" to view weekly technical stock chart. | |||||

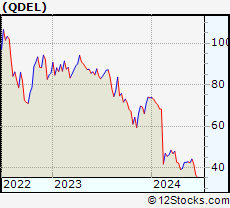 | QDEL Quidel Corporation |
| Sector: Health Care | |
| SubSector: Diagnostic Substances | |
| MarketCap: 4104.91 Millions | |
| Recent Price: 42.82 Smart Investing & Trading Score: 42 | |
| Day Percent Change: -2.66% Day Change: -1.17 | |
| Week Change: 0.49% Year-to-date Change: -41.9% | |
| QDEL Links: Profile News Message Board | |
| Charts:- Daily , Weekly | |
| Add QDEL to Watchlist: View: Get Complete QDEL Trend Analysis ➞ | |
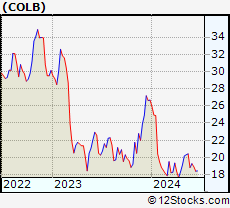 | COLB Columbia Banking System, Inc. |
| Sector: Financials | |
| SubSector: Savings & Loans | |
| MarketCap: 1868.3 Millions | |
| Recent Price: 20.42 Smart Investing & Trading Score: 75 | |
| Day Percent Change: 0.39% Day Change: 0.08 | |
| Week Change: 0.49% Year-to-date Change: -23.5% | |
| COLB Links: Profile News Message Board | |
| Charts:- Daily , Weekly | |
| Add COLB to Watchlist: View: Get Complete COLB Trend Analysis ➞ | |
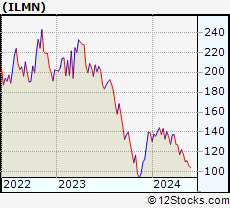 | ILMN Illumina, Inc. |
| Sector: Health Care | |
| SubSector: Biotechnology | |
| MarketCap: 39194.3 Millions | |
| Recent Price: 111.07 Smart Investing & Trading Score: 7 | |
| Day Percent Change: -2.96% Day Change: -3.39 | |
| Week Change: 0.49% Year-to-date Change: -20.2% | |
| ILMN Links: Profile News Message Board | |
| Charts:- Daily , Weekly | |
| Add ILMN to Watchlist: View: Get Complete ILMN Trend Analysis ➞ | |
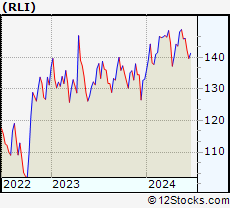 | RLI RLI Corp. |
| Sector: Financials | |
| SubSector: Property & Casualty Insurance | |
| MarketCap: 3534.92 Millions | |
| Recent Price: 148.77 Smart Investing & Trading Score: 100 | |
| Day Percent Change: 0.89% Day Change: 1.31 | |
| Week Change: 0.48% Year-to-date Change: 11.8% | |
| RLI Links: Profile News Message Board | |
| Charts:- Daily , Weekly | |
| Add RLI to Watchlist: View: Get Complete RLI Trend Analysis ➞ | |
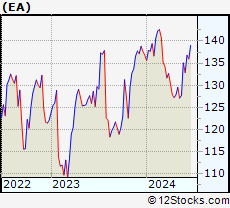 | EA Electronic Arts Inc. |
| Sector: Technology | |
| SubSector: Multimedia & Graphics Software | |
| MarketCap: 27296.5 Millions | |
| Recent Price: 127.75 Smart Investing & Trading Score: 33 | |
| Day Percent Change: -1.09% Day Change: -1.41 | |
| Week Change: 0.48% Year-to-date Change: -6.6% | |
| EA Links: Profile News Message Board | |
| Charts:- Daily , Weekly | |
| Add EA to Watchlist: View: Get Complete EA Trend Analysis ➞ | |
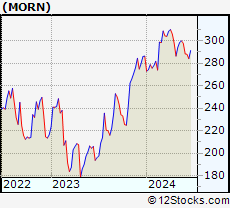 | MORN Morningstar, Inc. |
| Sector: Technology | |
| SubSector: Information & Delivery Services | |
| MarketCap: 4997.87 Millions | |
| Recent Price: 299.77 Smart Investing & Trading Score: 58 | |
| Day Percent Change: -0.07% Day Change: -0.20 | |
| Week Change: 0.47% Year-to-date Change: 4.7% | |
| MORN Links: Profile News Message Board | |
| Charts:- Daily , Weekly | |
| Add MORN to Watchlist: View: Get Complete MORN Trend Analysis ➞ | |
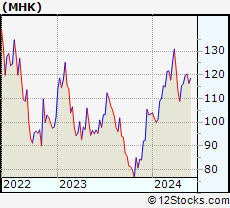 | MHK Mohawk Industries, Inc. |
| Sector: Consumer Staples | |
| SubSector: Home Furnishings & Fixtures | |
| MarketCap: 4682.25 Millions | |
| Recent Price: 120.36 Smart Investing & Trading Score: 63 | |
| Day Percent Change: -0.42% Day Change: -0.51 | |
| Week Change: 0.46% Year-to-date Change: 16.3% | |
| MHK Links: Profile News Message Board | |
| Charts:- Daily , Weekly | |
| Add MHK to Watchlist: View: Get Complete MHK Trend Analysis ➞ | |
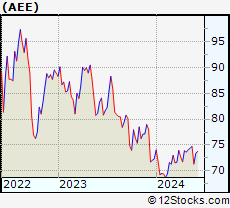 | AEE Ameren Corporation |
| Sector: Utilities | |
| SubSector: Electric Utilities | |
| MarketCap: 17308.2 Millions | |
| Recent Price: 74.74 Smart Investing & Trading Score: 71 | |
| Day Percent Change: -0.21% Day Change: -0.16 | |
| Week Change: 0.46% Year-to-date Change: 3.3% | |
| AEE Links: Profile News Message Board | |
| Charts:- Daily , Weekly | |
| Add AEE to Watchlist: View: Get Complete AEE Trend Analysis ➞ | |
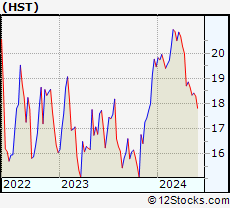 | HST Host Hotels & Resorts, Inc. |
| Sector: Financials | |
| SubSector: REIT - Hotel/Motel | |
| MarketCap: 8253.74 Millions | |
| Recent Price: 18.42 Smart Investing & Trading Score: 18 | |
| Day Percent Change: -1.76% Day Change: -0.33 | |
| Week Change: 0.44% Year-to-date Change: -5.4% | |
| HST Links: Profile News Message Board | |
| Charts:- Daily , Weekly | |
| Add HST to Watchlist: View: Get Complete HST Trend Analysis ➞ | |
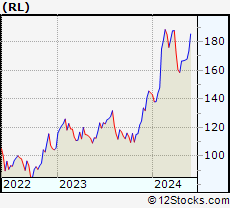 | RL Ralph Lauren Corporation |
| Sector: Consumer Staples | |
| SubSector: Textile - Apparel Clothing | |
| MarketCap: 5589.95 Millions | |
| Recent Price: 167.88 Smart Investing & Trading Score: 57 | |
| Day Percent Change: 1.08% Day Change: 1.79 | |
| Week Change: 0.44% Year-to-date Change: 16.4% | |
| RL Links: Profile News Message Board | |
| Charts:- Daily , Weekly | |
| Add RL to Watchlist: View: Get Complete RL Trend Analysis ➞ | |
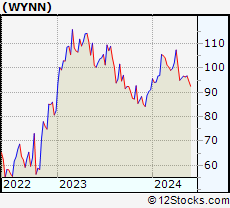 | WYNN Wynn Resorts, Limited |
| Sector: Services & Goods | |
| SubSector: Resorts & Casinos | |
| MarketCap: 6643.34 Millions | |
| Recent Price: 96.79 Smart Investing & Trading Score: 32 | |
| Day Percent Change: -0.33% Day Change: -0.32 | |
| Week Change: 0.41% Year-to-date Change: 6.2% | |
| WYNN Links: Profile News Message Board | |
| Charts:- Daily , Weekly | |
| Add WYNN to Watchlist: View: Get Complete WYNN Trend Analysis ➞ | |
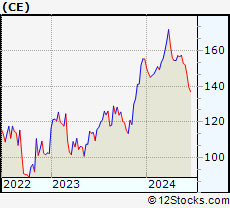 | CE Celanese Corporation |
| Sector: Materials | |
| SubSector: Chemicals - Major Diversified | |
| MarketCap: 8521.06 Millions | |
| Recent Price: 157.34 Smart Investing & Trading Score: 51 | |
| Day Percent Change: 1.07% Day Change: 1.67 | |
| Week Change: 0.41% Year-to-date Change: 1.3% | |
| CE Links: Profile News Message Board | |
| Charts:- Daily , Weekly | |
| Add CE to Watchlist: View: Get Complete CE Trend Analysis ➞ | |
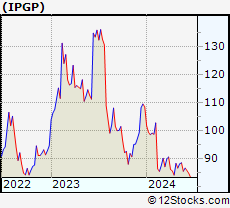 | IPGP IPG Photonics Corporation |
| Sector: Technology | |
| SubSector: Semiconductor Equipment & Materials | |
| MarketCap: 6059.38 Millions | |
| Recent Price: 88.61 Smart Investing & Trading Score: 61 | |
| Day Percent Change: 0.01% Day Change: 0.01 | |
| Week Change: 0.4% Year-to-date Change: -18.4% | |
| IPGP Links: Profile News Message Board | |
| Charts:- Daily , Weekly | |
| Add IPGP to Watchlist: View: Get Complete IPGP Trend Analysis ➞ | |
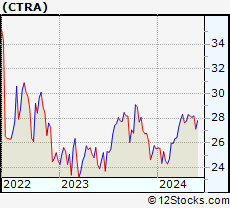 | CTRA Contura Energy, Inc. |
| Sector: Materials | |
| SubSector: Industrial Metals & Minerals | |
| MarketCap: 75.291 Millions | |
| Recent Price: 28.19 Smart Investing & Trading Score: 68 | |
| Day Percent Change: 0.64% Day Change: 0.18 | |
| Week Change: 0.39% Year-to-date Change: 10.5% | |
| CTRA Links: Profile News Message Board | |
| Charts:- Daily , Weekly | |
| Add CTRA to Watchlist: View: Get Complete CTRA Trend Analysis ➞ | |
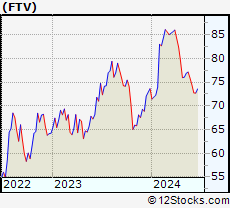 | FTV Fortive Corporation |
| Sector: Technology | |
| SubSector: Scientific & Technical Instruments | |
| MarketCap: 16351.9 Millions | |
| Recent Price: 77.16 Smart Investing & Trading Score: 45 | |
| Day Percent Change: -0.22% Day Change: -0.17 | |
| Week Change: 0.36% Year-to-date Change: 4.8% | |
| FTV Links: Profile News Message Board | |
| Charts:- Daily , Weekly | |
| Add FTV to Watchlist: View: Get Complete FTV Trend Analysis ➞ | |
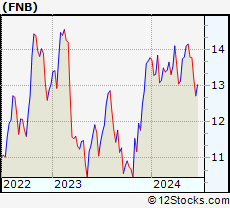 | FNB F.N.B. Corporation |
| Sector: Financials | |
| SubSector: Regional - Southeast Banks | |
| MarketCap: 2445.55 Millions | |
| Recent Price: 14.15 Smart Investing & Trading Score: 76 | |
| Day Percent Change: 0.71% Day Change: 0.10 | |
| Week Change: 0.35% Year-to-date Change: 2.8% | |
| FNB Links: Profile News Message Board | |
| Charts:- Daily , Weekly | |
| Add FNB to Watchlist: View: Get Complete FNB Trend Analysis ➞ | |
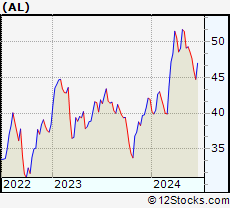 | AL Air Lease Corporation |
| Sector: Transports | |
| SubSector: Rental & Leasing Services | |
| MarketCap: 2586.44 Millions | |
| Recent Price: 49.27 Smart Investing & Trading Score: 54 | |
| Day Percent Change: -0.30% Day Change: -0.15 | |
| Week Change: 0.35% Year-to-date Change: 17.5% | |
| AL Links: Profile News Message Board | |
| Charts:- Daily , Weekly | |
| Add AL to Watchlist: View: Get Complete AL Trend Analysis ➞ | |
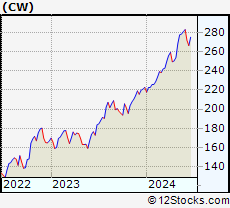 | CW Curtiss-Wright Corporation |
| Sector: Industrials | |
| SubSector: Diversified Machinery | |
| MarketCap: 4057.56 Millions | |
| Recent Price: 278.21 Smart Investing & Trading Score: 90 | |
| Day Percent Change: 0.59% Day Change: 1.64 | |
| Week Change: 0.32% Year-to-date Change: 24.9% | |
| CW Links: Profile News Message Board | |
| Charts:- Daily , Weekly | |
| Add CW to Watchlist: View: Get Complete CW Trend Analysis ➞ | |
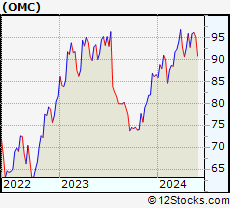 | OMC Omnicom Group Inc. |
| Sector: Services & Goods | |
| SubSector: Advertising Agencies | |
| MarketCap: 11813.5 Millions | |
| Recent Price: 96.13 Smart Investing & Trading Score: 63 | |
| Day Percent Change: -0.54% Day Change: -0.52 | |
| Week Change: 0.32% Year-to-date Change: 11.1% | |
| OMC Links: Profile News Message Board | |
| Charts:- Daily , Weekly | |
| Add OMC to Watchlist: View: Get Complete OMC Trend Analysis ➞ | |
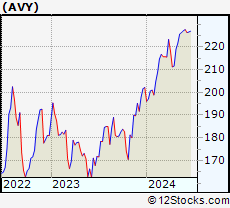 | AVY Avery Dennison Corporation |
| Sector: Consumer Staples | |
| SubSector: Business Equipment | |
| MarketCap: 8051.27 Millions | |
| Recent Price: 226.30 Smart Investing & Trading Score: 76 | |
| Day Percent Change: 0.77% Day Change: 1.72 | |
| Week Change: 0.31% Year-to-date Change: 11.9% | |
| AVY Links: Profile News Message Board | |
| Charts:- Daily , Weekly | |
| Add AVY to Watchlist: View: Get Complete AVY Trend Analysis ➞ | |
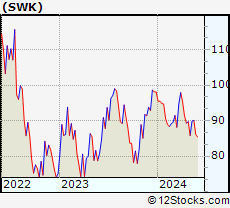 | SWK Stanley Black & Decker, Inc. |
| Sector: Industrials | |
| SubSector: Machine Tools & Accessories | |
| MarketCap: 14274.8 Millions | |
| Recent Price: 90.12 Smart Investing & Trading Score: 51 | |
| Day Percent Change: 0.37% Day Change: 0.33 | |
| Week Change: 0.31% Year-to-date Change: -8.1% | |
| SWK Links: Profile News Message Board | |
| Charts:- Daily , Weekly | |
| Add SWK to Watchlist: View: Get Complete SWK Trend Analysis ➞ | |
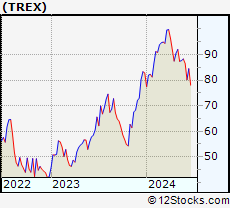 | TREX Trex Company, Inc. |
| Sector: Industrials | |
| SubSector: General Building Materials | |
| MarketCap: 4369.23 Millions | |
| Recent Price: 87.65 Smart Investing & Trading Score: 7 | |
| Day Percent Change: -1.13% Day Change: -1.00 | |
| Week Change: 0.31% Year-to-date Change: 5.9% | |
| TREX Links: Profile News Message Board | |
| Charts:- Daily , Weekly | |
| Add TREX to Watchlist: View: Get Complete TREX Trend Analysis ➞ | |
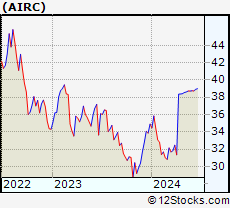 | AIRC Apartment Income REIT Corp. |
| Sector: Financials | |
| SubSector: REIT - Residential | |
| MarketCap: 5280 Millions | |
| Recent Price: 38.72 Smart Investing & Trading Score: 83 | |
| Day Percent Change: 0.16% Day Change: 0.06 | |
| Week Change: 0.31% Year-to-date Change: 10.9% | |
| AIRC Links: Profile News Message Board | |
| Charts:- Daily , Weekly | |
| Add AIRC to Watchlist: View: Get Complete AIRC Trend Analysis ➞ | |
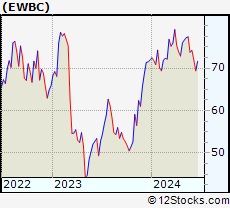 | EWBC East West Bancorp, Inc. |
| Sector: Financials | |
| SubSector: Foreign Money Center Banks | |
| MarketCap: 4618.31 Millions | |
| Recent Price: 77.41 Smart Investing & Trading Score: 71 | |
| Day Percent Change: 0.08% Day Change: 0.06 | |
| Week Change: 0.27% Year-to-date Change: 7.6% | |
| EWBC Links: Profile News Message Board | |
| Charts:- Daily , Weekly | |
| Add EWBC to Watchlist: View: Get Complete EWBC Trend Analysis ➞ | |
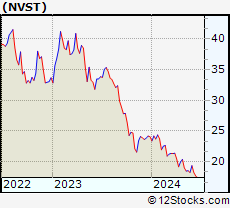 | NVST Envista Holdings Corporation |
| Sector: Health Care | |
| SubSector: Medical Instruments & Supplies | |
| MarketCap: 2075.8 Millions | |
| Recent Price: 18.53 Smart Investing & Trading Score: 10 | |
| Day Percent Change: -3.14% Day Change: -0.60 | |
| Week Change: 0.27% Year-to-date Change: -23.0% | |
| NVST Links: Profile News Message Board | |
| Charts:- Daily , Weekly | |
| Add NVST to Watchlist: View: Get Complete NVST Trend Analysis ➞ | |
| For tabular summary view of above stock list: Summary View ➞ 0 - 25 , 25 - 50 , 50 - 75 , 75 - 100 , 100 - 125 , 125 - 150 , 150 - 175 , 175 - 200 , 200 - 225 , 225 - 250 , 250 - 275 , 275 - 300 , 300 - 325 , 325 - 350 , 350 - 375 , 375 - 400 , 400 - 425 , 425 - 450 , 450 - 475 , 475 - 500 , 500 - 525 , 525 - 550 , 550 - 575 , 575 - 600 , 600 - 625 , 625 - 650 , 650 - 675 , 675 - 700 , 700 - 725 , 725 - 750 , 750 - 775 | ||
| Click To Change The Sort Order: By Market Cap or Company Size Performance: Year-to-date, Week and Day | |
| Select Chart Type: | ||
|
Best Stocks Today 12Stocks.com |
© 2024 12Stocks.com Terms & Conditions Privacy Contact Us
All Information Provided Only For Education And Not To Be Used For Investing or Trading. See Terms & Conditions


One More Thing ... Get Best Stocks Delivered Daily!
Never Ever Miss A Move With Our Top Ten Stocks Lists
Find Best Stocks In Any Market - Bull or Bear Market
Take A Peek At Our Top Ten Stocks Lists: Daily, Weekly, Year-to-Date & Top Trends
Find Best Stocks In Any Market - Bull or Bear Market
Take A Peek At Our Top Ten Stocks Lists: Daily, Weekly, Year-to-Date & Top Trends
Midcap Stocks With Best Up Trends [0-bearish to 100-bullish]: Robinhood Markets[100], SSR Mining[100], Littelfuse [100], Tractor Supply[100], DuPont de[100], Royal Gold[100], Alcoa [100], Range Resources[100], Arch Capital[100], Evercore [100], Prosperity Bancshares[100]
Best Midcap Stocks Year-to-Date:
Vistra Energy[144.24%], AppLovin [107.29%], Constellation Energy[81.97%], CAVA [77.74%], EMCOR [75.63%], ShockWave Medical[73.24%], Maravai LifeSciences[72.82%], Celsius [70.62%], Tenet [70%], Natera [69.96%], Pure Storage[65.87%] Best Midcap Stocks This Week:
AMC Entertainment[51.2%], Petco Health[50%], NovoCure [33.52%], GameStop [27.21%], Plug Power[26.95%], Robinhood Markets[23.78%], Doximity [19.94%], Ubiquiti [16.29%], Hawaiian Electric[15.12%], MP Materials[13.14%], Victorias Secret[13.12%] Best Midcap Stocks Daily:
Doximity [18.07%], Robinhood Markets[12.23%], Affirm [8.01%], SSR Mining[6.28%], Coinbase Global[4.23%], Littelfuse [4.13%], Rivian Automotive[3.65%], DoubleVerify [3.50%], Tractor Supply[3.42%], Iridium [3.42%], Ubiquiti [3.04%]