
 Login Sign Up


| |||||
 |  | ||||

| 12Stocks.com Market Intelligence |
Best MidCap Stocks
|
| In a hurry? Mid Cap Stocks Lists: Performance Trends Table, Stock Charts
Sort midcap stocks: Daily, Weekly, Year-to-Date, Market Cap & Trends. Filter midcap stocks list by sector: Show all, Tech, Finance, Energy, Staples, Retail, Industrial, Materials, Utilities and HealthCare Filter midcap stocks list by size:All MidCap Large Mid-Range Small |
| 12Stocks.com Mid Cap Stocks Performances & Trends Daily | |||||||||
|
|  The overall Smart Investing & Trading Score is 76 (0-bearish to 100-bullish) which puts Mid Cap index in short term neutral to bullish trend. The Smart Investing & Trading Score from previous trading session is 100 and a deterioration of trend continues.
| ||||||||
Here are the Smart Investing & Trading Scores of the most requested mid cap stocks at 12Stocks.com (click stock name for detailed review):
|


| 12Stocks.com: Top Performing Mid Cap Index Stocks | ||||||||||||||||||||||||||||||||||||||||||||||||
 The top performing Mid Cap Index stocks year to date are
Now, more recently, over last week, the top performing Mid Cap Index stocks on the move are


|
||||||||||||||||||||||||||||||||||||||||||||||||
| 12Stocks.com: Investing in Midcap Index with Stocks | |
|
The following table helps investors and traders sort through current performance and trends (as measured by Smart Investing & Trading Score) of various
stocks in the Midcap Index. Quick View: Move mouse or cursor over stock symbol (ticker) to view short-term technical chart and over stock name to view long term chart. Click on  to add stock symbol to your watchlist and to add stock symbol to your watchlist and  to view watchlist. Click on any ticker or stock name for detailed market intelligence report for that stock. to view watchlist. Click on any ticker or stock name for detailed market intelligence report for that stock. |
12Stocks.com Performance of Stocks in Midcap Index
| Ticker | Stock Name | Watchlist | Category | Recent Price | Smart Investing & Trading Score | Change % | Weekly Change% |
| BLDR | Builders FirstSource |   | Industrials | 167.05 | 10 | 1.00% | 0.05% |
| HEI | HEICO | | Industrials | 215.54 | 100 | 0.48% | 0.05% |
| FIVN | Five9 | | Technology | 53.07 | 28 | -1.49% | 0.02% |
| UNM | Unum | | Financials | 53.09 | 83 | 0.61% | 0.00% |
| JNPR | Juniper Networks | | Technology | 34.64 | 32 | -0.20% | 0.00% |
| WAB | Wabtec | | Transports | 168.32 | 78 | 1.00% | -0.01% |
| CC | Chemours | | Materials | 28.89 | 83 | 0.07% | -0.03% |
| GPN | Global Payments | | Services & Goods | 109.16 | 10 | -0.10% | -0.06% |
| ALGN | Align | | Health Care | 271.50 | 10 | -0.75% | -0.07% |
| UHAL | AMERCO | | Transports | 69.06 | 83 | 0.04% | -0.07% |
| HXL | Hexcel | | Industrials | 71.97 | 42 | -0.65% | -0.08% |
| U | Unity Software | | Technology | 21.67 | 10 | -1.90% | -0.09% |
| SJM | J. M. | | Consumer Staples | 115.21 | 54 | -0.41% | -0.11% |
| CPT | Camden Property | | Financials | 106.50 | 76 | -0.02% | -0.13% |
| MEDP | Medpace | | Health Care | 393.30 | 15 | 0.01% | -0.14% |
| JKHY | Jack Henry | | Technology | 168.99 | 62 | -0.23% | -0.15% |
| HOLX | Hologic | | Health Care | 75.02 | 53 | 0.09% | -0.16% |
| MDU | MDU Resources | | Industrials | 25.48 | 83 | 1.51% | -0.16% |
| ANSS | ANSYS | | Technology | 327.71 | 25 | 0.05% | -0.16% |
| SWAV | ShockWave Medical | | Health Care | 330.13 | 61 | -0.23% | -0.17% |
| WLK | Westlake Chemical | | Materials | 157.83 | 88 | 1.79% | -0.20% |
| OHI | Omega | | Financials | 30.63 | 0 | -0.16% | -0.20% |
| MAT | Mattel | | Consumer Staples | 18.62 | 42 | -0.37% | -0.21% |
| ICLR | ICON Public | | Health Care | 314.72 | 40 | -0.35% | -0.21% |
| UHS | Universal Health | | Health Care | 177.70 | 71 | -0.72% | -0.22% |
| For chart view version of above stock list: Chart View ➞ 0 - 25 , 25 - 50 , 50 - 75 , 75 - 100 , 100 - 125 , 125 - 150 , 150 - 175 , 175 - 200 , 200 - 225 , 225 - 250 , 250 - 275 , 275 - 300 , 300 - 325 , 325 - 350 , 350 - 375 , 375 - 400 , 400 - 425 , 425 - 450 , 450 - 475 , 475 - 500 , 500 - 525 , 525 - 550 , 550 - 575 , 575 - 600 , 600 - 625 , 625 - 650 , 650 - 675 , 675 - 700 , 700 - 725 , 725 - 750 , 750 - 775 | ||
 | Click To Change The Sort Order: By Market Cap or Company Size Performance: Year-to-date, Week and Day |  |
|
Get the most comprehensive stock market coverage daily at 12Stocks.com ➞ Best Stocks Today ➞ Best Stocks Weekly ➞ Best Stocks Year-to-Date ➞ Best Stocks Trends ➞  Best Stocks Today 12Stocks.com Best Nasdaq Stocks ➞ Best S&P 500 Stocks ➞ Best Tech Stocks ➞ Best Biotech Stocks ➞ |
| Detailed Overview of Midcap Stocks |
| Midcap Technical Overview, Leaders & Laggards, Top Midcap ETF Funds & Detailed Midcap Stocks List, Charts, Trends & More |
| Midcap: Technical Analysis, Trends & YTD Performance | |
| MidCap segment as represented by
MDY, an exchange-traded fund [ETF], holds basket of about four hundred midcap stocks from across all major sectors of the US stock market. The midcap index (contains stocks like Green Mountain Coffee Roasters and Tractor Supply Company) is up by 8.73% and is currently underperforming the overall market by -1.84% year-to-date. Below is a quick view of technical charts and trends: | |
 MDY Weekly Chart |
|
| Long Term Trend: Very Good | |
| Medium Term Trend: Very Good | |
 MDY Daily Chart |
|
| Short Term Trend: Not Good | |
| Overall Trend Score: 76 | |
| YTD Performance: 8.73% | |
| **Trend Scores & Views Are Only For Educational Purposes And Not For Investing | |
| 12Stocks.com: Investing in Midcap Index using Exchange Traded Funds | |
|
The following table shows list of key exchange traded funds (ETF) that
help investors track Midcap index. The following list also includes leveraged ETF funds that track twice or thrice the daily returns of Midcap indices. Short or inverse ETF funds move in the opposite direction to the index they track and are useful during market pullbacks or during bear markets. Quick View: Move mouse or cursor over ETF symbol (ticker) to view short-term technical chart and over ETF name to view long term chart. Click on ticker or stock name for detailed view. Click on to add stock symbol to your watchlist and to view watchlist. |
12Stocks.com List of ETFs that track Midcap Index
| Ticker | ETF Name | Watchlist | Recent Price | Smart Investing & Trading Score | Change % | Week % | Year-to-date % |
| IJH | iShares Core S&P Mid-Cap | | 60.31 | 68 | -0.46 | 0.84 | 8.8% |
| MDY | SPDR S&P MidCap 400 ETF | | 551.69 | 76 | 0.11 | 0.84 | 8.73% |
| IWR | iShares Russell Mid-Cap | | 83.29 | 76 | -0.28 | 1.07 | 7.15% |
| IWP | iShares Russell Mid-Cap Growth | | 112.01 | 70 | -0.29 | 1.53 | 7.23% |
| IWS | iShares Russell Mid-Cap Value | | 124.51 | 76 | -0.34 | 0.92 | 7.07% |
| IJK | iShares S&P Mid-Cap 400 Growth | | 90.28 | 71 | -0.05 | 0.39 | 13.96% |
| IJJ | iShares S&P Mid-Cap 400 Value | | 117.71 | 76 | -0.16 | 1.26 | 3.22% |
| MVV | ProShares Ultra MidCap400 | | 66.42 | 76 | 0.02 | 1.65 | 14.74% |
| XMLV | PowerShares S&P MidCap Low Volatil ETF | | 56.93 | 76 | -0.02 | 0.42 | 7.05% |
| UMDD | ProShares UltraPro MidCap400 | | 26.83 | 76 | -0.58 | 1.98 | 20.21% |
| SMDD | ProShares UltraPro Short MidCap400 | | 10.48 | 25 | 0.73 | -1.92 | -22.18% |
| MYY | ProShares Short MidCap400 | | 20.00 | 25 | 0.60 | -0.61 | -6.78% |
| MZZ | ProShares UltraShort MidCap400 | | 10.81 | 27 | 0.49 | -1.25 | -13.98% |
| 12Stocks.com: Charts, Trends, Fundamental Data and Performances of MidCap Stocks | |
|
We now take in-depth look at all MidCap stocks including charts, multi-period performances and overall trends (as measured by Smart Investing & Trading Score). One can sort MidCap stocks (click link to choose) by Daily, Weekly and by Year-to-Date performances. Also, one can sort by size of the company or by market capitalization. |
| Select Your Default Chart Type: | |||||
| |||||
| Click on stock symbol or name for detailed view. Click on to add stock symbol to your watchlist and to view watchlist. Quick View: Move mouse or cursor over "Daily" to quickly view daily technical stock chart and over "Weekly" to view weekly technical stock chart. | |||||

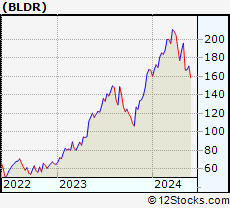 | BLDR Builders FirstSource, Inc. |
| Sector: Industrials | |
| SubSector: General Building Materials | |
| MarketCap: 1714.63 Millions | |
| Recent Price: 167.05 Smart Investing & Trading Score: 10 | |
| Day Percent Change: 1.00% Day Change: 1.66 | |
| Week Change: 0.05% Year-to-date Change: 0.1% | |
| BLDR Links: Profile News Message Board | |
| Charts:- Daily , Weekly | |
| Add BLDR to Watchlist: View: Get Complete BLDR Trend Analysis ➞ | |
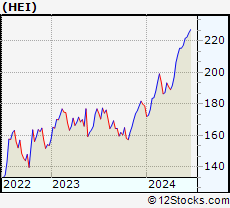 | HEI HEICO Corporation |
| Sector: Industrials | |
| SubSector: Aerospace/Defense Products & Services | |
| MarketCap: 10023.1 Millions | |
| Recent Price: 215.54 Smart Investing & Trading Score: 100 | |
| Day Percent Change: 0.48% Day Change: 1.03 | |
| Week Change: 0.05% Year-to-date Change: 20.5% | |
| HEI Links: Profile News Message Board | |
| Charts:- Daily , Weekly | |
| Add HEI to Watchlist: View: Get Complete HEI Trend Analysis ➞ | |
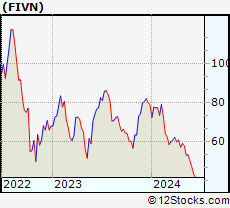 | FIVN Five9, Inc. |
| Sector: Technology | |
| SubSector: Application Software | |
| MarketCap: 4253.62 Millions | |
| Recent Price: 53.07 Smart Investing & Trading Score: 28 | |
| Day Percent Change: -1.49% Day Change: -0.80 | |
| Week Change: 0.02% Year-to-date Change: -32.6% | |
| FIVN Links: Profile News Message Board | |
| Charts:- Daily , Weekly | |
| Add FIVN to Watchlist: View: Get Complete FIVN Trend Analysis ➞ | |
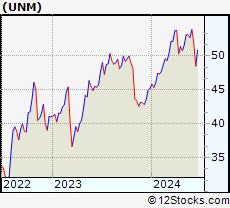 | UNM Unum Group |
| Sector: Financials | |
| SubSector: Accident & Health Insurance | |
| MarketCap: 2760.9 Millions | |
| Recent Price: 53.09 Smart Investing & Trading Score: 83 | |
| Day Percent Change: 0.61% Day Change: 0.32 | |
| Week Change: 0% Year-to-date Change: 17.4% | |
| UNM Links: Profile News Message Board | |
| Charts:- Daily , Weekly | |
| Add UNM to Watchlist: View: Get Complete UNM Trend Analysis ➞ | |
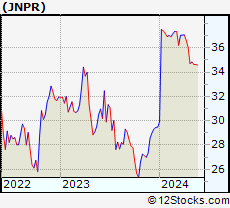 | JNPR Juniper Networks, Inc. |
| Sector: Technology | |
| SubSector: Communication Equipment | |
| MarketCap: 6161.49 Millions | |
| Recent Price: 34.64 Smart Investing & Trading Score: 32 | |
| Day Percent Change: -0.20% Day Change: -0.07 | |
| Week Change: 0% Year-to-date Change: 17.5% | |
| JNPR Links: Profile News Message Board | |
| Charts:- Daily , Weekly | |
| Add JNPR to Watchlist: View: Get Complete JNPR Trend Analysis ➞ | |
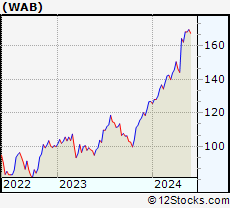 | WAB Wabtec Corporation |
| Sector: Transports | |
| SubSector: Railroads | |
| MarketCap: 8230.22 Millions | |
| Recent Price: 168.32 Smart Investing & Trading Score: 78 | |
| Day Percent Change: 1.00% Day Change: 1.66 | |
| Week Change: -0.01% Year-to-date Change: 32.6% | |
| WAB Links: Profile News Message Board | |
| Charts:- Daily , Weekly | |
| Add WAB to Watchlist: View: Get Complete WAB Trend Analysis ➞ | |
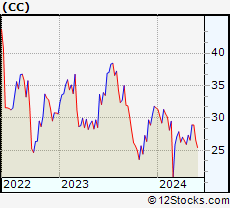 | CC The Chemours Company |
| Sector: Materials | |
| SubSector: Specialty Chemicals | |
| MarketCap: 1718.17 Millions | |
| Recent Price: 28.89 Smart Investing & Trading Score: 83 | |
| Day Percent Change: 0.07% Day Change: 0.02 | |
| Week Change: -0.03% Year-to-date Change: -8.4% | |
| CC Links: Profile News Message Board | |
| Charts:- Daily , Weekly | |
| Add CC to Watchlist: View: Get Complete CC Trend Analysis ➞ | |
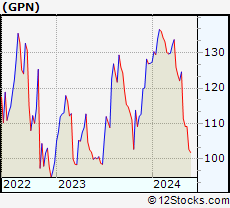 | GPN Global Payments Inc. |
| Sector: Services & Goods | |
| SubSector: Business Services | |
| MarketCap: 39068.8 Millions | |
| Recent Price: 109.16 Smart Investing & Trading Score: 10 | |
| Day Percent Change: -0.10% Day Change: -0.11 | |
| Week Change: -0.06% Year-to-date Change: -14.1% | |
| GPN Links: Profile News Message Board | |
| Charts:- Daily , Weekly | |
| Add GPN to Watchlist: View: Get Complete GPN Trend Analysis ➞ | |
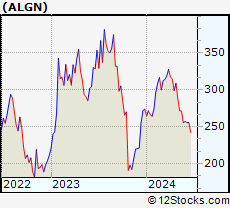 | ALGN Align Technology, Inc. |
| Sector: Health Care | |
| SubSector: Medical Appliances & Equipment | |
| MarketCap: 12802 Millions | |
| Recent Price: 271.50 Smart Investing & Trading Score: 10 | |
| Day Percent Change: -0.75% Day Change: -2.06 | |
| Week Change: -0.07% Year-to-date Change: -0.9% | |
| ALGN Links: Profile News Message Board | |
| Charts:- Daily , Weekly | |
| Add ALGN to Watchlist: View: Get Complete ALGN Trend Analysis ➞ | |
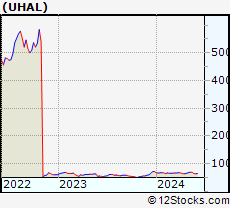 | UHAL AMERCO |
| Sector: Transports | |
| SubSector: Rental & Leasing Services | |
| MarketCap: 5271.94 Millions | |
| Recent Price: 69.06 Smart Investing & Trading Score: 83 | |
| Day Percent Change: 0.04% Day Change: 0.03 | |
| Week Change: -0.07% Year-to-date Change: -3.8% | |
| UHAL Links: Profile News Message Board | |
| Charts:- Daily , Weekly | |
| Add UHAL to Watchlist: View: Get Complete UHAL Trend Analysis ➞ | |
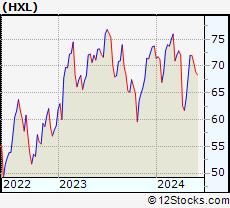 | HXL Hexcel Corporation |
| Sector: Industrials | |
| SubSector: Aerospace/Defense Products & Services | |
| MarketCap: 2905.51 Millions | |
| Recent Price: 71.97 Smart Investing & Trading Score: 42 | |
| Day Percent Change: -0.65% Day Change: -0.47 | |
| Week Change: -0.08% Year-to-date Change: -2.4% | |
| HXL Links: Profile News Message Board | |
| Charts:- Daily , Weekly | |
| Add HXL to Watchlist: View: Get Complete HXL Trend Analysis ➞ | |
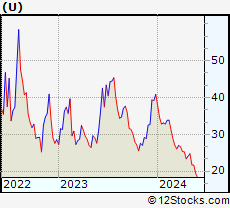 | U Unity Software Inc. |
| Sector: Technology | |
| SubSector: Software Application | |
| MarketCap: 42837 Millions | |
| Recent Price: 21.67 Smart Investing & Trading Score: 10 | |
| Day Percent Change: -1.90% Day Change: -0.42 | |
| Week Change: -0.09% Year-to-date Change: -47.0% | |
| U Links: Profile News Message Board | |
| Charts:- Daily , Weekly | |
| Add U to Watchlist: View: Get Complete U Trend Analysis ➞ | |
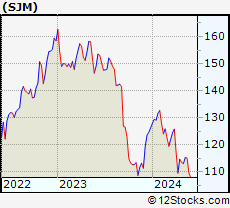 | SJM The J. M. Smucker Company |
| Sector: Consumer Staples | |
| SubSector: Processed & Packaged Goods | |
| MarketCap: 12635.8 Millions | |
| Recent Price: 115.21 Smart Investing & Trading Score: 54 | |
| Day Percent Change: -0.41% Day Change: -0.47 | |
| Week Change: -0.11% Year-to-date Change: -8.8% | |
| SJM Links: Profile News Message Board | |
| Charts:- Daily , Weekly | |
| Add SJM to Watchlist: View: Get Complete SJM Trend Analysis ➞ | |
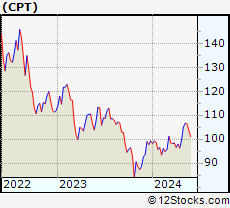 | CPT Camden Property Trust |
| Sector: Financials | |
| SubSector: REIT - Residential | |
| MarketCap: 7535.21 Millions | |
| Recent Price: 106.50 Smart Investing & Trading Score: 76 | |
| Day Percent Change: -0.02% Day Change: -0.02 | |
| Week Change: -0.13% Year-to-date Change: 7.3% | |
| CPT Links: Profile News Message Board | |
| Charts:- Daily , Weekly | |
| Add CPT to Watchlist: View: Get Complete CPT Trend Analysis ➞ | |
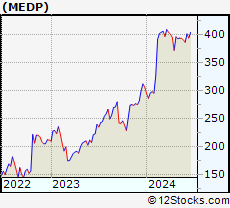 | MEDP Medpace Holdings, Inc. |
| Sector: Health Care | |
| SubSector: Medical Laboratories & Research | |
| MarketCap: 2888.7 Millions | |
| Recent Price: 393.30 Smart Investing & Trading Score: 15 | |
| Day Percent Change: 0.01% Day Change: 0.02 | |
| Week Change: -0.14% Year-to-date Change: 28.3% | |
| MEDP Links: Profile News Message Board | |
| Charts:- Daily , Weekly | |
| Add MEDP to Watchlist: View: Get Complete MEDP Trend Analysis ➞ | |
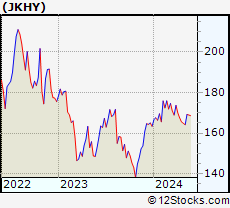 | JKHY Jack Henry & Associates, Inc. |
| Sector: Technology | |
| SubSector: Information Technology Services | |
| MarketCap: 10695.4 Millions | |
| Recent Price: 168.99 Smart Investing & Trading Score: 62 | |
| Day Percent Change: -0.23% Day Change: -0.39 | |
| Week Change: -0.15% Year-to-date Change: 3.4% | |
| JKHY Links: Profile News Message Board | |
| Charts:- Daily , Weekly | |
| Add JKHY to Watchlist: View: Get Complete JKHY Trend Analysis ➞ | |
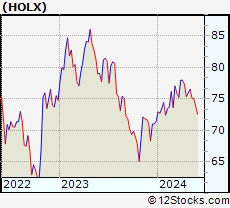 | HOLX Hologic, Inc. |
| Sector: Health Care | |
| SubSector: Medical Instruments & Supplies | |
| MarketCap: 9075.2 Millions | |
| Recent Price: 75.02 Smart Investing & Trading Score: 53 | |
| Day Percent Change: 0.09% Day Change: 0.07 | |
| Week Change: -0.16% Year-to-date Change: 5.0% | |
| HOLX Links: Profile News Message Board | |
| Charts:- Daily , Weekly | |
| Add HOLX to Watchlist: View: Get Complete HOLX Trend Analysis ➞ | |
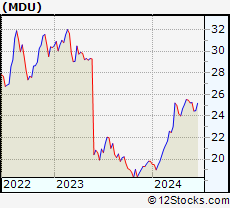 | MDU MDU Resources Group, Inc. |
| Sector: Industrials | |
| SubSector: General Building Materials | |
| MarketCap: 4262.53 Millions | |
| Recent Price: 25.48 Smart Investing & Trading Score: 83 | |
| Day Percent Change: 1.51% Day Change: 0.38 | |
| Week Change: -0.16% Year-to-date Change: 28.7% | |
| MDU Links: Profile News Message Board | |
| Charts:- Daily , Weekly | |
| Add MDU to Watchlist: View: Get Complete MDU Trend Analysis ➞ | |
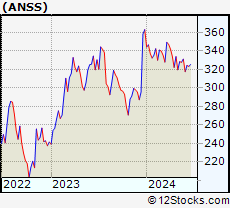 | ANSS ANSYS, Inc. |
| Sector: Technology | |
| SubSector: Application Software | |
| MarketCap: 19497.4 Millions | |
| Recent Price: 327.71 Smart Investing & Trading Score: 25 | |
| Day Percent Change: 0.05% Day Change: 0.18 | |
| Week Change: -0.16% Year-to-date Change: -9.7% | |
| ANSS Links: Profile News Message Board | |
| Charts:- Daily , Weekly | |
| Add ANSS to Watchlist: View: Get Complete ANSS Trend Analysis ➞ | |
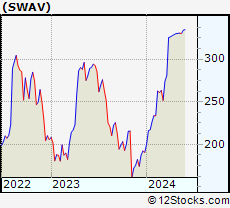 | SWAV ShockWave Medical, Inc. |
| Sector: Health Care | |
| SubSector: Medical Appliances & Equipment | |
| MarketCap: 855.58 Millions | |
| Recent Price: 330.13 Smart Investing & Trading Score: 61 | |
| Day Percent Change: -0.23% Day Change: -0.75 | |
| Week Change: -0.17% Year-to-date Change: 73.2% | |
| SWAV Links: Profile News Message Board | |
| Charts:- Daily , Weekly | |
| Add SWAV to Watchlist: View: Get Complete SWAV Trend Analysis ➞ | |
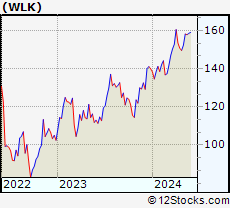 | WLK Westlake Chemical Corporation |
| Sector: Materials | |
| SubSector: Specialty Chemicals | |
| MarketCap: 5221.47 Millions | |
| Recent Price: 157.83 Smart Investing & Trading Score: 88 | |
| Day Percent Change: 1.79% Day Change: 2.77 | |
| Week Change: -0.2% Year-to-date Change: 12.8% | |
| WLK Links: Profile News Message Board | |
| Charts:- Daily , Weekly | |
| Add WLK to Watchlist: View: Get Complete WLK Trend Analysis ➞ | |
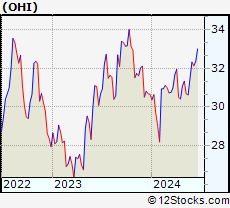 | OHI Omega Healthcare Investors, Inc. |
| Sector: Financials | |
| SubSector: REIT - Healthcare Facilities | |
| MarketCap: 6433.84 Millions | |
| Recent Price: 30.63 Smart Investing & Trading Score: 0 | |
| Day Percent Change: -0.16% Day Change: -0.05 | |
| Week Change: -0.2% Year-to-date Change: -0.1% | |
| OHI Links: Profile News Message Board | |
| Charts:- Daily , Weekly | |
| Add OHI to Watchlist: View: Get Complete OHI Trend Analysis ➞ | |
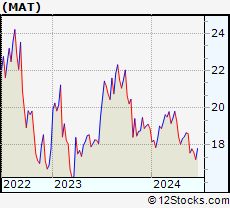 | MAT Mattel, Inc. |
| Sector: Consumer Staples | |
| SubSector: Toys & Games | |
| MarketCap: 2915.8 Millions | |
| Recent Price: 18.62 Smart Investing & Trading Score: 42 | |
| Day Percent Change: -0.37% Day Change: -0.07 | |
| Week Change: -0.21% Year-to-date Change: -1.4% | |
| MAT Links: Profile News Message Board | |
| Charts:- Daily , Weekly | |
| Add MAT to Watchlist: View: Get Complete MAT Trend Analysis ➞ | |
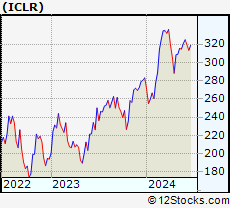 | ICLR ICON Public Limited Company |
| Sector: Health Care | |
| SubSector: Medical Laboratories & Research | |
| MarketCap: 7011 Millions | |
| Recent Price: 314.72 Smart Investing & Trading Score: 40 | |
| Day Percent Change: -0.35% Day Change: -1.11 | |
| Week Change: -0.21% Year-to-date Change: 11.2% | |
| ICLR Links: Profile News Message Board | |
| Charts:- Daily , Weekly | |
| Add ICLR to Watchlist: View: Get Complete ICLR Trend Analysis ➞ | |
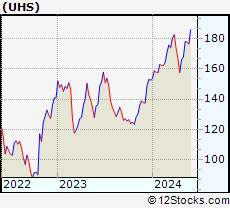 | UHS Universal Health Services, Inc. |
| Sector: Health Care | |
| SubSector: Hospitals | |
| MarketCap: 7217.66 Millions | |
| Recent Price: 177.70 Smart Investing & Trading Score: 71 | |
| Day Percent Change: -0.72% Day Change: -1.28 | |
| Week Change: -0.22% Year-to-date Change: 16.6% | |
| UHS Links: Profile News Message Board | |
| Charts:- Daily , Weekly | |
| Add UHS to Watchlist: View: Get Complete UHS Trend Analysis ➞ | |
| For tabular summary view of above stock list: Summary View ➞ 0 - 25 , 25 - 50 , 50 - 75 , 75 - 100 , 100 - 125 , 125 - 150 , 150 - 175 , 175 - 200 , 200 - 225 , 225 - 250 , 250 - 275 , 275 - 300 , 300 - 325 , 325 - 350 , 350 - 375 , 375 - 400 , 400 - 425 , 425 - 450 , 450 - 475 , 475 - 500 , 500 - 525 , 525 - 550 , 550 - 575 , 575 - 600 , 600 - 625 , 625 - 650 , 650 - 675 , 675 - 700 , 700 - 725 , 725 - 750 , 750 - 775 | ||
| Click To Change The Sort Order: By Market Cap or Company Size Performance: Year-to-date, Week and Day | |
| Select Chart Type: | ||
|
Best Stocks Today 12Stocks.com |
© 2024 12Stocks.com Terms & Conditions Privacy Contact Us
All Information Provided Only For Education And Not To Be Used For Investing or Trading. See Terms & Conditions


One More Thing ... Get Best Stocks Delivered Daily!
Never Ever Miss A Move With Our Top Ten Stocks Lists
Find Best Stocks In Any Market - Bull or Bear Market
Take A Peek At Our Top Ten Stocks Lists: Daily, Weekly, Year-to-Date & Top Trends
Find Best Stocks In Any Market - Bull or Bear Market
Take A Peek At Our Top Ten Stocks Lists: Daily, Weekly, Year-to-Date & Top Trends
Midcap Stocks With Best Up Trends [0-bearish to 100-bullish]: Robinhood Markets[100], SSR Mining[100], Littelfuse [100], Tractor Supply[100], DuPont de[100], Royal Gold[100], Alcoa [100], Range Resources[100], Arch Capital[100], Evercore [100], Prosperity Bancshares[100]
Best Midcap Stocks Year-to-Date:
Vistra Energy[144.24%], AppLovin [107.29%], Constellation Energy[81.97%], CAVA [77.74%], EMCOR [75.63%], ShockWave Medical[73.24%], Maravai LifeSciences[72.82%], Celsius [70.62%], Tenet [70%], Natera [69.96%], Pure Storage[65.87%] Best Midcap Stocks This Week:
AMC Entertainment[51.2%], Petco Health[50%], NovoCure [33.52%], GameStop [27.21%], Plug Power[26.95%], Robinhood Markets[23.78%], Doximity [19.94%], Ubiquiti [16.29%], Hawaiian Electric[15.12%], MP Materials[13.14%], Victorias Secret[13.12%] Best Midcap Stocks Daily:
Doximity [18.07%], Robinhood Markets[12.23%], Affirm [8.01%], SSR Mining[6.28%], Coinbase Global[4.23%], Littelfuse [4.13%], Rivian Automotive[3.65%], DoubleVerify [3.50%], Tractor Supply[3.42%], Iridium [3.42%], Ubiquiti [3.04%]