
 Login Sign Up


| |||||
 |  | ||||

| 12Stocks.com Market Intelligence |
Stock Charts, Performance & Trend Analysis for TSHA
Taysha Gene Therapies, Inc.
|
| |||||||||||||||||||
 ➞
➞ ➞
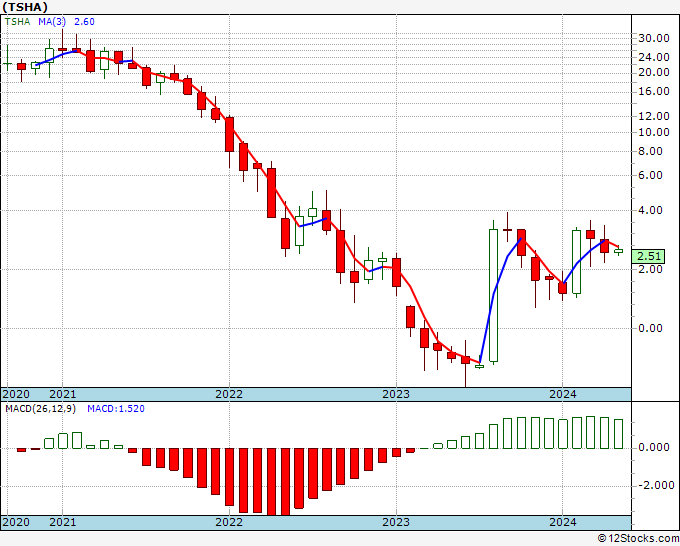
➞May 14, 2024 - The year-to-date (YTD) return or performance of Taysha Gene (TSHA) is up 34.83% and is outperforming the overall stock market by 25.99%.
Recently, the weekly return of Taysha Gene (TSHA) is up 2.56% and is outperforming the overall market by 2.51%.
Although long term trends for Taysha Gene Therapies, Inc. are not good, the short and mid term trends are improving.
The overall 12Stocks.com Smart Investing & Trading Score is 10 (measures stock trend from 0-bearish to 100-bullish) which puts TSHA in short term bearish trend.
The Smart Investing & Trading Score from previous trading session is 15 and hence a minor deterioration of trend. Scroll down for key technical charts, support & resistance levels and analysis for Taysha Gene.
| Stock Analysis for TSHA | |||||||
| Name: Taysha Gene Therapies, Inc. | |||||||
| Sector: Health Care | |||||||
| SubSector: Biotechnology | |||||||
| In A Glance Taysha Gene (TSHA) Stock Performance and Technical Trend Chart View | |||||||
| |||||||
Weekly TSHA Technical Chart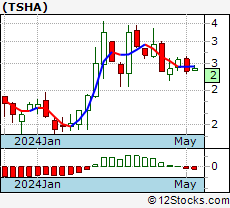 Daily TSHA Technical Chart 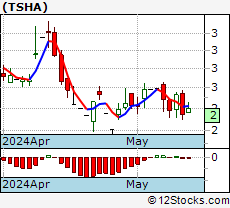 Add TSHA To Watch List View List | |||||||
| 12Stocks.com Short Term Trend Analysis for TSHA | |||||||
| 10 / 100 | |||||||
| The current technical trend score is 10 in a scale where 0 is bearish and 100 is bullish. | |||||||
| The technical trend score from previous session is 15. | |||||||
| Trend score updated daily. Not to be used for investing. | |||||||
Stocks Similar To Taysha Gene
|
|
|
|
Get the most comprehensive stock market coverage daily at 12Stocks.com ➞ Best Stocks Today ➞ Best Stocks Weekly ➞ Best Stocks Year-to-Date ➞ Best Stocks Trends ➞  Best Stocks Today 12Stocks.com Best Nasdaq Stocks ➞ Best S&P 500 Stocks ➞ Best Tech Stocks ➞ Best Biotech Stocks ➞ |
© 2024 12Stocks.com Terms & Conditions Privacy Contact Us
All Information Provided Only For Education And Not To Be Used For Investing or Trading. See Terms & Conditions


One More Thing ... Get Best Stocks Delivered Daily!
Never Ever Miss A Move With Our Top Ten Stocks Lists
Get Best Performing Stocks, Daily Market Trends & Insight
Take A Peek At Our Top Ten Stocks Lists: Daily, Weekly, Year-to-Date & Top Trends
Get Best Performing Stocks, Daily Market Trends & Insight
Take A Peek At Our Top Ten Stocks Lists: Daily, Weekly, Year-to-Date & Top Trends
Dow Stocks With Best Current Trends [0-bearish to 100-bullish]: 3M [100], Honeywell [100], Coca-Cola [95], Verizon [95], Chase[95], UnitedHealth [95], [90], Dow [88], Cisco Systems[87], Caterpillar [85] Best S&P 500 Stocks Year-to-Date Update:
NVIDIA [82.54%], Constellation Energy[82.38%], NRG Energy[59.5%], Micron [44.13%], Chipotle Mexican[39.72%], Eaton [36.41%], Western Digital[35.52%], Leidos [34.97%], Progressive [33.36%], Meta Platforms[32.2%] Best Nasdaq 100 Stocks Weekly Update:
Walgreens Boots[5.41%], Moderna [5.18%], Sirius XM[3.63%], GLOBALFOUNDRIES [3.01%], ON Semiconductor[2.65%], Fortinet [2.53%], Pinduoduo [2.42%], Gilead [2.4%], Intel [2.21%], Illumina [2.03%] Today's Stock Market In A Nutshell:China [2.1%], Oil [1.1%], Emerging Markets [0.8%], US Small Cap [0.2%], Euro [0.2%], Bonds [0.1%], Europe [0.1%], US Mid Cap [0%], US Large Cap [0%], US Dollar [-0%], Gold [-1.1%],