
 Login Sign Up


| |||||
 |  | ||||

| 12Stocks.com Market Intelligence |
Best Latin America Stocks
|
|
| Quick Read: Top Latin America Stocks By Performances & Trends: Daily, Weekly, Year-to-Date, Market Cap (Size) & Technical Trends | |||
| Best Latin America Views: Quick Browse View, Summary & Slide Show | |||
| 12Stocks.com Latin America Stocks Performances & Trends Daily | |||||||||
|
|  The overall market intelligence score is 77 (0-bearish to 100-bullish) which puts Latin America index in short term neutral to bullish trend. The market intelligence score from previous trading session is 57 and hence an improvement of trend.
| ||||||||
| Here are the market intelligence trend scores of the most requested Latin America stocks at 12Stocks.com (click stock name for detailed review): | |
| Scroll down this page for most comprehensive review of Latin America stocks by performance, trends, technical analysis, charts, fund plays & more | |


| 12Stocks.com: Top Performing Latin America Index Stocks | ||||||||||||||||||||||||||||||||||||||||||||||||
 The top performing Latin America Index stocks year to date are
Now, more recently, over last week, the top performing Latin America Index stocks on the move are


|
||||||||||||||||||||||||||||||||||||||||||||||||
| 12Stocks.com: Investing in Latin America Index with Stocks | |
|
The following table helps investors and traders sort through current performance and trends (as measured by market intelligence score) of various
stocks in the Latin America Index. Quick View: Move mouse or cursor over stock symbol (ticker) to view short-term technical chart and over stock name to view long term chart. Click on  to add stock symbol to your watchlist and to add stock symbol to your watchlist and  to view watchlist. Click on any ticker or stock name for detailed market intelligence report for that stock. to view watchlist. Click on any ticker or stock name for detailed market intelligence report for that stock. |
12Stocks.com Performance of Stocks in Latin America Index
| Ticker | Stock Name | Watchlist | Category | Recent Price | Market Intelligence Score | Change % | YTD Change% |
| TLRY | Tilray |   | Health Care | 2.10 | 80 | 3.96% | -8.70% |
| SNDL | Sundial Growers | | Health Care | 2.35 | 80 | 3.52% | 43.29% |
| NG | NovaGold Resources | | Materials | 3.05 | 80 | 0.99% | -18.45% |
| GTE | Gran Tierra | | Energy | 8.64 | 80 | -0.69% | 53.19% |
| APT | Alpha Pro | | Industrials | 6.09 | 78 | 0.50% | 15.12% |
| WPM | Wheaton Precious | | Materials | 52.69 | 78 | -0.64% | 6.79% |
| HBM | Hudbay Minerals | | Materials | 8.37 | 78 | 0.60% | 51.63% |
| STN | Stantec | | Services & Goods | 83.73 | 77 | 0.07% | 4.41% |
| SU | Suncor Energy | | Energy | 38.24 | 76 | 0.50% | 19.35% |
| IE | Ivanhoe Electric | | Materials | 10.33 | 75 | 2.68% | 1.92% |
| PDS | Precision Drilling | | Energy | 71.12 | 75 | 1.72% | 31.00% |
| BRFS | BRF S.A | | Consumer Staples | 3.33 | 75 | 0.91% | 19.78% |
| AGI | Alamos Gold | | Materials | 15.03 | 75 | 0.47% | 11.58% |
| NVEI | Nuvei | | Technology | 32.35 | 75 | 0.14% | 23.14% |
| OMAB | Grupo Aeroportuario | | Transports | 86.69 | 75 | -1.13% | 2.43% |
| TRP | TC Energy | | Energy | 37.62 | 74 | 3.32% | -3.76% |
| BCE | BCE | | Technology | 33.60 | 74 | 1.85% | -14.68% |
| CSIQ | Canadian Solar | | Technology | 16.79 | 74 | 1.39% | -35.99% |
| ABEV | Ambev S.A | | Consumer Staples | 2.43 | 74 | 0.83% | -13.21% |
| VALE | Vale S.A | | Materials | 12.61 | 74 | 0.72% | -20.49% |
| PLG | Platinum | | Materials | 1.30 | 73 | -3.33% | 14.47% |
| TRX | Tanzanian Gold | | Materials | 0.44 | 73 | -1.20% | 17.02% |
| SILV | SilverCrest Metals | | Materials | 8.31 | 71 | 0.36% | 26.87% |
| CM | Canadian Imperial | | Financials | 47.88 | 71 | 1.20% | -0.54% |
| FUSN | Fusion | | Health Care | 21.45 | 70 | -0.21% | 123.39% |
| To view more stocks, click on Next / Previous arrows or select different range: 0 - 25 , 25 - 50 , 50 - 75 , 75 - 100 , 100 - 125 , 125 - 150 , 150 - 175 , 175 - 200 , 200 - 225 | ||
 | Click To Change The Sort Order: By Market Cap or Company Size Performance: Year-to-date, Week and Day |  |
| Detailed Overview Of Latin America Stocks |
| Latin America Technical Overview, Leaders & Laggards, Top Latin America ETF Funds & Detailed Latin America Stocks List, Charts, Trends & More |
| Latin America: Technical Analysis, Trends & YTD Performance | |
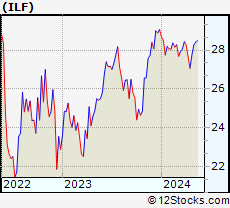
 ILF Weekly Chart |
|
| Long Term Trend: Good | |
| Medium Term Trend: Very Good | |
 ILF Daily Chart |
|
| Short Term Trend: Very Good | |
| Overall Trend Score: 77 | |
| YTD Performance: -2.75% | |
| **Trend Scores & Views Are Only For Educational Purposes And Not For Investing | |
| 12Stocks.com: Investing in Latin America Index using Exchange Traded Funds | |
|
The following table shows list of key exchange traded funds (ETF) that
help investors play Latin America stock market. For detailed view, check out our ETF Funds section of our website. Quick View: Move mouse or cursor over ETF symbol (ticker) to view short-term technical chart and over ETF name to view long term chart. Click on ticker or stock name for detailed view. Click on to add stock symbol to your watchlist and to view watchlist. |
12Stocks.com List of ETFs that track Latin America Index
| Ticker | ETF Name | Watchlist | Recent Price | Market Intelligence Score | Change % | Week % | Year-to-date % |
| ILF | Latin America 40 | | 28.26 | 77 | 1.51 | 1.8 | -2.75% |
| EWC | Canada | | 37.57 | 78 | 0.62 | -0.16 | 2.43% |
| FLN | Latin America AlphaDEX | | 20.08 | 49 | 1.21 | 1.98 | -3.42% |
| EWZ | Brazil | | 32.31 | 64 | 1.67 | 2.44 | -7.58% |
| EWW | Mexico | | 66.80 | 65 | 1.00 | -0.07 | -1.55% |
| ARGT | Argentina | | 61.33 | 100 | 4.73 | 8.88 | 19.46% |
| EWZS | Brazil Small-Cap | | 13.91 | 64 | 3.34 | 3.27 | -7.64% |
| BRF | Brazil Small-Cap | | 15.92 | 64 | 3.04 | 3.04 | -9.48% |
| BZQ | Short Brazil | | 11.48 | 36 | -3.41 | -4.89 | 14.46% |
| BRZU | Brazil Bull 3X | | 84.43 | 64 | 3.18 | 4.75 | -17.93% |
| FBZ | Brazil AlphaDEX | | 11.85 | 54 | 5.71 | 3.31 | -3.04% |
| 12Stocks.com: Charts, Trends, Fundamental Data and Performances of Latin America Stocks | |
|
We now take in-depth look at all Latin America stocks including charts, multi-period performances and overall trends (as measured by market intelligence score). One can sort Latin America stocks (click link to choose) by Daily, Weekly and by Year-to-Date performances. Also, one can sort by size of the company or by market capitalization. |
| Select Your Default Chart Type: | |||||
| |||||
| Click on stock symbol or name for detailed view. Click on to add stock symbol to your watchlist and to view watchlist. Quick View: Move mouse or cursor over "Daily" to quickly view daily technical stock chart and over "Weekly" to view weekly technical stock chart. | |||||

 | TLRY Tilray, Inc. |
| Sector: Health Care | |
| SubSector: Drug Manufacturers - Other | |
| MarketCap: 452.533 Millions | |
| Recent Price: 2.10 Market Intelligence Score: 80 | |
| Day Percent Change: 3.96% Day Change: 0.08 | |
| Week Change: 17.98% Year-to-date Change: -8.7% | |
| TLRY Links: Profile News Message Board | |
| Charts:- Daily , Weekly | |
| Add TLRY to Watchlist: View: Get Complete TLRY Trend Analysis ➞ | |
 | SNDL Sundial Growers Inc. |
| Sector: Health Care | |
| SubSector: Drug Manufacturers - Other | |
| MarketCap: 94.4033 Millions | |
| Recent Price: 2.35 Market Intelligence Score: 80 | |
| Day Percent Change: 3.52% Day Change: 0.08 | |
| Week Change: 16.92% Year-to-date Change: 43.3% | |
| SNDL Links: Profile News Message Board | |
| Charts:- Daily , Weekly | |
| Add SNDL to Watchlist: View: Get Complete SNDL Trend Analysis ➞ | |
 | NG NovaGold Resources Inc. |
| Sector: Materials | |
| SubSector: Gold | |
| MarketCap: 2499.49 Millions | |
| Recent Price: 3.05 Market Intelligence Score: 80 | |
| Day Percent Change: 0.99% Day Change: 0.03 | |
| Week Change: 3.74% Year-to-date Change: -18.5% | |
| NG Links: Profile News Message Board | |
| Charts:- Daily , Weekly | |
| Add NG to Watchlist: View: Get Complete NG Trend Analysis ➞ | |
 | GTE Gran Tierra Energy Inc. |
| Sector: Energy | |
| SubSector: Independent Oil & Gas | |
| MarketCap: 87.0593 Millions | |
| Recent Price: 8.64 Market Intelligence Score: 80 | |
| Day Percent Change: -0.69% Day Change: -0.06 | |
| Week Change: 3.23% Year-to-date Change: 53.2% | |
| GTE Links: Profile News Message Board | |
| Charts:- Daily , Weekly | |
| Add GTE to Watchlist: View: Get Complete GTE Trend Analysis ➞ | |
 | APT Alpha Pro Tech, Ltd. |
| Sector: Industrials | |
| SubSector: General Building Materials | |
| MarketCap: 125.953 Millions | |
| Recent Price: 6.09 Market Intelligence Score: 78 | |
| Day Percent Change: 0.50% Day Change: 0.03 | |
| Week Change: -0.98% Year-to-date Change: 15.1% | |
| APT Links: Profile News Message Board | |
| Charts:- Daily , Weekly | |
| Add APT to Watchlist: View: Get Complete APT Trend Analysis ➞ | |
 | WPM Wheaton Precious Metals Corp. |
| Sector: Materials | |
| SubSector: Silver | |
| MarketCap: 11349.6 Millions | |
| Recent Price: 52.69 Market Intelligence Score: 78 | |
| Day Percent Change: -0.64% Day Change: -0.34 | |
| Week Change: -2.43% Year-to-date Change: 6.8% | |
| WPM Links: Profile News Message Board | |
| Charts:- Daily , Weekly | |
| Add WPM to Watchlist: View: Get Complete WPM Trend Analysis ➞ | |
 | HBM Hudbay Minerals Inc. |
| Sector: Materials | |
| SubSector: Copper | |
| MarketCap: 363.157 Millions | |
| Recent Price: 8.37 Market Intelligence Score: 78 | |
| Day Percent Change: 0.60% Day Change: 0.05 | |
| Week Change: -3.01% Year-to-date Change: 51.6% | |
| HBM Links: Profile News Message Board | |
| Charts:- Daily , Weekly | |
| Add HBM to Watchlist: View: Get Complete HBM Trend Analysis ➞ | |
 | STN Stantec Inc. |
| Sector: Services & Goods | |
| SubSector: Business Services | |
| MarketCap: 2855.92 Millions | |
| Recent Price: 83.73 Market Intelligence Score: 77 | |
| Day Percent Change: 0.07% Day Change: 0.06 | |
| Week Change: 2.31% Year-to-date Change: 4.4% | |
| STN Links: Profile News Message Board | |
| Charts:- Daily , Weekly | |
| Add STN to Watchlist: View: Get Complete STN Trend Analysis ➞ | |
 | SU Suncor Energy Inc. |
| Sector: Energy | |
| SubSector: Independent Oil & Gas | |
| MarketCap: 21550.6 Millions | |
| Recent Price: 38.24 Market Intelligence Score: 76 | |
| Day Percent Change: 0.50% Day Change: 0.19 | |
| Week Change: -2.97% Year-to-date Change: 19.4% | |
| SU Links: Profile News Message Board | |
| Charts:- Daily , Weekly | |
| Add SU to Watchlist: View: Get Complete SU Trend Analysis ➞ | |
 | IE Ivanhoe Electric Inc. |
| Sector: Materials | |
| SubSector: Copper | |
| MarketCap: 1200 Millions | |
| Recent Price: 10.33 Market Intelligence Score: 75 | |
| Day Percent Change: 2.68% Day Change: 0.27 | |
| Week Change: -3.28% Year-to-date Change: 1.9% | |
| IE Links: Profile News Message Board | |
| Charts:- Daily , Weekly | |
| Add IE to Watchlist: View: Get Complete IE Trend Analysis ➞ | |
 | PDS Precision Drilling Corporation |
| Sector: Energy | |
| SubSector: Oil & Gas Equipment & Services | |
| MarketCap: 103.461 Millions | |
| Recent Price: 71.12 Market Intelligence Score: 75 | |
| Day Percent Change: 1.72% Day Change: 1.20 | |
| Week Change: -1.63% Year-to-date Change: 31.0% | |
| PDS Links: Profile News Message Board | |
| Charts:- Daily , Weekly | |
| Add PDS to Watchlist: View: Get Complete PDS Trend Analysis ➞ | |
 | BRFS BRF S.A. |
| Sector: Consumer Staples | |
| SubSector: Meat Products | |
| MarketCap: 2635.51 Millions | |
| Recent Price: 3.33 Market Intelligence Score: 75 | |
| Day Percent Change: 0.91% Day Change: 0.03 | |
| Week Change: -3.48% Year-to-date Change: 19.8% | |
| BRFS Links: Profile News Message Board | |
| Charts:- Daily , Weekly | |
| Add BRFS to Watchlist: View: Get Complete BRFS Trend Analysis ➞ | |
 | AGI Alamos Gold Inc. |
| Sector: Materials | |
| SubSector: Gold | |
| MarketCap: 1740.39 Millions | |
| Recent Price: 15.03 Market Intelligence Score: 75 | |
| Day Percent Change: 0.47% Day Change: 0.07 | |
| Week Change: -1.76% Year-to-date Change: 11.6% | |
| AGI Links: Profile News Message Board | |
| Charts:- Daily , Weekly | |
| Add AGI to Watchlist: View: Get Complete AGI Trend Analysis ➞ | |
 | NVEI Nuvei Corporation |
| Sector: Technology | |
| SubSector: Software - Infrastructure | |
| MarketCap: 5490 Millions | |
| Recent Price: 32.35 Market Intelligence Score: 75 | |
| Day Percent Change: 0.14% Day Change: 0.05 | |
| Week Change: 0.17% Year-to-date Change: 23.1% | |
| NVEI Links: Profile News Message Board | |
| Charts:- Daily , Weekly | |
| Add NVEI to Watchlist: View: Get Complete NVEI Trend Analysis ➞ | |
 | OMAB Grupo Aeroportuario del Centro Norte, S.A.B. de C.V. |
| Sector: Transports | |
| SubSector: Air Services, Other | |
| MarketCap: 1196.38 Millions | |
| Recent Price: 86.69 Market Intelligence Score: 75 | |
| Day Percent Change: -1.13% Day Change: -0.99 | |
| Week Change: -1.62% Year-to-date Change: 2.4% | |
| OMAB Links: Profile News Message Board | |
| Charts:- Daily , Weekly | |
| Add OMAB to Watchlist: View: Get Complete OMAB Trend Analysis ➞ | |
 | TRP TC Energy Corporation |
| Sector: Energy | |
| SubSector: Oil & Gas Pipelines | |
| MarketCap: 44071.1 Millions | |
| Recent Price: 37.62 Market Intelligence Score: 74 | |
| Day Percent Change: 3.32% Day Change: 1.21 | |
| Week Change: 4.21% Year-to-date Change: -3.8% | |
| TRP Links: Profile News Message Board | |
| Charts:- Daily , Weekly | |
| Add TRP to Watchlist: View: Get Complete TRP Trend Analysis ➞ | |
 | BCE BCE Inc. |
| Sector: Technology | |
| SubSector: Telecom Services - Domestic | |
| MarketCap: 37288.3 Millions | |
| Recent Price: 33.60 Market Intelligence Score: 74 | |
| Day Percent Change: 1.85% Day Change: 0.61 | |
| Week Change: 3% Year-to-date Change: -14.7% | |
| BCE Links: Profile News Message Board | |
| Charts:- Daily , Weekly | |
| Add BCE to Watchlist: View: Get Complete BCE Trend Analysis ➞ | |
 | CSIQ Canadian Solar Inc. |
| Sector: Technology | |
| SubSector: Semiconductor - Specialized | |
| MarketCap: 957.96 Millions | |
| Recent Price: 16.79 Market Intelligence Score: 74 | |
| Day Percent Change: 1.39% Day Change: 0.23 | |
| Week Change: 10.83% Year-to-date Change: -36.0% | |
| CSIQ Links: Profile News Message Board | |
| Charts:- Daily , Weekly | |
| Add CSIQ to Watchlist: View: Get Complete CSIQ Trend Analysis ➞ | |
 | ABEV Ambev S.A. |
| Sector: Consumer Staples | |
| SubSector: Beverages - Brewers | |
| MarketCap: 37753.5 Millions | |
| Recent Price: 2.43 Market Intelligence Score: 74 | |
| Day Percent Change: 0.83% Day Change: 0.02 | |
| Week Change: 4.29% Year-to-date Change: -13.2% | |
| ABEV Links: Profile News Message Board | |
| Charts:- Daily , Weekly | |
| Add ABEV to Watchlist: View: Get Complete ABEV Trend Analysis ➞ | |
 | VALE Vale S.A. |
| Sector: Materials | |
| SubSector: Industrial Metals & Minerals | |
| MarketCap: 43601 Millions | |
| Recent Price: 12.61 Market Intelligence Score: 74 | |
| Day Percent Change: 0.72% Day Change: 0.09 | |
| Week Change: 2.69% Year-to-date Change: -20.5% | |
| VALE Links: Profile News Message Board | |
| Charts:- Daily , Weekly | |
| Add VALE to Watchlist: View: Get Complete VALE Trend Analysis ➞ | |
 | PLG Platinum Group Metals Ltd. |
| Sector: Materials | |
| SubSector: Industrial Metals & Minerals | |
| MarketCap: 77.591 Millions | |
| Recent Price: 1.30 Market Intelligence Score: 73 | |
| Day Percent Change: -3.33% Day Change: -0.05 | |
| Week Change: -5.43% Year-to-date Change: 14.5% | |
| PLG Links: Profile News Message Board | |
| Charts:- Daily , Weekly | |
| Add PLG to Watchlist: View: Get Complete PLG Trend Analysis ➞ | |
 | TRX Tanzanian Gold Corporation |
| Sector: Materials | |
| SubSector: Gold | |
| MarketCap: 95.9619 Millions | |
| Recent Price: 0.44 Market Intelligence Score: 73 | |
| Day Percent Change: -1.20% Day Change: -0.01 | |
| Week Change: -3.28% Year-to-date Change: 17.0% | |
| TRX Links: Profile News Message Board | |
| Charts:- Daily , Weekly | |
| Add TRX to Watchlist: View: Get Complete TRX Trend Analysis ➞ | |
 | SILV SilverCrest Metals Inc. |
| Sector: Materials | |
| SubSector: Silver | |
| MarketCap: 555.356 Millions | |
| Recent Price: 8.31 Market Intelligence Score: 71 | |
| Day Percent Change: 0.36% Day Change: 0.03 | |
| Week Change: -2.58% Year-to-date Change: 26.9% | |
| SILV Links: Profile News Message Board | |
| Charts:- Daily , Weekly | |
| Add SILV to Watchlist: View: Get Complete SILV Trend Analysis ➞ | |
 | CM Canadian Imperial Bank of Commerce |
| Sector: Financials | |
| SubSector: Money Center Banks | |
| MarketCap: 27150.5 Millions | |
| Recent Price: 47.88 Market Intelligence Score: 71 | |
| Day Percent Change: 1.20% Day Change: 0.57 | |
| Week Change: 0.13% Year-to-date Change: -0.5% | |
| CM Links: Profile News Message Board | |
| Charts:- Daily , Weekly | |
| Add CM to Watchlist: View: Get Complete CM Trend Analysis ➞ | |
 | FUSN Fusion Pharmaceuticals Inc. |
| Sector: Health Care | |
| SubSector: Biotechnology | |
| MarketCap: 52487 Millions | |
| Recent Price: 21.45 Market Intelligence Score: 70 | |
| Day Percent Change: -0.21% Day Change: -0.04 | |
| Week Change: 0.12% Year-to-date Change: 123.4% | |
| FUSN Links: Profile News Message Board | |
| Charts:- Daily , Weekly | |
| Add FUSN to Watchlist: View: Get Complete FUSN Trend Analysis ➞ | |
| To view more stocks, click on Next / Previous arrows or select different range: 0 - 25 , 25 - 50 , 50 - 75 , 75 - 100 , 100 - 125 , 125 - 150 , 150 - 175 , 175 - 200 , 200 - 225 | ||
| Click To Change The Sort Order: By Market Cap or Company Size Performance: Year-to-date, Week and Day | |
| Select Chart Type: | ||
 Best Stocks Today 12Stocks.com |
© 2024 12Stocks.com Terms & Conditions Privacy Contact Us
All Information Provided Only For Education And Not To Be Used For Investing or Trading. See Terms & Conditions


One More Thing ... Get Best Stocks Delivered Daily!
Never Ever Miss A Move With Our Top Ten Stocks Lists
Find Best Stocks In Any Market - Bull or Bear Market
Take A Peek At Our Top Ten Stocks Lists: Daily, Weekly, Year-to-Date & Top Trends
Find Best Stocks In Any Market - Bull or Bear Market
Take A Peek At Our Top Ten Stocks Lists: Daily, Weekly, Year-to-Date & Top Trends
Latin America Stocks With Best Up Trends [0-bearish to 100-bullish]: Banco BBVA[100], Grupo Financiero[100], Banco Macro[100], Grupo Supervielle[100], TransAlta [100], Pampa Energia[100], YPF Sociedad[100], Brookfield Renewable[100], Algonquin Power[100], Central Puerto[100], Transportadora de[100]
Best Latin America Stocks Year-to-Date:
Aurora Cannabis[1315.37%], Fusion [123.39%], Banco Macro[109.83%], Canopy Growth[100.39%], Grupo Financiero[98.78%], Banco BBVA[92.83%], Grupo Supervielle[69.21%], McEwen Mining[63.11%], D-Wave Quantum[60.13%], Hudbay Minerals[51.63%], Embraer S.A[46.12%] Best Latin America Stocks This Week:
Brookfield Renewable[20.81%], Tilray [17.98%], Banco Macro[17.21%], MercadoLibre [15.97%], Canopy Growth[14.93%], Transportadora de[14.22%], Grupo Supervielle[13.93%], Banco BBVA[13.41%], Azul S.A[13.03%], Grupo Financiero[11.79%], Zymeworks [11.38%] Best Latin America Stocks Daily:
AbCellera Biologics[11.49%], Banco BBVA[9.27%], Lion Electric[8.71%], Azul S.A[8.63%], Telecom Argentina[8.47%], MercadoLibre [8.27%], Grupo Financiero[7.62%], Banco Macro[7.32%], Nu [6.13%], Grupo Televisa[6.02%], XP [5.96%]