
 Login Sign Up


| |||||
 |  | ||||

| 12Stocks.com Market Intelligence |
Best Latin America Stocks
|
|
| Quick Read: Top Latin America Stocks By Performances & Trends: Daily, Weekly, Year-to-Date, Market Cap (Size) & Technical Trends | |||
| Best Latin America Views: Quick Browse View, Summary & Slide Show | |||
| 12Stocks.com Latin America Stocks Performances & Trends Daily | |||||||||
|
|  The overall market intelligence score is 35 (0-bearish to 100-bullish) which puts Latin America index in short term bearish to neutral trend. The market intelligence score from previous trading session is 25 and hence an improvement of trend.
| ||||||||
| Here are the market intelligence trend scores of the most requested Latin America stocks at 12Stocks.com (click stock name for detailed review): | |
| Scroll down this page for most comprehensive review of Latin America stocks by performance, trends, technical analysis, charts, fund plays & more | |


| 12Stocks.com: Top Performing Latin America Index Stocks | ||||||||||||||||||||||||||||||||||||||||||||||||
 The top performing Latin America Index stocks year to date are
Now, more recently, over last week, the top performing Latin America Index stocks on the move are


|
||||||||||||||||||||||||||||||||||||||||||||||||
| 12Stocks.com: Investing in Latin America Index with Stocks | |
|
The following table helps investors and traders sort through current performance and trends (as measured by market intelligence score) of various
stocks in the Latin America Index. Quick View: Move mouse or cursor over stock symbol (ticker) to view short-term technical chart and over stock name to view long term chart. Click on  to add stock symbol to your watchlist and to add stock symbol to your watchlist and  to view watchlist. Click on any ticker or stock name for detailed market intelligence report for that stock. to view watchlist. Click on any ticker or stock name for detailed market intelligence report for that stock. |
12Stocks.com Performance of Stocks in Latin America Index
| Ticker | Stock Name | Watchlist | Category | Recent Price | Market Intelligence Score | Change % | YTD Change% |
| AMBI | Ambipar Emergency |   | Industrials | 4.32 | 35 | 0.56% | -44.99% |
| PBA | Pembina Pipeline | | Energy | 34.69 | 33 | -1.45% | 0.78% |
| APT | Alpha Pro | | Industrials | 5.93 | 33 | -0.67% | 12.10% |
| EPIX | ESSA Pharma | | Health Care | 6.80 | 32 | 5.75% | 3.98% |
| BBAR | Banco BBVA | | Financials | 9.68 | 32 | 1.26% | 77.94% |
| AFYA | Afya | | Services & Goods | 17.28 | 32 | 0.29% | -21.20% |
| STKL | SunOpta | | Consumer Staples | 6.03 | 32 | -7.94% | 10.24% |
| CRON | Cronos | | Health Care | 2.72 | 32 | -7.48% | 30.14% |
| NOA | North American | | Energy | 21.28 | 32 | -1.85% | 2.06% |
| CCJ | Cameco | | Materials | 46.92 | 31 | 2.83% | 8.86% |
| IMO | Imperial Oil | | Energy | 67.39 | 31 | -2.26% | 17.84% |
| DESP | Despegar.com | | Services & Goods | 12.07 | 31 | -0.98% | 27.59% |
| BGI | Birks | | Services & Goods | 2.61 | 30 | 8.30% | -44.35% |
| GOOS | Canada Goose | | Consumer Staples | 11.24 | 30 | -0.44% | -5.15% |
| CM | Canadian Imperial | | Financials | 46.88 | 28 | 0.41% | -2.62% |
| FMX | Fomento Economico | | Consumer Staples | 118.09 | 28 | 0.37% | -9.41% |
| EDSA | Edesa Biotech | | Health Care | 4.44 | 28 | 0.00% | -4.25% |
| RCI | Rogers | | Technology | 37.44 | 28 | -0.08% | -20.02% |
| RPTX | Repare | | Health Care | 3.34 | 27 | 7.74% | -54.25% |
| VIV | Telefonica Brasil | | Technology | 9.31 | 27 | 0.76% | -14.90% |
| ITUB | Itau Unibanco | | Financials | 6.09 | 27 | 0.66% | -12.37% |
| SID | Companhia Siderurgica | | Materials | 2.69 | 27 | 0.00% | -31.55% |
| BBDO | Banco Bradesco | | Financials | 2.34 | 27 | -0.85% | -26.42% |
| NTR | Nutrien | | Materials | 52.47 | 27 | -0.57% | -6.85% |
| STN | Stantec | | Services & Goods | 80.42 | 27 | 1.03% | 0.29% |
| To view more stocks, click on Next / Previous arrows or select different range: 0 - 25 , 25 - 50 , 50 - 75 , 75 - 100 , 100 - 125 , 125 - 150 , 150 - 175 , 175 - 200 , 200 - 225 | ||
 | Click To Change The Sort Order: By Market Cap or Company Size Performance: Year-to-date, Week and Day |  |
| Detailed Overview Of Latin America Stocks |
| Latin America Technical Overview, Leaders & Laggards, Top Latin America ETF Funds & Detailed Latin America Stocks List, Charts, Trends & More |
| Latin America: Technical Analysis, Trends & YTD Performance | |
 ILF Weekly Chart |
|
| Long Term Trend: Not Good | |
| Medium Term Trend: Very Good | |
 ILF Daily Chart |
|
| Short Term Trend: Deteriorating | |
| Overall Trend Score: 35 | |
| YTD Performance: -5.54% | |
| **Trend Scores & Views Are Only For Educational Purposes And Not For Investing | |
| 12Stocks.com: Investing in Latin America Index using Exchange Traded Funds | |
|
The following table shows list of key exchange traded funds (ETF) that
help investors play Latin America stock market. For detailed view, check out our ETF Funds section of our website. Quick View: Move mouse or cursor over ETF symbol (ticker) to view short-term technical chart and over ETF name to view long term chart. Click on ticker or stock name for detailed view. Click on to add stock symbol to your watchlist and to view watchlist. |
12Stocks.com List of ETFs that track Latin America Index
| Ticker | ETF Name | Watchlist | Recent Price | Market Intelligence Score | Change % | Week % | Year-to-date % |
| ILF | Latin America 40 | | 27.45 | 35 | 0.26 | -1.12 | -5.54% |
| EWC | Canada | | 36.94 | 39 | 0.05 | -1.83 | 0.71% |
| FLN | Latin America AlphaDEX | | 19.48 | 17 | 0.23 | -1.09 | -6.33% |
| EWZ | Brazil | | 31.15 | 57 | 0.39 | -1.24 | -10.9% |
| EWW | Mexico | | 65.93 | 51 | 0.69 | -1.38 | -2.83% |
| ARGT | Argentina | | 57.42 | 37 | 0.00 | 1.94 | 11.84% |
| EWZS | Brazil Small-Cap | | 13.23 | 24 | 0.92 | -1.78 | -12.15% |
| BRF | Brazil Small-Cap | | 15.00 | 7 | -0.27 | -2.91 | -14.71% |
| BZQ | Short Brazil | | 12.29 | 81 | -1.21 | 1.82 | 22.53% |
| BRZU | Brazil Bull 3X | | 79.04 | 17 | 1.26 | -1.94 | -23.17% |
| FBZ | Brazil AlphaDEX | | 11.22 | 15 | -0.10 | -2.18 | -8.2% |
| 12Stocks.com: Charts, Trends, Fundamental Data and Performances of Latin America Stocks | |
|
We now take in-depth look at all Latin America stocks including charts, multi-period performances and overall trends (as measured by market intelligence score). One can sort Latin America stocks (click link to choose) by Daily, Weekly and by Year-to-Date performances. Also, one can sort by size of the company or by market capitalization. |
| Select Your Default Chart Type: | |||||
| |||||
| Click on stock symbol or name for detailed view. Click on to add stock symbol to your watchlist and to view watchlist. Quick View: Move mouse or cursor over "Daily" to quickly view daily technical stock chart and over "Weekly" to view weekly technical stock chart. | |||||

 | AMBI Ambipar Emergency Response |
| Sector: Industrials | |
| SubSector: Waste Management | |
| MarketCap: 462 Millions | |
| Recent Price: 4.32 Market Intelligence Score: 35 | |
| Day Percent Change: 0.56% Day Change: 0.02 | |
| Week Change: 0.56% Year-to-date Change: -45.0% | |
| AMBI Links: Profile News Message Board | |
| Charts:- Daily , Weekly | |
| Add AMBI to Watchlist: View: Get Complete AMBI Trend Analysis ➞ | |
 | PBA Pembina Pipeline Corporation |
| Sector: Energy | |
| SubSector: Oil & Gas Pipelines | |
| MarketCap: 8813.35 Millions | |
| Recent Price: 34.69 Market Intelligence Score: 33 | |
| Day Percent Change: -1.45% Day Change: -0.51 | |
| Week Change: -3.15% Year-to-date Change: 0.8% | |
| PBA Links: Profile News Message Board | |
| Charts:- Daily , Weekly | |
| Add PBA to Watchlist: View: Get Complete PBA Trend Analysis ➞ | |
 | APT Alpha Pro Tech, Ltd. |
| Sector: Industrials | |
| SubSector: General Building Materials | |
| MarketCap: 125.953 Millions | |
| Recent Price: 5.93 Market Intelligence Score: 33 | |
| Day Percent Change: -0.67% Day Change: -0.04 | |
| Week Change: -3.58% Year-to-date Change: 12.1% | |
| APT Links: Profile News Message Board | |
| Charts:- Daily , Weekly | |
| Add APT to Watchlist: View: Get Complete APT Trend Analysis ➞ | |
 | EPIX ESSA Pharma Inc. |
| Sector: Health Care | |
| SubSector: Biotechnology | |
| MarketCap: 70.5785 Millions | |
| Recent Price: 6.80 Market Intelligence Score: 32 | |
| Day Percent Change: 5.75% Day Change: 0.37 | |
| Week Change: 11.84% Year-to-date Change: 4.0% | |
| EPIX Links: Profile News Message Board | |
| Charts:- Daily , Weekly | |
| Add EPIX to Watchlist: View: Get Complete EPIX Trend Analysis ➞ | |
 | BBAR Banco BBVA Argentina S.A. |
| Sector: Financials | |
| SubSector: Foreign Regional Banks | |
| MarketCap: 895.479 Millions | |
| Recent Price: 9.68 Market Intelligence Score: 32 | |
| Day Percent Change: 1.26% Day Change: 0.12 | |
| Week Change: 4.65% Year-to-date Change: 77.9% | |
| BBAR Links: Profile News Message Board | |
| Charts:- Daily , Weekly | |
| Add BBAR to Watchlist: View: Get Complete BBAR Trend Analysis ➞ | |
 | AFYA Afya Limited |
| Sector: Services & Goods | |
| SubSector: Education & Training Services | |
| MarketCap: 1559.26 Millions | |
| Recent Price: 17.28 Market Intelligence Score: 32 | |
| Day Percent Change: 0.29% Day Change: 0.05 | |
| Week Change: -3.68% Year-to-date Change: -21.2% | |
| AFYA Links: Profile News Message Board | |
| Charts:- Daily , Weekly | |
| Add AFYA to Watchlist: View: Get Complete AFYA Trend Analysis ➞ | |
 | STKL SunOpta Inc. |
| Sector: Consumer Staples | |
| SubSector: Processed & Packaged Goods | |
| MarketCap: 174.548 Millions | |
| Recent Price: 6.03 Market Intelligence Score: 32 | |
| Day Percent Change: -7.94% Day Change: -0.52 | |
| Week Change: -9.87% Year-to-date Change: 10.2% | |
| STKL Links: Profile News Message Board | |
| Charts:- Daily , Weekly | |
| Add STKL to Watchlist: View: Get Complete STKL Trend Analysis ➞ | |
 | CRON Cronos Group Inc. |
| Sector: Health Care | |
| SubSector: Biotechnology | |
| MarketCap: 1935.95 Millions | |
| Recent Price: 2.72 Market Intelligence Score: 32 | |
| Day Percent Change: -7.48% Day Change: -0.22 | |
| Week Change: 5.02% Year-to-date Change: 30.1% | |
| CRON Links: Profile News Message Board | |
| Charts:- Daily , Weekly | |
| Add CRON to Watchlist: View: Get Complete CRON Trend Analysis ➞ | |
 | NOA North American Construction Group Ltd. |
| Sector: Energy | |
| SubSector: Oil & Gas Equipment & Services | |
| MarketCap: 160.461 Millions | |
| Recent Price: 21.28 Market Intelligence Score: 32 | |
| Day Percent Change: -1.85% Day Change: -0.40 | |
| Week Change: -3.58% Year-to-date Change: 2.1% | |
| NOA Links: Profile News Message Board | |
| Charts:- Daily , Weekly | |
| Add NOA to Watchlist: View: Get Complete NOA Trend Analysis ➞ | |
 | CCJ Cameco Corporation |
| Sector: Materials | |
| SubSector: Industrial Metals & Minerals | |
| MarketCap: 2722.9 Millions | |
| Recent Price: 46.92 Market Intelligence Score: 31 | |
| Day Percent Change: 2.83% Day Change: 1.29 | |
| Week Change: -4.92% Year-to-date Change: 8.9% | |
| CCJ Links: Profile News Message Board | |
| Charts:- Daily , Weekly | |
| Add CCJ to Watchlist: View: Get Complete CCJ Trend Analysis ➞ | |
 | IMO Imperial Oil Limited |
| Sector: Energy | |
| SubSector: Major Integrated Oil & Gas | |
| MarketCap: 8171.25 Millions | |
| Recent Price: 67.39 Market Intelligence Score: 31 | |
| Day Percent Change: -2.26% Day Change: -1.56 | |
| Week Change: -4.68% Year-to-date Change: 17.8% | |
| IMO Links: Profile News Message Board | |
| Charts:- Daily , Weekly | |
| Add IMO to Watchlist: View: Get Complete IMO Trend Analysis ➞ | |
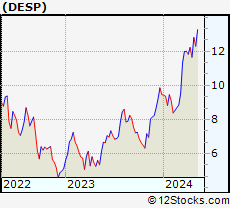 | DESP Despegar.com, Corp. |
| Sector: Services & Goods | |
| SubSector: Lodging | |
| MarketCap: 547.536 Millions | |
| Recent Price: 12.07 Market Intelligence Score: 31 | |
| Day Percent Change: -0.98% Day Change: -0.12 | |
| Week Change: -5.78% Year-to-date Change: 27.6% | |
| DESP Links: Profile News Message Board | |
| Charts:- Daily , Weekly | |
| Add DESP to Watchlist: View: Get Complete DESP Trend Analysis ➞ | |
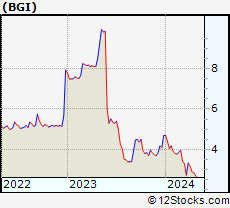 | BGI Birks Group Inc. |
| Sector: Services & Goods | |
| SubSector: Jewelry Stores | |
| MarketCap: 9 Millions | |
| Recent Price: 2.61 Market Intelligence Score: 30 | |
| Day Percent Change: 8.30% Day Change: 0.20 | |
| Week Change: -3.33% Year-to-date Change: -44.4% | |
| BGI Links: Profile News Message Board | |
| Charts:- Daily , Weekly | |
| Add BGI to Watchlist: View: Get Complete BGI Trend Analysis ➞ | |
 | GOOS Canada Goose Holdings Inc. |
| Sector: Consumer Staples | |
| SubSector: Textile - Apparel Clothing | |
| MarketCap: 881.465 Millions | |
| Recent Price: 11.24 Market Intelligence Score: 30 | |
| Day Percent Change: -0.44% Day Change: -0.05 | |
| Week Change: -0.27% Year-to-date Change: -5.2% | |
| GOOS Links: Profile News Message Board | |
| Charts:- Daily , Weekly | |
| Add GOOS to Watchlist: View: Get Complete GOOS Trend Analysis ➞ | |
 | CM Canadian Imperial Bank of Commerce |
| Sector: Financials | |
| SubSector: Money Center Banks | |
| MarketCap: 27150.5 Millions | |
| Recent Price: 46.88 Market Intelligence Score: 28 | |
| Day Percent Change: 0.41% Day Change: 0.19 | |
| Week Change: -1.97% Year-to-date Change: -2.6% | |
| CM Links: Profile News Message Board | |
| Charts:- Daily , Weekly | |
| Add CM to Watchlist: View: Get Complete CM Trend Analysis ➞ | |
 | FMX Fomento Economico Mexicano, S.A.B. de C.V. |
| Sector: Consumer Staples | |
| SubSector: Beverages - Brewers | |
| MarketCap: 22018.7 Millions | |
| Recent Price: 118.09 Market Intelligence Score: 28 | |
| Day Percent Change: 0.37% Day Change: 0.43 | |
| Week Change: -0.71% Year-to-date Change: -9.4% | |
| FMX Links: Profile News Message Board | |
| Charts:- Daily , Weekly | |
| Add FMX to Watchlist: View: Get Complete FMX Trend Analysis ➞ | |
 | EDSA Edesa Biotech, Inc. |
| Sector: Health Care | |
| SubSector: Biotechnology | |
| MarketCap: 19.6785 Millions | |
| Recent Price: 4.44 Market Intelligence Score: 28 | |
| Day Percent Change: 0.00% Day Change: 0.00 | |
| Week Change: 0.52% Year-to-date Change: -4.3% | |
| EDSA Links: Profile News Message Board | |
| Charts:- Daily , Weekly | |
| Add EDSA to Watchlist: View: Get Complete EDSA Trend Analysis ➞ | |
 | RCI Rogers Communications Inc. |
| Sector: Technology | |
| SubSector: Wireless Communications | |
| MarketCap: 22111.6 Millions | |
| Recent Price: 37.44 Market Intelligence Score: 28 | |
| Day Percent Change: -0.08% Day Change: -0.03 | |
| Week Change: -1.37% Year-to-date Change: -20.0% | |
| RCI Links: Profile News Message Board | |
| Charts:- Daily , Weekly | |
| Add RCI to Watchlist: View: Get Complete RCI Trend Analysis ➞ | |
 | RPTX Repare Therapeutics Inc. |
| Sector: Health Care | |
| SubSector: Biotechnology | |
| MarketCap: 13687 Millions | |
| Recent Price: 3.34 Market Intelligence Score: 27 | |
| Day Percent Change: 7.74% Day Change: 0.24 | |
| Week Change: 4.38% Year-to-date Change: -54.3% | |
| RPTX Links: Profile News Message Board | |
| Charts:- Daily , Weekly | |
| Add RPTX to Watchlist: View: Get Complete RPTX Trend Analysis ➞ | |
 | VIV Telefonica Brasil S.A. |
| Sector: Technology | |
| SubSector: Wireless Communications | |
| MarketCap: 19611.1 Millions | |
| Recent Price: 9.31 Market Intelligence Score: 27 | |
| Day Percent Change: 0.76% Day Change: 0.07 | |
| Week Change: -1.06% Year-to-date Change: -14.9% | |
| VIV Links: Profile News Message Board | |
| Charts:- Daily , Weekly | |
| Add VIV to Watchlist: View: Get Complete VIV Trend Analysis ➞ | |
 | ITUB Itau Unibanco Holding S.A. |
| Sector: Financials | |
| SubSector: Foreign Regional Banks | |
| MarketCap: 48121 Millions | |
| Recent Price: 6.09 Market Intelligence Score: 27 | |
| Day Percent Change: 0.66% Day Change: 0.04 | |
| Week Change: -3.33% Year-to-date Change: -12.4% | |
| ITUB Links: Profile News Message Board | |
| Charts:- Daily , Weekly | |
| Add ITUB to Watchlist: View: Get Complete ITUB Trend Analysis ➞ | |
 | SID Companhia Siderurgica Nacional |
| Sector: Materials | |
| SubSector: Steel & Iron | |
| MarketCap: 2087.58 Millions | |
| Recent Price: 2.69 Market Intelligence Score: 27 | |
| Day Percent Change: 0.00% Day Change: 0.00 | |
| Week Change: -2.89% Year-to-date Change: -31.6% | |
| SID Links: Profile News Message Board | |
| Charts:- Daily , Weekly | |
| Add SID to Watchlist: View: Get Complete SID Trend Analysis ➞ | |
 | BBDO Banco Bradesco S.A. |
| Sector: Financials | |
| SubSector: Foreign Regional Banks | |
| MarketCap: 27711.4 Millions | |
| Recent Price: 2.34 Market Intelligence Score: 27 | |
| Day Percent Change: -0.85% Day Change: -0.02 | |
| Week Change: -1.27% Year-to-date Change: -26.4% | |
| BBDO Links: Profile News Message Board | |
| Charts:- Daily , Weekly | |
| Add BBDO to Watchlist: View: Get Complete BBDO Trend Analysis ➞ | |
 | NTR Nutrien Ltd. |
| Sector: Materials | |
| SubSector: Agricultural Chemicals | |
| MarketCap: 15897.9 Millions | |
| Recent Price: 52.47 Market Intelligence Score: 27 | |
| Day Percent Change: -0.57% Day Change: -0.30 | |
| Week Change: -0.15% Year-to-date Change: -6.9% | |
| NTR Links: Profile News Message Board | |
| Charts:- Daily , Weekly | |
| Add NTR to Watchlist: View: Get Complete NTR Trend Analysis ➞ | |
 | STN Stantec Inc. |
| Sector: Services & Goods | |
| SubSector: Business Services | |
| MarketCap: 2855.92 Millions | |
| Recent Price: 80.42 Market Intelligence Score: 27 | |
| Day Percent Change: 1.03% Day Change: 0.82 | |
| Week Change: -1.74% Year-to-date Change: 0.3% | |
| STN Links: Profile News Message Board | |
| Charts:- Daily , Weekly | |
| Add STN to Watchlist: View: Get Complete STN Trend Analysis ➞ | |
| To view more stocks, click on Next / Previous arrows or select different range: 0 - 25 , 25 - 50 , 50 - 75 , 75 - 100 , 100 - 125 , 125 - 150 , 150 - 175 , 175 - 200 , 200 - 225 | ||
| Click To Change The Sort Order: By Market Cap or Company Size Performance: Year-to-date, Week and Day | |
| Select Chart Type: | ||
 Best Stocks Today 12Stocks.com |
© 2024 12Stocks.com Terms & Conditions Privacy Contact Us
All Information Provided Only For Education And Not To Be Used For Investing or Trading. See Terms & Conditions


One More Thing ... Get Best Stocks Delivered Daily!
Never Ever Miss A Move With Our Top Ten Stocks Lists
Find Best Stocks In Any Market - Bull or Bear Market
Take A Peek At Our Top Ten Stocks Lists: Daily, Weekly, Year-to-Date & Top Trends
Find Best Stocks In Any Market - Bull or Bear Market
Take A Peek At Our Top Ten Stocks Lists: Daily, Weekly, Year-to-Date & Top Trends
Latin America Stocks With Best Up Trends [0-bearish to 100-bullish]: Brookfield Renewable[100], New Gold[100], Transportadora de[100], CAE [100], Descartes Systems[100], Mercer [100], City Office[100], Grupo Financiero[100], Algonquin Power[95], Sandstorm Gold[95], YPF Sociedad[95]
Best Latin America Stocks Year-to-Date:
Aurora Cannabis[1443.47%], Canopy Growth[124.27%], Fusion [123.13%], Banco Macro[90.49%], Grupo Financiero[87.43%], Banco BBVA[77.94%], D-Wave Quantum[60.7%], McEwen Mining[60.19%], Grupo Supervielle[58.37%], Hudbay Minerals[50.91%], OrganiGram [45.8%] Best Latin America Stocks This Week:
Canopy Growth[28.62%], Tilray [12.92%], Aurora Cannabis[9.7%], Brookfield Renewable[9.18%], Canadian Solar[7.92%], Transportadora de[7.67%], Grupo Supervielle[6.63%], Banco Macro[6.4%], Xenon [6.16%], Zymeworks [6.05%], Aurinia [6.01%] Best Latin America Stocks Daily:
Brookfield Renewable[10.90%], New Gold[8.62%], Repare [7.74%], Lavoro [5.27%], NovaGold Resources[4.48%], Lion Electric[4.44%], Fortuna Silver[3.30%], Denison Mines[3.03%], Transportadora de[2.96%], D-Wave Quantum[2.92%], Cameco [2.83%]