
 Login Sign Up


| |||||
 |  | ||||

| 12Stocks.com Market Intelligence |
Best Latin America Stocks
|
|
| Quick Read: Top Latin America Stocks By Performances & Trends: Daily, Weekly, Year-to-Date, Market Cap (Size) & Technical Trends | |||
| Best Latin America Views: Quick Browse View, Summary & Slide Show | |||
| 12Stocks.com Latin America Stocks Performances & Trends Daily | |||||||||
|
|  The overall market intelligence score is 63 (0-bearish to 100-bullish) which puts Latin America index in short term neutral to bullish trend. The market intelligence score from previous trading session is 71 and hence a deterioration of trend.
| ||||||||
| Here are the market intelligence trend scores of the most requested Latin America stocks at 12Stocks.com (click stock name for detailed review): | |
| Scroll down this page for most comprehensive review of Latin America stocks by performance, trends, technical analysis, charts, fund plays & more | |


| 12Stocks.com: Top Performing Latin America Index Stocks | ||||||||||||||||||||||||||||||||||||||||||||||||
 The top performing Latin America Index stocks year to date are
Now, more recently, over last week, the top performing Latin America Index stocks on the move are


|
||||||||||||||||||||||||||||||||||||||||||||||||
| 12Stocks.com: Investing in Latin America Index with Stocks | |
|
The following table helps investors and traders sort through current performance and trends (as measured by market intelligence score) of various
stocks in the Latin America Index. Quick View: Move mouse or cursor over stock symbol (ticker) to view short-term technical chart and over stock name to view long term chart. Click on  to add stock symbol to your watchlist and to add stock symbol to your watchlist and  to view watchlist. Click on any ticker or stock name for detailed market intelligence report for that stock. to view watchlist. Click on any ticker or stock name for detailed market intelligence report for that stock. |
12Stocks.com Performance of Stocks in Latin America Index
| Ticker | Stock Name | Watchlist | Category | Recent Price | Market Intelligence Score | Change % | YTD Change% |
| ABCL | AbCellera Biologics |   | Health Care | 3.70 | 5 | -3.14% | -34.51% |
| GFL | GFL Environmental | | Industrials | 31.43 | 0 | 0.58% | -8.92% |
| PBR | Petroleo Brasileiro | | Energy | 15.56 | 0 | -6.77% | -2.57% |
| ARCO | Arcos Dorados | | Services & Goods | 10.57 | 0 | -5.71% | -16.71% |
| VTRU | Vitru | | Consumer Staples | 10.38 | 0 | -5.42% | -34.39% |
| BIOX | Bioceres Crop | | Industrials | 11.50 | 0 | -4.17% | -16.24% |
| MOGO | Mogo | | Financials | 1.66 | 0 | -2.35% | -10.27% |
| ACST | Acasti Pharma | | Health Care | 2.73 | 0 | -2.15% | -5.54% |
| QSR | Restaurant Brands | | Services & Goods | 71.43 | 0 | -0.45% | -8.58% |
| To view more stocks, click on Next / Previous arrows or select different range: 0 - 25 , 25 - 50 , 50 - 75 , 75 - 100 , 100 - 125 , 125 - 150 , 150 - 175 , 175 - 200 , 200 - 225 | ||
 | Click To Change The Sort Order: By Market Cap or Company Size Performance: Year-to-date, Week and Day |  |
| Detailed Overview Of Latin America Stocks |
| Latin America Technical Overview, Leaders & Laggards, Top Latin America ETF Funds & Detailed Latin America Stocks List, Charts, Trends & More |
| Latin America: Technical Analysis, Trends & YTD Performance | |
 ILF Weekly Chart |
|
| Long Term Trend: Good | |
| Medium Term Trend: Very Good | |
 ILF Daily Chart |
|
| Short Term Trend: Good | |
| Overall Trend Score: 63 | |
| YTD Performance: -2.13% | |
| **Trend Scores & Views Are Only For Educational Purposes And Not For Investing | |
| 12Stocks.com: Investing in Latin America Index using Exchange Traded Funds | |
|
The following table shows list of key exchange traded funds (ETF) that
help investors play Latin America stock market. For detailed view, check out our ETF Funds section of our website. Quick View: Move mouse or cursor over ETF symbol (ticker) to view short-term technical chart and over ETF name to view long term chart. Click on ticker or stock name for detailed view. Click on to add stock symbol to your watchlist and to view watchlist. |
12Stocks.com List of ETFs that track Latin America Index
| Ticker | ETF Name | Watchlist | Recent Price | Market Intelligence Score | Change % | Week % | Year-to-date % |
| ILF | Latin America 40 | | 28.44 | 63 | -0.18 | 0.04 | -2.13% |
| EWC | Canada | | 38.30 | 88 | 0.42 | 0.29 | 4.42% |
| FLN | Latin America AlphaDEX | | 20.22 | 77 | 1.00 | 0.95 | -2.74% |
| EWZ | Brazil | | 31.63 | 18 | -1.06 | 0.06 | -9.53% |
| EWW | Mexico | | 68.62 | 83 | 1.43 | 0.22 | 1.13% |
| ARGT | Argentina | | 64.00 | 88 | 2.83 | 2.75 | 24.66% |
| EWZS | Brazil Small-Cap | | 13.64 | 52 | 0.29 | 1.56 | -9.43% |
| BRF | Brazil Small-Cap | | 15.35 | 25 | -0.13 | 0.52 | -12.72% |
| BZQ | Short Brazil | | 12.11 | 88 | 2.54 | 1.18 | 20.74% |
| BRZU | Brazil Bull 3X | | 80.77 | 25 | -2.09 | 0.25 | -21.49% |
| FBZ | Brazil AlphaDEX | | 11.72 | 47 | 0.86 | 1.3 | -4.1% |
| 12Stocks.com: Charts, Trends, Fundamental Data and Performances of Latin America Stocks | |
|
We now take in-depth look at all Latin America stocks including charts, multi-period performances and overall trends (as measured by market intelligence score). One can sort Latin America stocks (click link to choose) by Daily, Weekly and by Year-to-Date performances. Also, one can sort by size of the company or by market capitalization. |
| Select Your Default Chart Type: | |||||
| |||||
| Click on stock symbol or name for detailed view. Click on to add stock symbol to your watchlist and to view watchlist. Quick View: Move mouse or cursor over "Daily" to quickly view daily technical stock chart and over "Weekly" to view weekly technical stock chart. | |||||

 | ABCL AbCellera Biologics Inc. |
| Sector: Health Care | |
| SubSector: Biotechnology | |
| MarketCap: 1870 Millions | |
| Recent Price: 3.70 Market Intelligence Score: 5 | |
| Day Percent Change: -3.14% Day Change: -0.12 | |
| Week Change: -3.39% Year-to-date Change: -34.5% | |
| ABCL Links: Profile News Message Board | |
| Charts:- Daily , Weekly | |
| Add ABCL to Watchlist: View: Get Complete ABCL Trend Analysis ➞ | |
 | GFL GFL Environmental Inc. |
| Sector: Industrials | |
| SubSector: Waste Management | |
| MarketCap: 87627 Millions | |
| Recent Price: 31.43 Market Intelligence Score: 0 | |
| Day Percent Change: 0.58% Day Change: 0.18 | |
| Week Change: -3.11% Year-to-date Change: -8.9% | |
| GFL Links: Profile News Message Board | |
| Charts:- Daily , Weekly | |
| Add GFL to Watchlist: View: Get Complete GFL Trend Analysis ➞ | |
 | PBR Petroleo Brasileiro S.A. - Petrobras |
| Sector: Energy | |
| SubSector: Oil & Gas Drilling & Exploration | |
| MarketCap: 38939.2 Millions | |
| Recent Price: 15.56 Market Intelligence Score: 0 | |
| Day Percent Change: -6.77% Day Change: -1.13 | |
| Week Change: -8.9% Year-to-date Change: -2.6% | |
| PBR Links: Profile News Message Board | |
| Charts:- Daily , Weekly | |
| Add PBR to Watchlist: View: Get Complete PBR Trend Analysis ➞ | |
 | ARCO Arcos Dorados Holdings Inc. |
| Sector: Services & Goods | |
| SubSector: Restaurants | |
| MarketCap: 778.87 Millions | |
| Recent Price: 10.57 Market Intelligence Score: 0 | |
| Day Percent Change: -5.71% Day Change: -0.64 | |
| Week Change: -4.86% Year-to-date Change: -16.7% | |
| ARCO Links: Profile News Message Board | |
| Charts:- Daily , Weekly | |
| Add ARCO to Watchlist: View: Get Complete ARCO Trend Analysis ➞ | |
 | VTRU Vitru Limited |
| Sector: Consumer Staples | |
| SubSector: Education & Training Services | |
| MarketCap: 33347 Millions | |
| Recent Price: 10.38 Market Intelligence Score: 0 | |
| Day Percent Change: -5.42% Day Change: -0.59 | |
| Week Change: -11.21% Year-to-date Change: -34.4% | |
| VTRU Links: Profile News Message Board | |
| Charts:- Daily , Weekly | |
| Add VTRU to Watchlist: View: Get Complete VTRU Trend Analysis ➞ | |
 | BIOX Bioceres Crop Solutions Corp. |
| Sector: Industrials | |
| SubSector: Conglomerates | |
| MarketCap: 198.348 Millions | |
| Recent Price: 11.50 Market Intelligence Score: 0 | |
| Day Percent Change: -4.17% Day Change: -0.50 | |
| Week Change: -10.92% Year-to-date Change: -16.2% | |
| BIOX Links: Profile News Message Board | |
| Charts:- Daily , Weekly | |
| Add BIOX to Watchlist: View: Get Complete BIOX Trend Analysis ➞ | |
 | MOGO Mogo Inc. |
| Sector: Financials | |
| SubSector: Credit Services | |
| MarketCap: 21.9208 Millions | |
| Recent Price: 1.66 Market Intelligence Score: 0 | |
| Day Percent Change: -2.35% Day Change: -0.04 | |
| Week Change: -5.68% Year-to-date Change: -10.3% | |
| MOGO Links: Profile News Message Board | |
| Charts:- Daily , Weekly | |
| Add MOGO to Watchlist: View: Get Complete MOGO Trend Analysis ➞ | |
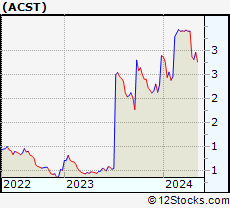 | ACST Acasti Pharma Inc. |
| Sector: Health Care | |
| SubSector: Biotechnology | |
| MarketCap: 28.2785 Millions | |
| Recent Price: 2.73 Market Intelligence Score: 0 | |
| Day Percent Change: -2.15% Day Change: -0.06 | |
| Week Change: -1.09% Year-to-date Change: -5.5% | |
| ACST Links: Profile News Message Board | |
| Charts:- Daily , Weekly | |
| Add ACST to Watchlist: View: Get Complete ACST Trend Analysis ➞ | |
 | QSR Restaurant Brands International Inc. |
| Sector: Services & Goods | |
| SubSector: Restaurants | |
| MarketCap: 9551 Millions | |
| Recent Price: 71.43 Market Intelligence Score: 0 | |
| Day Percent Change: -0.45% Day Change: -0.32 | |
| Week Change: -2.47% Year-to-date Change: -8.6% | |
| QSR Links: Profile News Message Board | |
| Charts:- Daily , Weekly | |
| Add QSR to Watchlist: View: Get Complete QSR Trend Analysis ➞ | |
| To view more stocks, click on Next / Previous arrows or select different range: 0 - 25 , 25 - 50 , 50 - 75 , 75 - 100 , 100 - 125 , 125 - 150 , 150 - 175 , 175 - 200 , 200 - 225 | ||
| Click To Change The Sort Order: By Market Cap or Company Size Performance: Year-to-date, Week and Day | |
| Select Chart Type: | ||
 Best Stocks Today 12Stocks.com |
© 2024 12Stocks.com Terms & Conditions Privacy Contact Us
All Information Provided Only For Education And Not To Be Used For Investing or Trading. See Terms & Conditions


One More Thing ... Get Best Stocks Delivered Daily!
Never Ever Miss A Move With Our Top Ten Stocks Lists
Find Best Stocks In Any Market - Bull or Bear Market
Take A Peek At Our Top Ten Stocks Lists: Daily, Weekly, Year-to-Date & Top Trends
Find Best Stocks In Any Market - Bull or Bear Market
Take A Peek At Our Top Ten Stocks Lists: Daily, Weekly, Year-to-Date & Top Trends
Latin America Stocks With Best Up Trends [0-bearish to 100-bullish]: SilverCrest Metals[100], Banco Macro[100], Embraer S.A[100], Endeavour Silver[100], IRSA Inversiones[100], Grupo Supervielle[100], Banco BBVA[100], NovaGold Resources[100], Vox Royalty[100], City Office[100], Alamos Gold[100]
Best Latin America Stocks Year-to-Date:
Aurora Cannabis[1395.17%], Banco Macro[133.1%], Fusion [124.38%], Banco BBVA[113.79%], Grupo Financiero[113.38%], Canopy Growth[93.93%], Grupo Supervielle[90.15%], Hudbay Minerals[80.25%], Endeavour Silver[77.16%], IAMGOLD [77.08%], Embraer S.A[64.5%] Best Latin America Stocks This Week:
Trilogy Metals[26.4%], Embraer S.A[17.09%], Hudbay Minerals[13.33%], Aurora Cannabis[12.13%], Canopy Growth[12.1%], NovaGold Resources[10.92%], BlackBerry [10.81%], Ballard Power[10.6%], Lion Electric[10.53%], OrganiGram [9.66%], Grupo Supervielle[8.73%] Best Latin America Stocks Daily:
Central Puerto[8.30%], SilverCrest Metals[6.40%], Banco Macro[5.94%], Loma Negra[5.45%], Embraer S.A[5.20%], OrganiGram [5.18%], Endeavour Silver[4.80%], Brookfield Renewable[4.71%], Nu [4.68%], IRSA Inversiones[4.57%], Gold Royalty[4.49%]