
 Login Sign Up


| |||||
 |  | ||||

| 12Stocks.com Market Intelligence |
Best Latin America Stocks
|
|
| Quick Read: Top Latin America Stocks By Performances & Trends: Daily, Weekly, Year-to-Date, Market Cap (Size) & Technical Trends | |||
| Best Latin America Views: Quick Browse View, Summary & Slide Show | |||
| 12Stocks.com Latin America Stocks Performances & Trends Daily | |||||||||
|
|  The overall market intelligence score is 32 (0-bearish to 100-bullish) which puts Latin America index in short term bearish to neutral trend. The market intelligence score from previous trading session is 0 and an improvement of trend continues.
| ||||||||
| Here are the market intelligence trend scores of the most requested Latin America stocks at 12Stocks.com (click stock name for detailed review): | |
| Scroll down this page for most comprehensive review of Latin America stocks by performance, trends, technical analysis, charts, fund plays & more | |


| 12Stocks.com: Top Performing Latin America Index Stocks | ||||||||||||||||||||||||||||||||||||||||||||||||
 The top performing Latin America Index stocks year to date are
Now, more recently, over last week, the top performing Latin America Index stocks on the move are


|
||||||||||||||||||||||||||||||||||||||||||||||||
| 12Stocks.com: Investing in Latin America Index with Stocks | |
|
The following table helps investors and traders sort through current performance and trends (as measured by market intelligence score) of various
stocks in the Latin America Index. Quick View: Move mouse or cursor over stock symbol (ticker) to view short-term technical chart and over stock name to view long term chart. Click on  to add stock symbol to your watchlist and to add stock symbol to your watchlist and  to view watchlist. Click on any ticker or stock name for detailed market intelligence report for that stock. to view watchlist. Click on any ticker or stock name for detailed market intelligence report for that stock. |
12Stocks.com Performance of Stocks in Latin America Index
| Ticker | Stock Name | Watchlist | Category | Recent Price | Market Intelligence Score | Change % | YTD Change% |
| VLRS | Controladora Vuela |   | Transports | 8.93 | 100 | 11.35 | -4.80% |
| ANY | Sphere 3D | | Technology | 1.22 | 49 | 9.91 | -63.25% |
| PAC | Grupo Aeroportuario | | Transports | 174.12 | 85 | 8.53 | -0.63% |
| QBTS | D-Wave Quantum | | Technology | 1.62 | 46 | 6.95 | 84.07% |
| NG | NovaGold Resources | | Materials | 2.96 | 36 | 5.34 | -20.86% |
| EXK | Endeavour Silver | | Materials | 2.69 | 73 | 5.27 | 36.80% |
| IAG | IAMGOLD | | Materials | 3.67 | 68 | 5.16 | 45.06% |
| ASR | Grupo Aeroportuario | | Transports | 330.40 | 75 | 4.80 | 12.28% |
| CSIQ | Canadian Solar | | Technology | 15.61 | 52 | 4.28 | -40.49% |
| GROY | Gold Royalty | | Materials | 1.98 | 53 | 4.21 | 37.02% |
| SHOP | Shopify | | Technology | 73.48 | 49 | 4.15 | -5.67% |
| ABCL | AbCellera Biologics | | Health Care | 4.17 | 47 | 4.11 | -26.11% |
| TFPM | Triple Flag | | Materials | 15.67 | 66 | 3.98 | 18.35% |
| TV | Grupo Televisa | | Services & Goods | 3.02 | 42 | 3.97 | -9.73% |
| DSGX | Descartes Systems | | Technology | 94.97 | 100 | 3.63 | 12.98% |
| BUR | Burcon Nutrascience | | Health Care | 15.26 | 17 | 3.39 | -2.18% |
| WPRT | Westport Fuel | | Consumer Staples | 5.84 | 25 | 3.36 | -11.78% |
| OMAB | Grupo Aeroportuario | | Transports | 78.68 | 68 | 3.36 | -7.03% |
| LEV | Lion Electric | | Industrials | 0.98 | 10 | 3.16 | -44.79% |
| CLS | Celestica | | Technology | 44.33 | 63 | 3.14 | 51.40% |
| MERC | Mercer | | Consumer Staples | 9.95 | 75 | 3.11 | 4.96% |
| SA | Seabridge Gold | | Materials | 14.81 | 36 | 2.92 | 22.09% |
| BTG | B2Gold | | Materials | 2.58 | 10 | 2.79 | -18.35% |
| XENE | Xenon | | Health Care | 41.09 | 7 | 2.72 | -10.79% |
| AG | First Majestic | | Materials | 6.72 | 68 | 2.67 | 9.35% |
| To view more stocks, click on Next / Previous arrows or select different range: 0 - 25 , 25 - 50 , 50 - 75 , 75 - 100 , 100 - 125 , 125 - 150 , 150 - 175 | ||
 | Click To Change The Sort Order: By Market Cap or Company Size Performance: Year-to-date, Week and Day |  |
| Detailed Overview Of Latin America Stocks |
| Latin America Technical Overview, Leaders & Laggards, Top Latin America ETF Funds & Detailed Latin America Stocks List, Charts, Trends & More |
| Latin America: Technical Analysis, Trends & YTD Performance | |
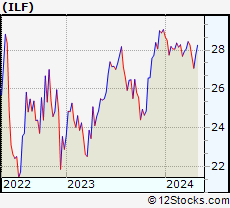
 ILF Weekly Chart |
|
| Long Term Trend: Not Good | |
| Medium Term Trend: Not Good | |
 ILF Daily Chart |
|
| Short Term Trend: Very Good | |
| Overall Trend Score: 32 | |
| YTD Performance: -5.97% | |
| **Trend Scores & Views Are Only For Educational Purposes And Not For Investing | |
| 12Stocks.com: Investing in Latin America Index using Exchange Traded Funds | |
|
The following table shows list of key exchange traded funds (ETF) that
help investors play Latin America stock market. For detailed view, check out our ETF Funds section of our website. Quick View: Move mouse or cursor over ETF symbol (ticker) to view short-term technical chart and over ETF name to view long term chart. Click on ticker or stock name for detailed view. Click on to add stock symbol to your watchlist and to view watchlist. |
12Stocks.com List of ETFs that track Latin America Index
| Ticker | ETF Name | Watchlist | Recent Price | Market Intelligence Score | Change % | Week % | Year-to-date % |
| ILF | Latin America 40 | | 27.32 | 32 | 0.09 | 0.94 | -5.97% |
| EWC | Canada | | 37.62 | 75 | 0.70 | 1.37 | 2.56% |
| FLN | Latin America AlphaDEX | | 19.54 | 25 | 0.54 | 1.64 | -6.04% |
| EWZ | Brazil | | 30.90 | 49 | -0.37 | 0.5 | -11.63% |
| EWW | Mexico | | 66.06 | 32 | 0.71 | 1.81 | -2.63% |
| ARGT | Argentina | | 56.26 | 79 | 0.84 | 5.22 | 9.58% |
| EWZS | Brazil Small-Cap | | 12.97 | 32 | -1.67 | -0.23 | -13.88% |
| BRF | Brazil Small-Cap | | 14.93 | 32 | -0.40 | 0.47 | -15.11% |
| BZQ | Short Brazil | | 12.64 | 56 | 0.87 | -0.73 | 26.02% |
| BRZU | Brazil Bull 3X | | 77.47 | 49 | -0.84 | 0.87 | -24.7% |
| FBZ | Brazil AlphaDEX | | 11.33 | 25 | 0.09 | 0.8 | -7.3% |
| 12Stocks.com: Charts, Trends, Fundamental Data and Performances of Latin America Stocks | |
|
We now take in-depth look at all Latin America stocks including charts, multi-period performances and overall trends (as measured by market intelligence score). One can sort Latin America stocks (click link to choose) by Daily, Weekly and by Year-to-Date performances. Also, one can sort by size of the company or by market capitalization. |
| Select Your Default Chart Type: | |||||
| |||||
| Click on stock symbol or name for detailed view. Click on to add stock symbol to your watchlist and to view watchlist. Quick View: Move mouse or cursor over "Daily" to quickly view daily technical stock chart and over "Weekly" to view weekly technical stock chart. | |||||

 | VLRS Controladora Vuela Compania de Aviacion, S.A.B. de C.V. |
| Sector: Transports | |
| SubSector: Major Airlines | |
| MarketCap: 382 Millions | |
| Recent Price: 8.93 Market Intelligence Score: 100 | |
| Day Percent Change: 11.35% Day Change: 0.91 | |
| Week Change: 14.49% Year-to-date Change: -4.8% | |
| VLRS Links: Profile News Message Board | |
| Charts:- Daily , Weekly | |
| Add VLRS to Watchlist: View: Get Complete VLRS Trend Analysis ➞ | |
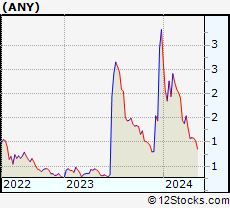 | ANY Sphere 3D Corp. |
| Sector: Technology | |
| SubSector: Application Software | |
| MarketCap: 2.57662 Millions | |
| Recent Price: 1.22 Market Intelligence Score: 49 | |
| Day Percent Change: 9.91% Day Change: 0.11 | |
| Week Change: 11.93% Year-to-date Change: -63.3% | |
| ANY Links: Profile News Message Board | |
| Charts:- Daily , Weekly | |
| Add ANY to Watchlist: View: Get Complete ANY Trend Analysis ➞ | |
 | PAC Grupo Aeroportuario del Pacifico, S.A.B. de C.V. |
| Sector: Transports | |
| SubSector: Air Services, Other | |
| MarketCap: 3204.18 Millions | |
| Recent Price: 174.12 Market Intelligence Score: 85 | |
| Day Percent Change: 8.53% Day Change: 13.69 | |
| Week Change: 11.51% Year-to-date Change: -0.6% | |
| PAC Links: Profile News Message Board | |
| Charts:- Daily , Weekly | |
| Add PAC to Watchlist: View: Get Complete PAC Trend Analysis ➞ | |
 | QBTS D-Wave Quantum Inc. |
| Sector: Technology | |
| SubSector: Computer Hardware | |
| MarketCap: 290 Millions | |
| Recent Price: 1.62 Market Intelligence Score: 46 | |
| Day Percent Change: 6.95% Day Change: 0.10 | |
| Week Change: 1.57% Year-to-date Change: 84.1% | |
| QBTS Links: Profile News Message Board | |
| Charts:- Daily , Weekly | |
| Add QBTS to Watchlist: View: Get Complete QBTS Trend Analysis ➞ | |
 | NG NovaGold Resources Inc. |
| Sector: Materials | |
| SubSector: Gold | |
| MarketCap: 2499.49 Millions | |
| Recent Price: 2.96 Market Intelligence Score: 36 | |
| Day Percent Change: 5.34% Day Change: 0.15 | |
| Week Change: -4.52% Year-to-date Change: -20.9% | |
| NG Links: Profile News Message Board | |
| Charts:- Daily , Weekly | |
| Add NG to Watchlist: View: Get Complete NG Trend Analysis ➞ | |
 | EXK Endeavour Silver Corp. |
| Sector: Materials | |
| SubSector: Silver | |
| MarketCap: 204.456 Millions | |
| Recent Price: 2.69 Market Intelligence Score: 73 | |
| Day Percent Change: 5.27% Day Change: 0.13 | |
| Week Change: 3.26% Year-to-date Change: 36.8% | |
| EXK Links: Profile News Message Board | |
| Charts:- Daily , Weekly | |
| Add EXK to Watchlist: View: Get Complete EXK Trend Analysis ➞ | |
 | IAG IAMGOLD Corporation |
| Sector: Materials | |
| SubSector: Gold | |
| MarketCap: 1158.09 Millions | |
| Recent Price: 3.67 Market Intelligence Score: 68 | |
| Day Percent Change: 5.16% Day Change: 0.18 | |
| Week Change: 0.27% Year-to-date Change: 45.1% | |
| IAG Links: Profile News Message Board | |
| Charts:- Daily , Weekly | |
| Add IAG to Watchlist: View: Get Complete IAG Trend Analysis ➞ | |
 | ASR Grupo Aeroportuario del Sureste, S. A. B. de C. V. |
| Sector: Transports | |
| SubSector: Air Services, Other | |
| MarketCap: 2739.98 Millions | |
| Recent Price: 330.40 Market Intelligence Score: 75 | |
| Day Percent Change: 4.80% Day Change: 15.14 | |
| Week Change: 7.2% Year-to-date Change: 12.3% | |
| ASR Links: Profile News Message Board | |
| Charts:- Daily , Weekly | |
| Add ASR to Watchlist: View: Get Complete ASR Trend Analysis ➞ | |
 | CSIQ Canadian Solar Inc. |
| Sector: Technology | |
| SubSector: Semiconductor - Specialized | |
| MarketCap: 957.96 Millions | |
| Recent Price: 15.61 Market Intelligence Score: 52 | |
| Day Percent Change: 4.28% Day Change: 0.64 | |
| Week Change: 8.33% Year-to-date Change: -40.5% | |
| CSIQ Links: Profile News Message Board | |
| Charts:- Daily , Weekly | |
| Add CSIQ to Watchlist: View: Get Complete CSIQ Trend Analysis ➞ | |
 | GROY Gold Royalty Corp. |
| Sector: Materials | |
| SubSector: Other Precious Metals & Mining | |
| MarketCap: 254 Millions | |
| Recent Price: 1.98 Market Intelligence Score: 53 | |
| Day Percent Change: 4.21% Day Change: 0.08 | |
| Week Change: 1.54% Year-to-date Change: 37.0% | |
| GROY Links: Profile News Message Board | |
| Charts:- Daily , Weekly | |
| Add GROY to Watchlist: View: Get Complete GROY Trend Analysis ➞ | |
 | SHOP Shopify Inc. |
| Sector: Technology | |
| SubSector: Application Software | |
| MarketCap: 45164.2 Millions | |
| Recent Price: 73.48 Market Intelligence Score: 49 | |
| Day Percent Change: 4.15% Day Change: 2.93 | |
| Week Change: 5.47% Year-to-date Change: -5.7% | |
| SHOP Links: Profile News Message Board | |
| Charts:- Daily , Weekly | |
| Add SHOP to Watchlist: View: Get Complete SHOP Trend Analysis ➞ | |
 | ABCL AbCellera Biologics Inc. |
| Sector: Health Care | |
| SubSector: Biotechnology | |
| MarketCap: 1870 Millions | |
| Recent Price: 4.17 Market Intelligence Score: 47 | |
| Day Percent Change: 4.11% Day Change: 0.17 | |
| Week Change: 7.88% Year-to-date Change: -26.1% | |
| ABCL Links: Profile News Message Board | |
| Charts:- Daily , Weekly | |
| Add ABCL to Watchlist: View: Get Complete ABCL Trend Analysis ➞ | |
 | TFPM Triple Flag Precious Metals Corp. |
| Sector: Materials | |
| SubSector: Other Precious Metals & Mining | |
| MarketCap: 3640 Millions | |
| Recent Price: 15.67 Market Intelligence Score: 66 | |
| Day Percent Change: 3.98% Day Change: 0.60 | |
| Week Change: 0.58% Year-to-date Change: 18.4% | |
| TFPM Links: Profile News Message Board | |
| Charts:- Daily , Weekly | |
| Add TFPM to Watchlist: View: Get Complete TFPM Trend Analysis ➞ | |
 | TV Grupo Televisa, S.A.B. |
| Sector: Services & Goods | |
| SubSector: Broadcasting - TV | |
| MarketCap: 3740.43 Millions | |
| Recent Price: 3.02 Market Intelligence Score: 42 | |
| Day Percent Change: 3.97% Day Change: 0.12 | |
| Week Change: 7.3% Year-to-date Change: -9.7% | |
| TV Links: Profile News Message Board | |
| Charts:- Daily , Weekly | |
| Add TV to Watchlist: View: Get Complete TV Trend Analysis ➞ | |
 | DSGX The Descartes Systems Group Inc |
| Sector: Technology | |
| SubSector: Business Software & Services | |
| MarketCap: 2830.58 Millions | |
| Recent Price: 94.97 Market Intelligence Score: 100 | |
| Day Percent Change: 3.63% Day Change: 3.33 | |
| Week Change: 5.15% Year-to-date Change: 13.0% | |
| DSGX Links: Profile News Message Board | |
| Charts:- Daily , Weekly | |
| Add DSGX to Watchlist: View: Get Complete DSGX Trend Analysis ➞ | |
 | BUR Burcon Nutrascience Corporation |
| Sector: Health Care | |
| SubSector: Biotechnology | |
| MarketCap: 0 Millions | |
| Recent Price: 15.26 Market Intelligence Score: 17 | |
| Day Percent Change: 3.39% Day Change: 0.50 | |
| Week Change: 4.02% Year-to-date Change: -2.2% | |
| BUR Links: Profile News Message Board | |
| Charts:- Daily , Weekly | |
| Add BUR to Watchlist: View: Get Complete BUR Trend Analysis ➞ | |
 | WPRT Westport Fuel Systems Inc. |
| Sector: Consumer Staples | |
| SubSector: Auto Parts | |
| MarketCap: 108.939 Millions | |
| Recent Price: 5.84 Market Intelligence Score: 25 | |
| Day Percent Change: 3.36% Day Change: 0.19 | |
| Week Change: 1.74% Year-to-date Change: -11.8% | |
| WPRT Links: Profile News Message Board | |
| Charts:- Daily , Weekly | |
| Add WPRT to Watchlist: View: Get Complete WPRT Trend Analysis ➞ | |
 | OMAB Grupo Aeroportuario del Centro Norte, S.A.B. de C.V. |
| Sector: Transports | |
| SubSector: Air Services, Other | |
| MarketCap: 1196.38 Millions | |
| Recent Price: 78.68 Market Intelligence Score: 68 | |
| Day Percent Change: 3.36% Day Change: 2.56 | |
| Week Change: 4.77% Year-to-date Change: -7.0% | |
| OMAB Links: Profile News Message Board | |
| Charts:- Daily , Weekly | |
| Add OMAB to Watchlist: View: Get Complete OMAB Trend Analysis ➞ | |
 | LEV The Lion Electric Company |
| Sector: Industrials | |
| SubSector: Farm & Heavy Construction Machinery | |
| MarketCap: 414 Millions | |
| Recent Price: 0.98 Market Intelligence Score: 10 | |
| Day Percent Change: 3.16% Day Change: 0.03 | |
| Week Change: 0.82% Year-to-date Change: -44.8% | |
| LEV Links: Profile News Message Board | |
| Charts:- Daily , Weekly | |
| Add LEV to Watchlist: View: Get Complete LEV Trend Analysis ➞ | |
 | CLS Celestica Inc. |
| Sector: Technology | |
| SubSector: Printed Circuit Boards | |
| MarketCap: 474.235 Millions | |
| Recent Price: 44.33 Market Intelligence Score: 63 | |
| Day Percent Change: 3.14% Day Change: 1.35 | |
| Week Change: 8.84% Year-to-date Change: 51.4% | |
| CLS Links: Profile News Message Board | |
| Charts:- Daily , Weekly | |
| Add CLS to Watchlist: View: Get Complete CLS Trend Analysis ➞ | |
 | MERC Mercer International Inc. |
| Sector: Consumer Staples | |
| SubSector: Paper & Paper Products | |
| MarketCap: 509.003 Millions | |
| Recent Price: 9.95 Market Intelligence Score: 75 | |
| Day Percent Change: 3.11% Day Change: 0.30 | |
| Week Change: 4.3% Year-to-date Change: 5.0% | |
| MERC Links: Profile News Message Board | |
| Charts:- Daily , Weekly | |
| Add MERC to Watchlist: View: Get Complete MERC Trend Analysis ➞ | |
 | SA Seabridge Gold Inc. |
| Sector: Materials | |
| SubSector: Gold | |
| MarketCap: 565.419 Millions | |
| Recent Price: 14.81 Market Intelligence Score: 36 | |
| Day Percent Change: 2.92% Day Change: 0.42 | |
| Week Change: -3.33% Year-to-date Change: 22.1% | |
| SA Links: Profile News Message Board | |
| Charts:- Daily , Weekly | |
| Add SA to Watchlist: View: Get Complete SA Trend Analysis ➞ | |
 | BTG B2Gold Corp. |
| Sector: Materials | |
| SubSector: Gold | |
| MarketCap: 2792.39 Millions | |
| Recent Price: 2.58 Market Intelligence Score: 10 | |
| Day Percent Change: 2.79% Day Change: 0.07 | |
| Week Change: -0.77% Year-to-date Change: -18.4% | |
| BTG Links: Profile News Message Board | |
| Charts:- Daily , Weekly | |
| Add BTG to Watchlist: View: Get Complete BTG Trend Analysis ➞ | |
 | XENE Xenon Pharmaceuticals Inc. |
| Sector: Health Care | |
| SubSector: Biotechnology | |
| MarketCap: 388.585 Millions | |
| Recent Price: 41.09 Market Intelligence Score: 7 | |
| Day Percent Change: 2.72% Day Change: 1.09 | |
| Week Change: 3.03% Year-to-date Change: -10.8% | |
| XENE Links: Profile News Message Board | |
| Charts:- Daily , Weekly | |
| Add XENE to Watchlist: View: Get Complete XENE Trend Analysis ➞ | |
 | AG First Majestic Silver Corp. |
| Sector: Materials | |
| SubSector: Silver | |
| MarketCap: 1128.56 Millions | |
| Recent Price: 6.72 Market Intelligence Score: 68 | |
| Day Percent Change: 2.67% Day Change: 0.17 | |
| Week Change: -0.07% Year-to-date Change: 9.4% | |
| AG Links: Profile News Message Board | |
| Charts:- Daily , Weekly | |
| Add AG to Watchlist: View: Get Complete AG Trend Analysis ➞ | |
| To view more stocks, click on Next / Previous arrows or select different range: 0 - 25 , 25 - 50 , 50 - 75 , 75 - 100 , 100 - 125 , 125 - 150 , 150 - 175 | ||
| Click To Change The Sort Order: By Market Cap or Company Size Performance: Year-to-date, Week and Day | |
| Select Chart Type: | ||
 Best Stocks Today 12Stocks.com |
© 2024 12Stocks.com Terms & Conditions Privacy Contact Us
All Information Provided Only For Education And Not To Be Used For Investing or Trading. See Terms & Conditions


One More Thing ... Get Best Stocks Delivered Daily!
Never Ever Miss A Move With Our Top Ten Stocks Lists
Find Best Stocks In Any Market - Bull or Bear Market
Take A Peek At Our Top Ten Stocks Lists: Daily, Weekly, Year-to-Date & Top Trends
Find Best Stocks In Any Market - Bull or Bear Market
Take A Peek At Our Top Ten Stocks Lists: Daily, Weekly, Year-to-Date & Top Trends
Latin America Stocks With Best Up Trends [0-bearish to 100-bullish]: Controladora Vuela[100], Descartes Systems[100], Grupo Financiero[100], IRSA Inversiones[100], Grupo Supervielle[95], Banco Macro[95], Cresud Sociedad[93], Canadian National[93], Suncor Energy[88], Grupo Aeroportuario[85], Transportadora de[85]
Best Latin America Stocks Year-to-Date:
D-Wave Quantum[84.07%], Banco Macro[83.68%], Grupo Financiero[80.94%], Grupo Supervielle[54.93%], Celestica [51.4%], McEwen Mining[51.18%], IAMGOLD [45.06%], Hudbay Minerals[39.95%], Gold Royalty[37.02%], Endeavour Silver[36.8%], Embraer S.A[32.28%] Best Latin America Stocks This Week:
Controladora Vuela[14.49%], Grupo Supervielle[14.36%], Grupo Aeroportuario[11.51%], Grupo Financiero[9.77%], Li-Cycle [9.22%], Celestica [8.84%], Telecom Argentina[8.5%], Canadian Solar[8.33%], AbCellera Biologics[7.88%], YPF Sociedad[7.39%], Grupo Televisa[7.3%] Best Latin America Stocks Daily:
Controladora Vuela[11.35%], Grupo Aeroportuario[8.53%], D-Wave Quantum[6.95%], NovaGold Resources[5.34%], Endeavour Silver[5.27%], IAMGOLD [5.16%], Grupo Aeroportuario[4.80%], Canadian Solar[4.28%], Gold Royalty[4.21%], Shopify [4.15%], AbCellera Biologics[4.11%]