
 Login Sign Up


| |||||
 |  | ||||

| 12Stocks.com Market Intelligence |
Best Latin America Stocks
|
|
| Quick Read: Top Latin America Stocks By Performances & Trends: Daily, Weekly, Year-to-Date, Market Cap (Size) & Technical Trends | |||
| Best Latin America Views: Quick Browse View, Summary & Slide Show | |||
| 12Stocks.com Latin America Stocks Performances & Trends Daily | |||||||||
|
|  The overall market intelligence score is 78 (0-bearish to 100-bullish) which puts Latin America index in short term neutral to bullish trend. The market intelligence score from previous trading session is 71 and hence an improvement of trend.
| ||||||||
| Here are the market intelligence trend scores of the most requested Latin America stocks at 12Stocks.com (click stock name for detailed review): | |
| Scroll down this page for most comprehensive review of Latin America stocks by performance, trends, technical analysis, charts, fund plays & more | |


| 12Stocks.com: Top Performing Latin America Index Stocks | ||||||||||||||||||||||||||||||||||||||||||||||||
 The top performing Latin America Index stocks year to date are
Now, more recently, over last week, the top performing Latin America Index stocks on the move are


|
||||||||||||||||||||||||||||||||||||||||||||||||
| 12Stocks.com: Investing in Latin America Index with Stocks | |
|
The following table helps investors and traders sort through current performance and trends (as measured by market intelligence score) of various
stocks in the Latin America Index. Quick View: Move mouse or cursor over stock symbol (ticker) to view short-term technical chart and over stock name to view long term chart. Click on  to add stock symbol to your watchlist and to add stock symbol to your watchlist and  to view watchlist. Click on any ticker or stock name for detailed market intelligence report for that stock. to view watchlist. Click on any ticker or stock name for detailed market intelligence report for that stock. |
12Stocks.com Performance of Stocks in Latin America Index
| Ticker | Stock Name | Watchlist | Category | Recent Price | Market Intelligence Score | Change % | YTD Change% |
| BAM | Brookfield Asset |   | Financials | 39.75 | 57 | -0.63 | -1.05% |
| PSLV | Sprott Physical | | Financials | 9.53 | 80 | -0.63 | 17.95% |
| BAK | Braskem S.A | | Materials | 7.36 | 15 | -0.67 | -16.55% |
| PAGS | PagSeguro Digital | | Financials | 12.59 | 39 | -0.67 | 0.92% |
| STNE | StoneCo | | Technology | 16.61 | 32 | -0.69 | -7.90% |
| BTG | B2Gold | | Materials | 2.77 | 100 | -0.72 | -12.34% |
| QBTS | D-Wave Quantum | | Technology | 1.30 | 22 | -0.76 | 48.17% |
| CAE | CAE | | Industrials | 20.94 | 90 | -0.76 | -3.01% |
| BBD | Banco Bradesco | | Financials | 2.58 | 0 | -0.77 | -26.29% |
| TGB | Taseko Mines | | Materials | 2.55 | 75 | -0.78 | 82.14% |
| VIV | Telefonica Brasil | | Technology | 8.75 | 0 | -0.79 | -20.02% |
| PBR | Petroleo Brasileiro | | Energy | 17.08 | 71 | -0.81 | 6.95% |
| EBR | Centrais Eletricas | | Utilities | 7.30 | 8 | -0.82 | -15.31% |
| NFGC | New Found | | Materials | 3.57 | 46 | -0.83 | 1.42% |
| TFPM | Triple Flag | | Materials | 16.45 | 81 | -0.84 | 24.24% |
| EQX | Equinox Gold | | Materials | 5.29 | 38 | -0.84 | 8.18% |
| ABEV | Ambev S.A | | Consumer Staples | 2.32 | 32 | -0.85 | -17.14% |
| VTRU | Vitru | | Consumer Staples | 11.69 | 20 | -0.85 | -26.11% |
| CINT | CI&T | | Technology | 3.42 | 0 | -0.87 | -35.77% |
| FSV | FirstService | | Financials | 150.29 | 43 | -0.88 | -7.28% |
| CRON | Cronos | | Health Care | 2.79 | 93 | -0.89 | 33.73% |
| ERF | Enerplus | | Energy | 19.93 | 54 | -0.90 | 29.92% |
| BHC | Bausch Health | | Health Care | 6.88 | 10 | -0.94 | -14.15% |
| CRESY | Cresud Sociedad | | Consumer Staples | 10.22 | 83 | -0.97 | 7.81% |
| NGD | New Gold | | Materials | 1.95 | 100 | -1.02 | 33.56% |
| To view more stocks, click on Next / Previous arrows or select different range: 0 - 25 , 25 - 50 , 50 - 75 , 75 - 100 , 100 - 125 , 125 - 150 , 150 - 175 , 175 - 200 , 200 - 225 | ||
 | Click To Change The Sort Order: By Market Cap or Company Size Performance: Year-to-date, Week and Day |  |
| Detailed Overview Of Latin America Stocks |
| Latin America Technical Overview, Leaders & Laggards, Top Latin America ETF Funds & Detailed Latin America Stocks List, Charts, Trends & More |
| Latin America: Technical Analysis, Trends & YTD Performance | |
 ILF Weekly Chart |
|
| Long Term Trend: Good | |
| Medium Term Trend: Very Good | |
 ILF Daily Chart |
|
| Short Term Trend: Not Good | |
| Overall Trend Score: 78 | |
| YTD Performance: -2.17% | |
| **Trend Scores & Views Are Only For Educational Purposes And Not For Investing | |
| 12Stocks.com: Investing in Latin America Index using Exchange Traded Funds | |
|
The following table shows list of key exchange traded funds (ETF) that
help investors play Latin America stock market. For detailed view, check out our ETF Funds section of our website. Quick View: Move mouse or cursor over ETF symbol (ticker) to view short-term technical chart and over ETF name to view long term chart. Click on ticker or stock name for detailed view. Click on to add stock symbol to your watchlist and to view watchlist. |
12Stocks.com List of ETFs that track Latin America Index
| Ticker | ETF Name | Watchlist | Recent Price | Market Intelligence Score | Change % | Week % | Year-to-date % |
| ILF | Latin America 40 | | 28.43 | 78 | -0.39 | 0.6 | -2.17% |
| EWC | Canada | | 38.19 | 88 | -0.24 | 1.65 | 4.12% |
| FLN | Latin America AlphaDEX | | 20.03 | 40 | -0.55 | -0.25 | -3.66% |
| EWZ | Brazil | | 31.61 | 39 | -0.75 | -2.17 | -9.58% |
| EWW | Mexico | | 68.47 | 95 | -0.17 | 2.5 | 0.91% |
| ARGT | Argentina | | 62.29 | 76 | -1.56 | 1.57 | 21.33% |
| EWZS | Brazil Small-Cap | | 13.43 | 32 | -0.85 | -3.45 | -10.82% |
| BRF | Brazil Small-Cap | | 15.27 | 39 | 0.07 | -4.08 | -13.18% |
| BZQ | Short Brazil | | 11.97 | 61 | 1.00 | 4.26 | 19.33% |
| BRZU | Brazil Bull 3X | | 80.57 | 39 | -1.65 | -4.57 | -21.69% |
| FBZ | Brazil AlphaDEX | | 11.57 | 22 | -1.78 | -2.36 | -5.33% |
| 12Stocks.com: Charts, Trends, Fundamental Data and Performances of Latin America Stocks | |
|
We now take in-depth look at all Latin America stocks including charts, multi-period performances and overall trends (as measured by market intelligence score). One can sort Latin America stocks (click link to choose) by Daily, Weekly and by Year-to-Date performances. Also, one can sort by size of the company or by market capitalization. |
| Select Your Default Chart Type: | |||||
| |||||
| Click on stock symbol or name for detailed view. Click on to add stock symbol to your watchlist and to view watchlist. Quick View: Move mouse or cursor over "Daily" to quickly view daily technical stock chart and over "Weekly" to view weekly technical stock chart. | |||||

 | BAM Brookfield Asset Management Inc. |
| Sector: Financials | |
| SubSector: Real Estate Development | |
| MarketCap: 47134.9 Millions | |
| Recent Price: 39.75 Market Intelligence Score: 57 | |
| Day Percent Change: -0.63% Day Change: -0.25 | |
| Week Change: 1.58% Year-to-date Change: -1.1% | |
| BAM Links: Profile News Message Board | |
| Charts:- Daily , Weekly | |
| Add BAM to Watchlist: View: Get Complete BAM Trend Analysis ➞ | |
 | PSLV Sprott Physical Silver Trust |
| Sector: Financials | |
| SubSector: Exchange Traded Fund | |
| MarketCap: 765.851 Millions | |
| Recent Price: 9.53 Market Intelligence Score: 80 | |
| Day Percent Change: -0.63% Day Change: -0.06 | |
| Week Change: 6.48% Year-to-date Change: 18.0% | |
| PSLV Links: Profile News Message Board | |
| Charts:- Daily , Weekly | |
| Add PSLV to Watchlist: View: Get Complete PSLV Trend Analysis ➞ | |
 | BAK Braskem S.A. |
| Sector: Materials | |
| SubSector: Chemicals - Major Diversified | |
| MarketCap: 2715.86 Millions | |
| Recent Price: 7.36 Market Intelligence Score: 15 | |
| Day Percent Change: -0.67% Day Change: -0.05 | |
| Week Change: -18.49% Year-to-date Change: -16.6% | |
| BAK Links: Profile News Message Board | |
| Charts:- Daily , Weekly | |
| Add BAK to Watchlist: View: Get Complete BAK Trend Analysis ➞ | |
 | PAGS PagSeguro Digital Ltd. |
| Sector: Financials | |
| SubSector: Credit Services | |
| MarketCap: 6500.78 Millions | |
| Recent Price: 12.59 Market Intelligence Score: 39 | |
| Day Percent Change: -0.67% Day Change: -0.08 | |
| Week Change: -1.76% Year-to-date Change: 0.9% | |
| PAGS Links: Profile News Message Board | |
| Charts:- Daily , Weekly | |
| Add PAGS to Watchlist: View: Get Complete PAGS Trend Analysis ➞ | |
 | STNE StoneCo Ltd. |
| Sector: Technology | |
| SubSector: Application Software | |
| MarketCap: 7347.82 Millions | |
| Recent Price: 16.61 Market Intelligence Score: 32 | |
| Day Percent Change: -0.69% Day Change: -0.11 | |
| Week Change: -0.75% Year-to-date Change: -7.9% | |
| STNE Links: Profile News Message Board | |
| Charts:- Daily , Weekly | |
| Add STNE to Watchlist: View: Get Complete STNE Trend Analysis ➞ | |
 | BTG B2Gold Corp. |
| Sector: Materials | |
| SubSector: Gold | |
| MarketCap: 2792.39 Millions | |
| Recent Price: 2.77 Market Intelligence Score: 100 | |
| Day Percent Change: -0.72% Day Change: -0.02 | |
| Week Change: 10.8% Year-to-date Change: -12.3% | |
| BTG Links: Profile News Message Board | |
| Charts:- Daily , Weekly | |
| Add BTG to Watchlist: View: Get Complete BTG Trend Analysis ➞ | |
 | QBTS D-Wave Quantum Inc. |
| Sector: Technology | |
| SubSector: Computer Hardware | |
| MarketCap: 290 Millions | |
| Recent Price: 1.30 Market Intelligence Score: 22 | |
| Day Percent Change: -0.76% Day Change: -0.01 | |
| Week Change: -7.47% Year-to-date Change: 48.2% | |
| QBTS Links: Profile News Message Board | |
| Charts:- Daily , Weekly | |
| Add QBTS to Watchlist: View: Get Complete QBTS Trend Analysis ➞ | |
 | CAE CAE Inc. |
| Sector: Industrials | |
| SubSector: Aerospace/Defense Products & Services | |
| MarketCap: 3739.61 Millions | |
| Recent Price: 20.94 Market Intelligence Score: 90 | |
| Day Percent Change: -0.76% Day Change: -0.16 | |
| Week Change: 2.3% Year-to-date Change: -3.0% | |
| CAE Links: Profile News Message Board | |
| Charts:- Daily , Weekly | |
| Add CAE to Watchlist: View: Get Complete CAE Trend Analysis ➞ | |
 | BBD Banco Bradesco S.A. |
| Sector: Financials | |
| SubSector: Foreign Regional Banks | |
| MarketCap: 30281.7 Millions | |
| Recent Price: 2.58 Market Intelligence Score: 0 | |
| Day Percent Change: -0.77% Day Change: -0.02 | |
| Week Change: -5.15% Year-to-date Change: -26.3% | |
| BBD Links: Profile News Message Board | |
| Charts:- Daily , Weekly | |
| Add BBD to Watchlist: View: Get Complete BBD Trend Analysis ➞ | |
 | TGB Taseko Mines Limited |
| Sector: Materials | |
| SubSector: Industrial Metals & Minerals | |
| MarketCap: 55.991 Millions | |
| Recent Price: 2.55 Market Intelligence Score: 75 | |
| Day Percent Change: -0.78% Day Change: -0.02 | |
| Week Change: 5.81% Year-to-date Change: 82.1% | |
| TGB Links: Profile News Message Board | |
| Charts:- Daily , Weekly | |
| Add TGB to Watchlist: View: Get Complete TGB Trend Analysis ➞ | |
 | VIV Telefonica Brasil S.A. |
| Sector: Technology | |
| SubSector: Wireless Communications | |
| MarketCap: 19611.1 Millions | |
| Recent Price: 8.75 Market Intelligence Score: 0 | |
| Day Percent Change: -0.79% Day Change: -0.07 | |
| Week Change: -12.06% Year-to-date Change: -20.0% | |
| VIV Links: Profile News Message Board | |
| Charts:- Daily , Weekly | |
| Add VIV to Watchlist: View: Get Complete VIV Trend Analysis ➞ | |
 | PBR Petroleo Brasileiro S.A. - Petrobras |
| Sector: Energy | |
| SubSector: Oil & Gas Drilling & Exploration | |
| MarketCap: 38939.2 Millions | |
| Recent Price: 17.08 Market Intelligence Score: 71 | |
| Day Percent Change: -0.81% Day Change: -0.14 | |
| Week Change: 3.96% Year-to-date Change: 7.0% | |
| PBR Links: Profile News Message Board | |
| Charts:- Daily , Weekly | |
| Add PBR to Watchlist: View: Get Complete PBR Trend Analysis ➞ | |
 | EBR Centrais Eletricas Brasileiras S.A. - Eletrobras |
| Sector: Utilities | |
| SubSector: Electric Utilities | |
| MarketCap: 5459.84 Millions | |
| Recent Price: 7.30 Market Intelligence Score: 8 | |
| Day Percent Change: -0.82% Day Change: -0.06 | |
| Week Change: -6.17% Year-to-date Change: -15.3% | |
| EBR Links: Profile News Message Board | |
| Charts:- Daily , Weekly | |
| Add EBR to Watchlist: View: Get Complete EBR Trend Analysis ➞ | |
 | NFGC New Found Gold Corp. |
| Sector: Materials | |
| SubSector: Gold | |
| MarketCap: 868 Millions | |
| Recent Price: 3.57 Market Intelligence Score: 46 | |
| Day Percent Change: -0.83% Day Change: -0.03 | |
| Week Change: 0.71% Year-to-date Change: 1.4% | |
| NFGC Links: Profile News Message Board | |
| Charts:- Daily , Weekly | |
| Add NFGC to Watchlist: View: Get Complete NFGC Trend Analysis ➞ | |
 | TFPM Triple Flag Precious Metals Corp. |
| Sector: Materials | |
| SubSector: Other Precious Metals & Mining | |
| MarketCap: 3640 Millions | |
| Recent Price: 16.45 Market Intelligence Score: 81 | |
| Day Percent Change: -0.84% Day Change: -0.14 | |
| Week Change: 1.04% Year-to-date Change: 24.2% | |
| TFPM Links: Profile News Message Board | |
| Charts:- Daily , Weekly | |
| Add TFPM to Watchlist: View: Get Complete TFPM Trend Analysis ➞ | |
 | EQX Equinox Gold Corp. |
| Sector: Materials | |
| SubSector: Gold | |
| MarketCap: 706.119 Millions | |
| Recent Price: 5.29 Market Intelligence Score: 38 | |
| Day Percent Change: -0.84% Day Change: -0.04 | |
| Week Change: -2.04% Year-to-date Change: 8.2% | |
| EQX Links: Profile News Message Board | |
| Charts:- Daily , Weekly | |
| Add EQX to Watchlist: View: Get Complete EQX Trend Analysis ➞ | |
 | ABEV Ambev S.A. |
| Sector: Consumer Staples | |
| SubSector: Beverages - Brewers | |
| MarketCap: 37753.5 Millions | |
| Recent Price: 2.32 Market Intelligence Score: 32 | |
| Day Percent Change: -0.85% Day Change: -0.02 | |
| Week Change: -4.53% Year-to-date Change: -17.1% | |
| ABEV Links: Profile News Message Board | |
| Charts:- Daily , Weekly | |
| Add ABEV to Watchlist: View: Get Complete ABEV Trend Analysis ➞ | |
 | VTRU Vitru Limited |
| Sector: Consumer Staples | |
| SubSector: Education & Training Services | |
| MarketCap: 33347 Millions | |
| Recent Price: 11.69 Market Intelligence Score: 20 | |
| Day Percent Change: -0.85% Day Change: -0.10 | |
| Week Change: -5.19% Year-to-date Change: -26.1% | |
| VTRU Links: Profile News Message Board | |
| Charts:- Daily , Weekly | |
| Add VTRU to Watchlist: View: Get Complete VTRU Trend Analysis ➞ | |
 | CINT CI&T Inc |
| Sector: Technology | |
| SubSector: Software - Infrastructure | |
| MarketCap: 806 Millions | |
| Recent Price: 3.42 Market Intelligence Score: 0 | |
| Day Percent Change: -0.87% Day Change: -0.03 | |
| Week Change: -10.7% Year-to-date Change: -35.8% | |
| CINT Links: Profile News Message Board | |
| Charts:- Daily , Weekly | |
| Add CINT to Watchlist: View: Get Complete CINT Trend Analysis ➞ | |
 | FSV FirstService Corporation |
| Sector: Financials | |
| SubSector: Property Management | |
| MarketCap: 2793.92 Millions | |
| Recent Price: 150.29 Market Intelligence Score: 43 | |
| Day Percent Change: -0.88% Day Change: -1.34 | |
| Week Change: 0.5% Year-to-date Change: -7.3% | |
| FSV Links: Profile News Message Board | |
| Charts:- Daily , Weekly | |
| Add FSV to Watchlist: View: Get Complete FSV Trend Analysis ➞ | |
 | CRON Cronos Group Inc. |
| Sector: Health Care | |
| SubSector: Biotechnology | |
| MarketCap: 1935.95 Millions | |
| Recent Price: 2.79 Market Intelligence Score: 93 | |
| Day Percent Change: -0.89% Day Change: -0.02 | |
| Week Change: 4.29% Year-to-date Change: 33.7% | |
| CRON Links: Profile News Message Board | |
| Charts:- Daily , Weekly | |
| Add CRON to Watchlist: View: Get Complete CRON Trend Analysis ➞ | |
 | ERF Enerplus Corporation |
| Sector: Energy | |
| SubSector: Oil & Gas Drilling & Exploration | |
| MarketCap: 372.639 Millions | |
| Recent Price: 19.93 Market Intelligence Score: 54 | |
| Day Percent Change: -0.90% Day Change: -0.18 | |
| Week Change: 1.89% Year-to-date Change: 29.9% | |
| ERF Links: Profile News Message Board | |
| Charts:- Daily , Weekly | |
| Add ERF to Watchlist: View: Get Complete ERF Trend Analysis ➞ | |
 | BHC Bausch Health Companies Inc. |
| Sector: Health Care | |
| SubSector: Drug Delivery | |
| MarketCap: 5485.3 Millions | |
| Recent Price: 6.88 Market Intelligence Score: 10 | |
| Day Percent Change: -0.94% Day Change: -0.07 | |
| Week Change: -11.96% Year-to-date Change: -14.2% | |
| BHC Links: Profile News Message Board | |
| Charts:- Daily , Weekly | |
| Add BHC to Watchlist: View: Get Complete BHC Trend Analysis ➞ | |
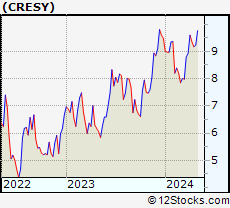 | CRESY Cresud Sociedad Anonima Comercial, Inmobiliaria, Financiera y Agropecuaria |
| Sector: Consumer Staples | |
| SubSector: Farm Products | |
| MarketCap: 224.187 Millions | |
| Recent Price: 10.22 Market Intelligence Score: 83 | |
| Day Percent Change: -0.97% Day Change: -0.10 | |
| Week Change: 4.61% Year-to-date Change: 7.8% | |
| CRESY Links: Profile News Message Board | |
| Charts:- Daily , Weekly | |
| Add CRESY to Watchlist: View: Get Complete CRESY Trend Analysis ➞ | |
 | NGD New Gold Inc. |
| Sector: Materials | |
| SubSector: Gold | |
| MarketCap: 398.119 Millions | |
| Recent Price: 1.95 Market Intelligence Score: 100 | |
| Day Percent Change: -1.02% Day Change: -0.02 | |
| Week Change: 7.73% Year-to-date Change: 33.6% | |
| NGD Links: Profile News Message Board | |
| Charts:- Daily , Weekly | |
| Add NGD to Watchlist: View: Get Complete NGD Trend Analysis ➞ | |
| To view more stocks, click on Next / Previous arrows or select different range: 0 - 25 , 25 - 50 , 50 - 75 , 75 - 100 , 100 - 125 , 125 - 150 , 150 - 175 , 175 - 200 , 200 - 225 | ||
| Click To Change The Sort Order: By Market Cap or Company Size Performance: Year-to-date, Week and Day | |
| Select Chart Type: | ||
 Best Stocks Today 12Stocks.com |
© 2024 12Stocks.com Terms & Conditions Privacy Contact Us
All Information Provided Only For Education And Not To Be Used For Investing or Trading. See Terms & Conditions


One More Thing ... Get Best Stocks Delivered Daily!
Never Ever Miss A Move With Our Top Ten Stocks Lists
Find Best Stocks In Any Market - Bull or Bear Market
Take A Peek At Our Top Ten Stocks Lists: Daily, Weekly, Year-to-Date & Top Trends
Find Best Stocks In Any Market - Bull or Bear Market
Take A Peek At Our Top Ten Stocks Lists: Daily, Weekly, Year-to-Date & Top Trends
Latin America Stocks With Best Up Trends [0-bearish to 100-bullish]: IAMGOLD [100], Ritchie Bros.[100], Ivanhoe Electric[100], Controladora Vuela[100], Manulife Financial[100], Enbridge [100], Kinross Gold[100], Teck Resources[100], Bank of Montreal[100], Fortuna Silver[100], Pembina Pipeline[100]
Best Latin America Stocks Year-to-Date:
Aurora Cannabis[1233.47%], Fusion [123.75%], Banco Macro[117.42%], Grupo Financiero[102.55%], Banco BBVA[101.1%], Grupo Supervielle[74.88%], Canopy Growth[72.99%], IAMGOLD [69.96%], Endeavour Silver[68.53%], Hudbay Minerals[59.06%], D-Wave Quantum[48.17%] Best Latin America Stocks This Week:
Endeavour Silver[25.28%], Ivanhoe Electric[19.85%], IAMGOLD [19.78%], Kinross Gold[15.17%], Vision Marine[14.54%], Fortuna Silver[13.51%], Bausch +[13.39%], IRSA Inversiones[12.91%], Pan American[11.51%], B2Gold [10.8%], Telecom Argentina[10.37%] Best Latin America Stocks Daily:
IAMGOLD [11.69%], Ritchie Bros.[4.87%], Azul S.A[4.36%], Vox Royalty[3.00%], Gildan Activewear[2.91%], Ivanhoe Electric[2.91%], Loma Negra[2.67%], Banco Bradesco[2.54%], Northern Dynasty[2.36%], SSR Mining[2.02%], Controladora Vuela[1.89%]