
 Login Sign Up


| |||||
 |  | ||||

| 12Stocks.com Market Intelligence |
Best Latin America Stocks
|
|
| Quick Read: Top Latin America Stocks By Performances & Trends: Daily, Weekly, Year-to-Date, Market Cap (Size) & Technical Trends | |||
| Best Latin America Views: Quick Browse View, Summary & Slide Show | |||
| 12Stocks.com Latin America Stocks Performances & Trends Daily | |||||||||
|
|  The overall market intelligence score is 0 (0-bearish to 100-bullish) which puts Latin America index in short term bearish trend. The market intelligence score from previous trading session is 7 and hence a deterioration of trend.
| ||||||||
| Here are the market intelligence trend scores of the most requested Latin America stocks at 12Stocks.com (click stock name for detailed review): | |
| Scroll down this page for most comprehensive review of Latin America stocks by performance, trends, technical analysis, charts, fund plays & more | |


| 12Stocks.com: Top Performing Latin America Index Stocks | ||||||||||||||||||||||||||||||||||||||||||||||||
 The top performing Latin America Index stocks year to date are
Now, more recently, over last week, the top performing Latin America Index stocks on the move are


|
||||||||||||||||||||||||||||||||||||||||||||||||
| 12Stocks.com: Investing in Latin America Index with Stocks | |
|
The following table helps investors and traders sort through current performance and trends (as measured by market intelligence score) of various
stocks in the Latin America Index. Quick View: Move mouse or cursor over stock symbol (ticker) to view short-term technical chart and over stock name to view long term chart. Click on  to add stock symbol to your watchlist and to add stock symbol to your watchlist and  to view watchlist. Click on any ticker or stock name for detailed market intelligence report for that stock. to view watchlist. Click on any ticker or stock name for detailed market intelligence report for that stock. |
12Stocks.com Performance of Stocks in Latin America Index
| Ticker | Stock Name | Watchlist | Category | Recent Price | Market Intelligence Score | Change % | YTD Change% |
| KGC | Kinross Gold |   | Materials | 6.51 | 93 | 1.40 | 7.60% |
| AQN | Algonquin Power | | Utilities | 5.84 | 35 | 1.39 | -7.59% |
| MUX | McEwen Mining | | Materials | 11.04 | 63 | 1.38 | 53.12% |
| VMAR | Vision Marine | | Services & Goods | 0.52 | 22 | 1.36 | -52.07% |
| KOF | Coca-Cola FEMSA | | Consumer Staples | 93.24 | 10 | 1.36 | -1.48% |
| SBS | Companhia de | | Utilities | 15.74 | 32 | 1.29 | 3.35% |
| LND | BrasilAgro - | | Financials | 4.80 | 52 | 1.27 | -9.09% |
| MERC | Mercer | | Consumer Staples | 9.57 | 68 | 1.27 | 0.95% |
| GGAL | Grupo Financiero | | Financials | 28.03 | 73 | 1.26 | 62.35% |
| ARCO | Arcos Dorados | | Services & Goods | 10.76 | 17 | 1.13 | -15.21% |
| ASR | Grupo Aeroportuario | | Transports | 307.14 | 46 | 1.12 | 4.37% |
| CINT | CI&T | | Technology | 4.09 | 22 | 1.11 | -23.10% |
| NU | Nu | | Financials | 10.91 | 49 | 1.11 | 30.82% |
| TECK | Teck Resources | | Materials | 47.72 | 71 | 1.10 | 12.89% |
| MOGO | Mogo | | Financials | 1.84 | 41 | 1.10 | -0.54% |
| FTS | Fortis | | Utilities | 38.05 | 42 | 1.09 | -7.49% |
| BB | BlackBerry | | Technology | 2.79 | 40 | 1.09 | -21.19% |
| RCI | Rogers | | Technology | 38.30 | 32 | 1.08 | -18.18% |
| PAC | Grupo Aeroportuario | | Transports | 155.90 | 10 | 1.04 | -11.03% |
| EMX | EMX Royalty | | Materials | 1.95 | 61 | 1.04 | 20.37% |
| ABCL | AbCellera Biologics | | Health Care | 3.96 | 12 | 1.02 | -29.91% |
| FNV | Franco-Nevada | | Materials | 121.67 | 88 | 1.00 | 9.80% |
| THM | Tower | | Materials | 0.67 | 51 | 0.98 | 14.51% |
| SLF | Sun Life | | Financials | 50.66 | 25 | 0.90 | -2.31% |
| QSR | Restaurant Brands | | Services & Goods | 71.36 | 32 | 0.89 | -8.67% |
| To view more stocks, click on Next / Previous arrows or select different range: 0 - 25 , 25 - 50 , 50 - 75 , 75 - 100 , 100 - 125 , 125 - 150 , 150 - 175 , 175 - 200 , 200 - 225 | ||
 | Click To Change The Sort Order: By Market Cap or Company Size Performance: Year-to-date, Week and Day |  |
| Detailed Overview Of Latin America Stocks |
| Latin America Technical Overview, Leaders & Laggards, Top Latin America ETF Funds & Detailed Latin America Stocks List, Charts, Trends & More |
| Latin America: Technical Analysis, Trends & YTD Performance | |
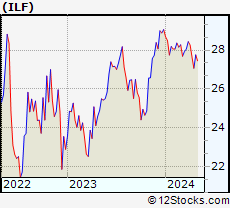
 ILF Weekly Chart |
|
| Long Term Trend: Not Good | |
| Medium Term Trend: Not Good | |
 ILF Daily Chart |
|
| Short Term Trend: Not Good | |
| Overall Trend Score: 0 | |
| YTD Performance: -7.95% | |
| **Trend Scores & Views Are Only For Educational Purposes And Not For Investing | |
| 12Stocks.com: Investing in Latin America Index using Exchange Traded Funds | |
|
The following table shows list of key exchange traded funds (ETF) that
help investors play Latin America stock market. For detailed view, check out our ETF Funds section of our website. Quick View: Move mouse or cursor over ETF symbol (ticker) to view short-term technical chart and over ETF name to view long term chart. Click on ticker or stock name for detailed view. Click on to add stock symbol to your watchlist and to view watchlist. |
12Stocks.com List of ETFs that track Latin America Index
| Ticker | ETF Name | Watchlist | Recent Price | Market Intelligence Score | Change % | Week % | Year-to-date % |
| ILF | Latin America 40 | | 26.75 | 0 | -0.22 | -3.25 | -7.95% |
| EWC | Canada | | 36.85 | 56 | 0.22 | -0.81 | 0.46% |
| FLN | Latin America AlphaDEX | | 19.09 | 0 | -0.50 | -6.42 | -8.18% |
| EWZ | Brazil | | 30.11 | 17 | -0.20 | -3.71 | -13.87% |
| EWW | Mexico | | 64.92 | 0 | 0.00 | -3.71 | -4.32% |
| ARGT | Argentina | | 52.91 | 26 | -0.23 | -4.89 | 3.06% |
| EWZS | Brazil Small-Cap | | 12.80 | 10 | -0.62 | -5.5 | -15.01% |
| BRF | Brazil Small-Cap | | 14.63 | 10 | -0.73 | -6.01 | -16.82% |
| BZQ | Short Brazil | | 13.26 | 100 | 0.38 | 7.72 | 32.2% |
| BRZU | Brazil Bull 3X | | 73.72 | 7 | -0.54 | -7.58 | -28.34% |
| FBZ | Brazil AlphaDEX | | 11.03 | 0 | -1.11 | -6.95 | -9.78% |
| 12Stocks.com: Charts, Trends, Fundamental Data and Performances of Latin America Stocks | |
|
We now take in-depth look at all Latin America stocks including charts, multi-period performances and overall trends (as measured by market intelligence score). One can sort Latin America stocks (click link to choose) by Daily, Weekly and by Year-to-Date performances. Also, one can sort by size of the company or by market capitalization. |
| Select Your Default Chart Type: | |||||
| |||||
| Click on stock symbol or name for detailed view. Click on to add stock symbol to your watchlist and to view watchlist. Quick View: Move mouse or cursor over "Daily" to quickly view daily technical stock chart and over "Weekly" to view weekly technical stock chart. | |||||

 | KGC Kinross Gold Corporation |
| Sector: Materials | |
| SubSector: Gold | |
| MarketCap: 5389.29 Millions | |
| Recent Price: 6.51 Market Intelligence Score: 93 | |
| Day Percent Change: 1.40% Day Change: 0.09 | |
| Week Change: 0.46% Year-to-date Change: 7.6% | |
| KGC Links: Profile News Message Board | |
| Charts:- Daily , Weekly | |
| Add KGC to Watchlist: View: Get Complete KGC Trend Analysis ➞ | |
 | AQN Algonquin Power & Utilities Corp. |
| Sector: Utilities | |
| SubSector: Diversified Utilities | |
| MarketCap: 5916.4 Millions | |
| Recent Price: 5.84 Market Intelligence Score: 35 | |
| Day Percent Change: 1.39% Day Change: 0.08 | |
| Week Change: -1.52% Year-to-date Change: -7.6% | |
| AQN Links: Profile News Message Board | |
| Charts:- Daily , Weekly | |
| Add AQN to Watchlist: View: Get Complete AQN Trend Analysis ➞ | |
 | MUX McEwen Mining Inc. |
| Sector: Materials | |
| SubSector: Gold | |
| MarketCap: 264.819 Millions | |
| Recent Price: 11.04 Market Intelligence Score: 63 | |
| Day Percent Change: 1.38% Day Change: 0.15 | |
| Week Change: -2.47% Year-to-date Change: 53.1% | |
| MUX Links: Profile News Message Board | |
| Charts:- Daily , Weekly | |
| Add MUX to Watchlist: View: Get Complete MUX Trend Analysis ➞ | |
 | VMAR Vision Marine Technologies Inc. |
| Sector: Services & Goods | |
| SubSector: Leisure | |
| MarketCap: 99027 Millions | |
| Recent Price: 0.52 Market Intelligence Score: 22 | |
| Day Percent Change: 1.36% Day Change: 0.01 | |
| Week Change: -19.65% Year-to-date Change: -52.1% | |
| VMAR Links: Profile News Message Board | |
| Charts:- Daily , Weekly | |
| Add VMAR to Watchlist: View: Get Complete VMAR Trend Analysis ➞ | |
 | KOF Coca-Cola FEMSA, S.A.B. de C.V. |
| Sector: Consumer Staples | |
| SubSector: Beverages - Soft Drinks | |
| MarketCap: 2258.9 Millions | |
| Recent Price: 93.24 Market Intelligence Score: 10 | |
| Day Percent Change: 1.36% Day Change: 1.25 | |
| Week Change: -4% Year-to-date Change: -1.5% | |
| KOF Links: Profile News Message Board | |
| Charts:- Daily , Weekly | |
| Add KOF to Watchlist: View: Get Complete KOF Trend Analysis ➞ | |
 | SBS Companhia de Saneamento Basico do Estado de Sao Paulo - SABESP |
| Sector: Utilities | |
| SubSector: Water Utilities | |
| MarketCap: 5498.72 Millions | |
| Recent Price: 15.74 Market Intelligence Score: 32 | |
| Day Percent Change: 1.29% Day Change: 0.20 | |
| Week Change: -0.32% Year-to-date Change: 3.4% | |
| SBS Links: Profile News Message Board | |
| Charts:- Daily , Weekly | |
| Add SBS to Watchlist: View: Get Complete SBS Trend Analysis ➞ | |
 | LND BrasilAgro - Companhia Brasileira de Propriedades Agricolas |
| Sector: Financials | |
| SubSector: Property Management | |
| MarketCap: 157.842 Millions | |
| Recent Price: 4.80 Market Intelligence Score: 52 | |
| Day Percent Change: 1.27% Day Change: 0.06 | |
| Week Change: -0.21% Year-to-date Change: -9.1% | |
| LND Links: Profile News Message Board | |
| Charts:- Daily , Weekly | |
| Add LND to Watchlist: View: Get Complete LND Trend Analysis ➞ | |
 | MERC Mercer International Inc. |
| Sector: Consumer Staples | |
| SubSector: Paper & Paper Products | |
| MarketCap: 509.003 Millions | |
| Recent Price: 9.57 Market Intelligence Score: 68 | |
| Day Percent Change: 1.27% Day Change: 0.12 | |
| Week Change: 1.38% Year-to-date Change: 1.0% | |
| MERC Links: Profile News Message Board | |
| Charts:- Daily , Weekly | |
| Add MERC to Watchlist: View: Get Complete MERC Trend Analysis ➞ | |
 | GGAL Grupo Financiero Galicia S.A. |
| Sector: Financials | |
| SubSector: Foreign Regional Banks | |
| MarketCap: 1274.69 Millions | |
| Recent Price: 28.03 Market Intelligence Score: 73 | |
| Day Percent Change: 1.26% Day Change: 0.35 | |
| Week Change: -5.84% Year-to-date Change: 62.4% | |
| GGAL Links: Profile News Message Board | |
| Charts:- Daily , Weekly | |
| Add GGAL to Watchlist: View: Get Complete GGAL Trend Analysis ➞ | |
 | ARCO Arcos Dorados Holdings Inc. |
| Sector: Services & Goods | |
| SubSector: Restaurants | |
| MarketCap: 778.87 Millions | |
| Recent Price: 10.76 Market Intelligence Score: 17 | |
| Day Percent Change: 1.13% Day Change: 0.12 | |
| Week Change: -2.18% Year-to-date Change: -15.2% | |
| ARCO Links: Profile News Message Board | |
| Charts:- Daily , Weekly | |
| Add ARCO to Watchlist: View: Get Complete ARCO Trend Analysis ➞ | |
 | ASR Grupo Aeroportuario del Sureste, S. A. B. de C. V. |
| Sector: Transports | |
| SubSector: Air Services, Other | |
| MarketCap: 2739.98 Millions | |
| Recent Price: 307.14 Market Intelligence Score: 46 | |
| Day Percent Change: 1.12% Day Change: 3.40 | |
| Week Change: -3.11% Year-to-date Change: 4.4% | |
| ASR Links: Profile News Message Board | |
| Charts:- Daily , Weekly | |
| Add ASR to Watchlist: View: Get Complete ASR Trend Analysis ➞ | |
 | CINT CI&T Inc |
| Sector: Technology | |
| SubSector: Software - Infrastructure | |
| MarketCap: 806 Millions | |
| Recent Price: 4.09 Market Intelligence Score: 22 | |
| Day Percent Change: 1.11% Day Change: 0.04 | |
| Week Change: -12.87% Year-to-date Change: -23.1% | |
| CINT Links: Profile News Message Board | |
| Charts:- Daily , Weekly | |
| Add CINT to Watchlist: View: Get Complete CINT Trend Analysis ➞ | |
 | NU Nu Holdings Ltd. |
| Sector: Financials | |
| SubSector: Banks - Diversified | |
| MarketCap: 37240 Millions | |
| Recent Price: 10.91 Market Intelligence Score: 49 | |
| Day Percent Change: 1.11% Day Change: 0.12 | |
| Week Change: -3.37% Year-to-date Change: 30.8% | |
| NU Links: Profile News Message Board | |
| Charts:- Daily , Weekly | |
| Add NU to Watchlist: View: Get Complete NU Trend Analysis ➞ | |
 | TECK Teck Resources Limited |
| Sector: Materials | |
| SubSector: Industrial Metals & Minerals | |
| MarketCap: 4347.4 Millions | |
| Recent Price: 47.72 Market Intelligence Score: 71 | |
| Day Percent Change: 1.10% Day Change: 0.52 | |
| Week Change: -0.38% Year-to-date Change: 12.9% | |
| TECK Links: Profile News Message Board | |
| Charts:- Daily , Weekly | |
| Add TECK to Watchlist: View: Get Complete TECK Trend Analysis ➞ | |
 | MOGO Mogo Inc. |
| Sector: Financials | |
| SubSector: Credit Services | |
| MarketCap: 21.9208 Millions | |
| Recent Price: 1.84 Market Intelligence Score: 41 | |
| Day Percent Change: 1.10% Day Change: 0.02 | |
| Week Change: -6.12% Year-to-date Change: -0.5% | |
| MOGO Links: Profile News Message Board | |
| Charts:- Daily , Weekly | |
| Add MOGO to Watchlist: View: Get Complete MOGO Trend Analysis ➞ | |
 | FTS Fortis Inc. |
| Sector: Utilities | |
| SubSector: Electric Utilities | |
| MarketCap: 14741.8 Millions | |
| Recent Price: 38.05 Market Intelligence Score: 42 | |
| Day Percent Change: 1.09% Day Change: 0.41 | |
| Week Change: 1.14% Year-to-date Change: -7.5% | |
| FTS Links: Profile News Message Board | |
| Charts:- Daily , Weekly | |
| Add FTS to Watchlist: View: Get Complete FTS Trend Analysis ➞ | |
 | BB BlackBerry Limited |
| Sector: Technology | |
| SubSector: Communication Equipment | |
| MarketCap: 2100.39 Millions | |
| Recent Price: 2.79 Market Intelligence Score: 40 | |
| Day Percent Change: 1.09% Day Change: 0.03 | |
| Week Change: -8.52% Year-to-date Change: -21.2% | |
| BB Links: Profile News Message Board | |
| Charts:- Daily , Weekly | |
| Add BB to Watchlist: View: Get Complete BB Trend Analysis ➞ | |
 | RCI Rogers Communications Inc. |
| Sector: Technology | |
| SubSector: Wireless Communications | |
| MarketCap: 22111.6 Millions | |
| Recent Price: 38.30 Market Intelligence Score: 32 | |
| Day Percent Change: 1.08% Day Change: 0.41 | |
| Week Change: -2.22% Year-to-date Change: -18.2% | |
| RCI Links: Profile News Message Board | |
| Charts:- Daily , Weekly | |
| Add RCI to Watchlist: View: Get Complete RCI Trend Analysis ➞ | |
 | PAC Grupo Aeroportuario del Pacifico, S.A.B. de C.V. |
| Sector: Transports | |
| SubSector: Air Services, Other | |
| MarketCap: 3204.18 Millions | |
| Recent Price: 155.90 Market Intelligence Score: 10 | |
| Day Percent Change: 1.04% Day Change: 1.61 | |
| Week Change: -4.21% Year-to-date Change: -11.0% | |
| PAC Links: Profile News Message Board | |
| Charts:- Daily , Weekly | |
| Add PAC to Watchlist: View: Get Complete PAC Trend Analysis ➞ | |
 | EMX EMX Royalty Corporation |
| Sector: Materials | |
| SubSector: Industrial Metals & Minerals | |
| MarketCap: 103.91 Millions | |
| Recent Price: 1.95 Market Intelligence Score: 61 | |
| Day Percent Change: 1.04% Day Change: 0.02 | |
| Week Change: 1.56% Year-to-date Change: 20.4% | |
| EMX Links: Profile News Message Board | |
| Charts:- Daily , Weekly | |
| Add EMX to Watchlist: View: Get Complete EMX Trend Analysis ➞ | |
 | ABCL AbCellera Biologics Inc. |
| Sector: Health Care | |
| SubSector: Biotechnology | |
| MarketCap: 1870 Millions | |
| Recent Price: 3.96 Market Intelligence Score: 12 | |
| Day Percent Change: 1.02% Day Change: 0.04 | |
| Week Change: -8.76% Year-to-date Change: -29.9% | |
| ABCL Links: Profile News Message Board | |
| Charts:- Daily , Weekly | |
| Add ABCL to Watchlist: View: Get Complete ABCL Trend Analysis ➞ | |
 | FNV Franco-Nevada Corporation |
| Sector: Materials | |
| SubSector: Gold | |
| MarketCap: 17703.9 Millions | |
| Recent Price: 121.67 Market Intelligence Score: 88 | |
| Day Percent Change: 1.00% Day Change: 1.20 | |
| Week Change: 3.07% Year-to-date Change: 9.8% | |
| FNV Links: Profile News Message Board | |
| Charts:- Daily , Weekly | |
| Add FNV to Watchlist: View: Get Complete FNV Trend Analysis ➞ | |
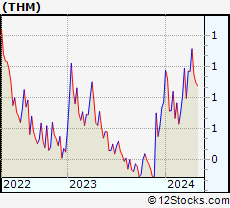 | THM International Tower Hill Mines Ltd. |
| Sector: Materials | |
| SubSector: Gold | |
| MarketCap: 70.4619 Millions | |
| Recent Price: 0.67 Market Intelligence Score: 51 | |
| Day Percent Change: 0.98% Day Change: 0.01 | |
| Week Change: -11.45% Year-to-date Change: 14.5% | |
| THM Links: Profile News Message Board | |
| Charts:- Daily , Weekly | |
| Add THM to Watchlist: View: Get Complete THM Trend Analysis ➞ | |
 | SLF Sun Life Financial Inc. |
| Sector: Financials | |
| SubSector: Property & Casualty Insurance | |
| MarketCap: 17722 Millions | |
| Recent Price: 50.66 Market Intelligence Score: 25 | |
| Day Percent Change: 0.90% Day Change: 0.45 | |
| Week Change: -0.57% Year-to-date Change: -2.3% | |
| SLF Links: Profile News Message Board | |
| Charts:- Daily , Weekly | |
| Add SLF to Watchlist: View: Get Complete SLF Trend Analysis ➞ | |
 | QSR Restaurant Brands International Inc. |
| Sector: Services & Goods | |
| SubSector: Restaurants | |
| MarketCap: 9551 Millions | |
| Recent Price: 71.36 Market Intelligence Score: 32 | |
| Day Percent Change: 0.89% Day Change: 0.63 | |
| Week Change: -1.18% Year-to-date Change: -8.7% | |
| QSR Links: Profile News Message Board | |
| Charts:- Daily , Weekly | |
| Add QSR to Watchlist: View: Get Complete QSR Trend Analysis ➞ | |
| To view more stocks, click on Next / Previous arrows or select different range: 0 - 25 , 25 - 50 , 50 - 75 , 75 - 100 , 100 - 125 , 125 - 150 , 150 - 175 , 175 - 200 , 200 - 225 | ||
| Click To Change The Sort Order: By Market Cap or Company Size Performance: Year-to-date, Week and Day | |
| Select Chart Type: | ||
 Best Stocks Today 12Stocks.com |
© 2024 12Stocks.com Terms & Conditions Privacy Contact Us
All Information Provided Only For Education And Not To Be Used For Investing or Trading. See Terms & Conditions


One More Thing ... Get Best Stocks Delivered Daily!
Never Ever Miss A Move With Our Top Ten Stocks Lists
Find Best Stocks In Any Market - Bull or Bear Market
Take A Peek At Our Top Ten Stocks Lists: Daily, Weekly, Year-to-Date & Top Trends
Find Best Stocks In Any Market - Bull or Bear Market
Take A Peek At Our Top Ten Stocks Lists: Daily, Weekly, Year-to-Date & Top Trends
Latin America Stocks With Best Up Trends [0-bearish to 100-bullish]: IMAX [100], SilverCrest Metals[93], Ivanhoe Electric[93], Agnico Eagle[93], Kinross Gold[93], Aurora Cannabis[88], Franco-Nevada [88], Sandstorm Gold[88], Hudbay Minerals[86], Suncor Energy[83], Triple Flag[83]
Best Latin America Stocks Year-to-Date:
Aurora Cannabis[1272.32%], Fusion [121.25%], D-Wave Quantum[100.02%], Banco Macro[68.33%], Grupo Financiero[62.35%], Canopy Growth[53.23%], McEwen Mining[53.12%], Celestica [49.62%], Banco BBVA[48.35%], IAMGOLD [43.87%], OrganiGram [42.75%] Best Latin America Stocks This Week:
Controladora Vuela[11.35%], D-Wave Quantum[7.67%], TransAlta [6.11%], SilverCrest Metals[4.99%], Canada Goose[4.17%], IMAX [4.14%], Hudbay Minerals[3.41%], Lululemon Athletica[3.39%], Agnico Eagle[3.29%], Ivanhoe Electric[3.25%], Franco-Nevada [3.07%] Best Latin America Stocks Daily:
Canopy Growth[20.65%], Aurora Cannabis[12.87%], SilverCrest Metals[6.02%], D-Wave Quantum[5.09%], Controladora Vuela[4.53%], Ivanhoe Electric[3.95%], Hudbay Minerals[3.55%], TransAlta [3.38%], New Found[2.20%], OrganiGram [2.19%], Bausch +[2.03%]