
 Login Sign Up


| |||||
 |  | ||||

| 12Stocks.com Market Intelligence |
Best Latin America Stocks
|
|
| Quick Read: Top Latin America Stocks By Performances & Trends: Daily, Weekly, Year-to-Date, Market Cap (Size) & Technical Trends | |||
| Best Latin America Views: Quick Browse View, Summary & Slide Show | |||
| 12Stocks.com Latin America Stocks Performances & Trends Daily | |||||||||
|
|  The overall market intelligence score is 78 (0-bearish to 100-bullish) which puts Latin America index in short term neutral to bullish trend. The market intelligence score from previous trading session is 90 and hence a deterioration of trend.
| ||||||||
| Here are the market intelligence trend scores of the most requested Latin America stocks at 12Stocks.com (click stock name for detailed review): | |
| Scroll down this page for most comprehensive review of Latin America stocks by performance, trends, technical analysis, charts, fund plays & more | |


| 12Stocks.com: Top Performing Latin America Index Stocks | ||||||||||||||||||||||||||||||||||||||||||||||||
 The top performing Latin America Index stocks year to date are
Now, more recently, over last week, the top performing Latin America Index stocks on the move are


|
||||||||||||||||||||||||||||||||||||||||||||||||
| 12Stocks.com: Investing in Latin America Index with Stocks | |
|
The following table helps investors and traders sort through current performance and trends (as measured by market intelligence score) of various
stocks in the Latin America Index. Quick View: Move mouse or cursor over stock symbol (ticker) to view short-term technical chart and over stock name to view long term chart. Click on  to add stock symbol to your watchlist and to add stock symbol to your watchlist and  to view watchlist. Click on any ticker or stock name for detailed market intelligence report for that stock. to view watchlist. Click on any ticker or stock name for detailed market intelligence report for that stock. |
12Stocks.com Performance of Stocks in Latin America Index
| Ticker | Stock Name | Watchlist | Category | Recent Price | Market Intelligence Score | Change % | YTD Change% |
| SNDL | Sundial Growers |   | Health Care | 2.44 | 73 | -4.51 | 48.48% |
| CGC | Canopy Growth | | Health Care | 9.04 | 53 | -4.74 | 76.91% |
| VIV | Telefonica Brasil | | Technology | 9.27 | 7 | -5.02 | -15.27% |
| BHC | Bausch Health | | Health Care | 7.03 | 0 | -5.13 | -12.34% |
| ABCL | AbCellera Biologics | | Health Care | 3.83 | 12 | -5.20 | -32.21% |
| LEV | Lion Electric | | Industrials | 0.98 | 62 | -5.77 | -44.79% |
| BGI | Birks | | Services & Goods | 2.42 | 45 | -5.84 | -48.40% |
| APT | Alpha Pro | | Industrials | 5.75 | 64 | -6.05 | 8.70% |
| THTX | Thera | | Health Care | 1.11 | 0 | -11.90 | -31.48% |
| SHOP | Shopify | | Technology | 62.73 | 0 | -18.59 | -19.47% |
| To view more stocks, click on Next / Previous arrows or select different range: 0 - 25 , 25 - 50 , 50 - 75 , 75 - 100 , 100 - 125 , 125 - 150 , 150 - 175 , 175 - 200 , 200 - 225 | ||
 | Click To Change The Sort Order: By Market Cap or Company Size Performance: Year-to-date, Week and Day |  |
| Detailed Overview Of Latin America Stocks |
| Latin America Technical Overview, Leaders & Laggards, Top Latin America ETF Funds & Detailed Latin America Stocks List, Charts, Trends & More |
| Latin America: Technical Analysis, Trends & YTD Performance | |
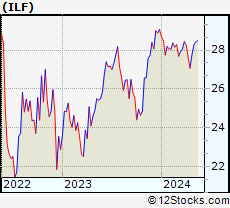
 ILF Weekly Chart |
|
| Long Term Trend: Very Good | |
| Medium Term Trend: Very Good | |
 ILF Daily Chart |
|
| Short Term Trend: Very Good | |
| Overall Trend Score: 78 | |
| YTD Performance: -1.58% | |
| **Trend Scores & Views Are Only For Educational Purposes And Not For Investing | |
| 12Stocks.com: Investing in Latin America Index using Exchange Traded Funds | |
|
The following table shows list of key exchange traded funds (ETF) that
help investors play Latin America stock market. For detailed view, check out our ETF Funds section of our website. Quick View: Move mouse or cursor over ETF symbol (ticker) to view short-term technical chart and over ETF name to view long term chart. Click on ticker or stock name for detailed view. Click on to add stock symbol to your watchlist and to view watchlist. |
12Stocks.com List of ETFs that track Latin America Index
| Ticker | ETF Name | Watchlist | Recent Price | Market Intelligence Score | Change % | Week % | Year-to-date % |
| ILF | Latin America 40 | | 28.60 | 78 | -0.03 | 1.2 | -1.58% |
| EWC | Canada | | 37.90 | 81 | -0.29 | 0.88 | 3.33% |
| FLN | Latin America AlphaDEX | | 20.08 | 49 | -0.05 | 0 | -3.42% |
| EWZ | Brazil | | 32.40 | 45 | -0.37 | 0.28 | -7.32% |
| EWW | Mexico | | 67.06 | 76 | 0.12 | 0.39 | -1.16% |
| ARGT | Argentina | | 63.76 | 100 | 0.63 | 3.96 | 24.19% |
| EWZS | Brazil Small-Cap | | 13.80 | 52 | -0.29 | -0.79 | -8.37% |
| BRF | Brazil Small-Cap | | 15.74 | 45 | -1.01 | -1.13 | -10.51% |
| BZQ | Short Brazil | | 11.44 | 68 | 0.62 | -0.35 | 14.06% |
| BRZU | Brazil Bull 3X | | 84.84 | 40 | -0.82 | 0.49 | -17.53% |
| FBZ | Brazil AlphaDEX | | 11.78 | 62 | -0.11 | -0.63 | -3.65% |
| 12Stocks.com: Charts, Trends, Fundamental Data and Performances of Latin America Stocks | |
|
We now take in-depth look at all Latin America stocks including charts, multi-period performances and overall trends (as measured by market intelligence score). One can sort Latin America stocks (click link to choose) by Daily, Weekly and by Year-to-Date performances. Also, one can sort by size of the company or by market capitalization. |
| Select Your Default Chart Type: | |||||
| |||||
| Click on stock symbol or name for detailed view. Click on to add stock symbol to your watchlist and to view watchlist. Quick View: Move mouse or cursor over "Daily" to quickly view daily technical stock chart and over "Weekly" to view weekly technical stock chart. | |||||

 | SNDL Sundial Growers Inc. |
| Sector: Health Care | |
| SubSector: Drug Manufacturers - Other | |
| MarketCap: 94.4033 Millions | |
| Recent Price: 2.44 Market Intelligence Score: 73 | |
| Day Percent Change: -4.51% Day Change: -0.11 | |
| Week Change: 3.62% Year-to-date Change: 48.5% | |
| SNDL Links: Profile News Message Board | |
| Charts:- Daily , Weekly | |
| Add SNDL to Watchlist: View: Get Complete SNDL Trend Analysis ➞ | |
 | CGC Canopy Growth Corporation |
| Sector: Health Care | |
| SubSector: Drug Manufacturers - Other | |
| MarketCap: 4136.33 Millions | |
| Recent Price: 9.04 Market Intelligence Score: 53 | |
| Day Percent Change: -4.74% Day Change: -0.45 | |
| Week Change: -11.72% Year-to-date Change: 76.9% | |
| CGC Links: Profile News Message Board | |
| Charts:- Daily , Weekly | |
| Add CGC to Watchlist: View: Get Complete CGC Trend Analysis ➞ | |
 | VIV Telefonica Brasil S.A. |
| Sector: Technology | |
| SubSector: Wireless Communications | |
| MarketCap: 19611.1 Millions | |
| Recent Price: 9.27 Market Intelligence Score: 7 | |
| Day Percent Change: -5.02% Day Change: -0.49 | |
| Week Change: -6.83% Year-to-date Change: -15.3% | |
| VIV Links: Profile News Message Board | |
| Charts:- Daily , Weekly | |
| Add VIV to Watchlist: View: Get Complete VIV Trend Analysis ➞ | |
 | BHC Bausch Health Companies Inc. |
| Sector: Health Care | |
| SubSector: Drug Delivery | |
| MarketCap: 5485.3 Millions | |
| Recent Price: 7.03 Market Intelligence Score: 0 | |
| Day Percent Change: -5.13% Day Change: -0.38 | |
| Week Change: -10.1% Year-to-date Change: -12.3% | |
| BHC Links: Profile News Message Board | |
| Charts:- Daily , Weekly | |
| Add BHC to Watchlist: View: Get Complete BHC Trend Analysis ➞ | |
 | ABCL AbCellera Biologics Inc. |
| Sector: Health Care | |
| SubSector: Biotechnology | |
| MarketCap: 1870 Millions | |
| Recent Price: 3.83 Market Intelligence Score: 12 | |
| Day Percent Change: -5.20% Day Change: -0.21 | |
| Week Change: -7.15% Year-to-date Change: -32.2% | |
| ABCL Links: Profile News Message Board | |
| Charts:- Daily , Weekly | |
| Add ABCL to Watchlist: View: Get Complete ABCL Trend Analysis ➞ | |
 | LEV The Lion Electric Company |
| Sector: Industrials | |
| SubSector: Farm & Heavy Construction Machinery | |
| MarketCap: 414 Millions | |
| Recent Price: 0.98 Market Intelligence Score: 62 | |
| Day Percent Change: -5.77% Day Change: -0.06 | |
| Week Change: -2.97% Year-to-date Change: -44.8% | |
| LEV Links: Profile News Message Board | |
| Charts:- Daily , Weekly | |
| Add LEV to Watchlist: View: Get Complete LEV Trend Analysis ➞ | |
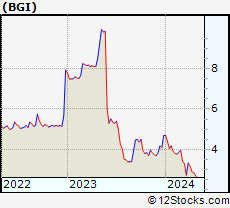 | BGI Birks Group Inc. |
| Sector: Services & Goods | |
| SubSector: Jewelry Stores | |
| MarketCap: 9 Millions | |
| Recent Price: 2.42 Market Intelligence Score: 45 | |
| Day Percent Change: -5.84% Day Change: -0.15 | |
| Week Change: -3.59% Year-to-date Change: -48.4% | |
| BGI Links: Profile News Message Board | |
| Charts:- Daily , Weekly | |
| Add BGI to Watchlist: View: Get Complete BGI Trend Analysis ➞ | |
 | APT Alpha Pro Tech, Ltd. |
| Sector: Industrials | |
| SubSector: General Building Materials | |
| MarketCap: 125.953 Millions | |
| Recent Price: 5.75 Market Intelligence Score: 64 | |
| Day Percent Change: -6.05% Day Change: -0.37 | |
| Week Change: -5.58% Year-to-date Change: 8.7% | |
| APT Links: Profile News Message Board | |
| Charts:- Daily , Weekly | |
| Add APT to Watchlist: View: Get Complete APT Trend Analysis ➞ | |
 | THTX Theratechnologies Inc. |
| Sector: Health Care | |
| SubSector: Drugs - Generic | |
| MarketCap: 123.185 Millions | |
| Recent Price: 1.11 Market Intelligence Score: 0 | |
| Day Percent Change: -11.90% Day Change: -0.15 | |
| Week Change: -13.28% Year-to-date Change: -31.5% | |
| THTX Links: Profile News Message Board | |
| Charts:- Daily , Weekly | |
| Add THTX to Watchlist: View: Get Complete THTX Trend Analysis ➞ | |
 | SHOP Shopify Inc. |
| Sector: Technology | |
| SubSector: Application Software | |
| MarketCap: 45164.2 Millions | |
| Recent Price: 62.73 Market Intelligence Score: 0 | |
| Day Percent Change: -18.59% Day Change: -14.32 | |
| Week Change: -15.75% Year-to-date Change: -19.5% | |
| SHOP Links: Profile News Message Board | |
| Charts:- Daily , Weekly | |
| Add SHOP to Watchlist: View: Get Complete SHOP Trend Analysis ➞ | |
| To view more stocks, click on Next / Previous arrows or select different range: 0 - 25 , 25 - 50 , 50 - 75 , 75 - 100 , 100 - 125 , 125 - 150 , 150 - 175 , 175 - 200 , 200 - 225 | ||
| Click To Change The Sort Order: By Market Cap or Company Size Performance: Year-to-date, Week and Day | |
| Select Chart Type: | ||
 Best Stocks Today 12Stocks.com |
© 2024 12Stocks.com Terms & Conditions Privacy Contact Us
All Information Provided Only For Education And Not To Be Used For Investing or Trading. See Terms & Conditions


One More Thing ... Get Best Stocks Delivered Daily!
Never Ever Miss A Move With Our Top Ten Stocks Lists
Find Best Stocks In Any Market - Bull or Bear Market
Take A Peek At Our Top Ten Stocks Lists: Daily, Weekly, Year-to-Date & Top Trends
Find Best Stocks In Any Market - Bull or Bear Market
Take A Peek At Our Top Ten Stocks Lists: Daily, Weekly, Year-to-Date & Top Trends
Latin America Stocks With Best Up Trends [0-bearish to 100-bullish]: BRF S.A[100], Kinross Gold[100], Telecom Argentina[100], IRSA Inversiones[100], YPF Sociedad[100], MercadoLibre [100], Banco Macro[100], Banco BBVA[100], Grupo Supervielle[100], Pembina Pipeline[100], Cresud Sociedad[100]
Best Latin America Stocks Year-to-Date:
Aurora Cannabis[1248.17%], Banco Macro[124.63%], Fusion [122.81%], Grupo Financiero[109.18%], Banco BBVA[105.51%], Grupo Supervielle[79.56%], Canopy Growth[76.91%], McEwen Mining[68.93%], Hudbay Minerals[52.9%], D-Wave Quantum[51.58%], IAMGOLD [49.41%] Best Latin America Stocks This Week:
IRSA Inversiones[13.52%], Telecom Argentina[12.47%], BRF S.A[11.71%], Ivanhoe Electric[11.33%], Vision Marine[9.15%], Repare [9.1%], Bausch +[8.98%], Kinross Gold[7.74%], Banco Macro[7.06%], Banco BBVA[6.58%], Cresud Sociedad[6.55%] Best Latin America Stocks Daily:
Repare [15.09%], BRF S.A[10.71%], Li-Cycle [6.37%], Kinross Gold[4.87%], Telecom Argentina[4.55%], IRSA Inversiones[4.49%], Vision Marine[3.53%], Afya [3.13%], TransAlta [2.95%], Mercer [2.76%], Bioceres Crop[2.63%]