
 Login Sign Up


| |||||
 |  | ||||

| 12Stocks.com Market Intelligence |
Best Latin America Stocks
|
|
| Quick Read: Top Latin America Stocks By Performances & Trends: Daily, Weekly, Year-to-Date, Market Cap (Size) & Technical Trends | |||
| Best Latin America Views: Quick Browse View, Summary & Slide Show | |||
| 12Stocks.com Latin America Stocks Performances & Trends Daily | |||||||||
|
|  The overall market intelligence score is 18 (0-bearish to 100-bullish) which puts Latin America index in short term bearish trend. The market intelligence score from previous trading session is 32 and hence a deterioration of trend.
| ||||||||
| Here are the market intelligence trend scores of the most requested Latin America stocks at 12Stocks.com (click stock name for detailed review): | |
| Scroll down this page for most comprehensive review of Latin America stocks by performance, trends, technical analysis, charts, fund plays & more | |


| 12Stocks.com: Top Performing Latin America Index Stocks | ||||||||||||||||||||||||||||||||||||||||||||||||
 The top performing Latin America Index stocks year to date are
Now, more recently, over last week, the top performing Latin America Index stocks on the move are


|
||||||||||||||||||||||||||||||||||||||||||||||||
| 12Stocks.com: Investing in Latin America Index with Stocks | |
|
The following table helps investors and traders sort through current performance and trends (as measured by market intelligence score) of various
stocks in the Latin America Index. Quick View: Move mouse or cursor over stock symbol (ticker) to view short-term technical chart and over stock name to view long term chart. Click on  to add stock symbol to your watchlist and to add stock symbol to your watchlist and  to view watchlist. Click on any ticker or stock name for detailed market intelligence report for that stock. to view watchlist. Click on any ticker or stock name for detailed market intelligence report for that stock. |
12Stocks.com Performance of Stocks in Latin America Index
| Ticker | Stock Name | Watchlist | Category | Recent Price | Market Intelligence Score | Change % | YTD Change% |
| BRFS | BRF S.A |   | Consumer Staples | 3.36 | 88 | -0.88 | 20.86% |
| AQN | Algonquin Power | | Utilities | 6.13 | 78 | -0.89 | -2.93% |
| PAM | Pampa Energia | | Utilities | 43.16 | 7 | -0.93 | -12.83% |
| TIXT | TELUS | | Technology | 8.15 | 42 | -0.97 | -4.68% |
| SLF | Sun Life | | Financials | 51.17 | 45 | -1.02 | -1.32% |
| ASAI | Sendas Distribuidora | | Consumer Staples | 12.96 | 17 | -1.03 | -6.09% |
| RC | Ready Capital | | Financials | 8.72 | 35 | -1.08 | -14.88% |
| ABEV | Ambev S.A | | Consumer Staples | 2.29 | 27 | -1.08 | -18.04% |
| GGB | Gerdau S.A | | Materials | 3.52 | 10 | -1.12 | -27.42% |
| ELP | Companhia Paranaense | | Utilities | 6.99 | 7 | -1.13 | -17.57% |
| ARCO | Arcos Dorados | | Services & Goods | 10.80 | 32 | -1.24 | -14.93% |
| MEOH | Methanex | | Materials | 47.11 | 61 | -1.26 | -0.53% |
| MGA | Magna | | Services & Goods | 48.58 | 25 | -1.28 | -17.77% |
| VSTA | Vasta Platform | | Consumer Staples | 3.75 | 35 | -1.32 | -14.77% |
| LULU | Lululemon Athletica | | Consumer Staples | 359.73 | 57 | -1.33 | -29.64% |
| GIB | CGI | | Technology | 103.51 | 32 | -1.33 | -3.45% |
| CLS | Celestica | | Technology | 43.51 | 56 | -1.34 | 48.60% |
| BNS | Bank of Nova Scotia | | Financials | 46.16 | 41 | -1.37 | -5.20% |
| ONCY | Oncolytics Biotech | | Health Care | 1.04 | 30 | -1.42 | -22.96% |
| FSV | FirstService | | Financials | 152.48 | 27 | -1.49 | -5.93% |
| DOOO | BRP | | Consumer Staples | 68.22 | 59 | -1.52 | -4.85% |
| ITUB | Itau Unibanco | | Financials | 6.12 | 35 | -1.53 | -12.01% |
| STNE | StoneCo | | Technology | 15.59 | 20 | -1.55 | -13.56% |
| BB | BlackBerry | | Technology | 2.83 | 71 | -1.57 | -20.20% |
| IMAX | IMAX | | Services & Goods | 17.38 | 63 | -1.59 | 15.71% |
| To view more stocks, click on Next / Previous arrows or select different range: 0 - 25 , 25 - 50 , 50 - 75 , 75 - 100 , 100 - 125 , 125 - 150 , 150 - 175 , 175 - 200 , 200 - 225 | ||
 | Click To Change The Sort Order: By Market Cap or Company Size Performance: Year-to-date, Week and Day |  |
| Detailed Overview Of Latin America Stocks |
| Latin America Technical Overview, Leaders & Laggards, Top Latin America ETF Funds & Detailed Latin America Stocks List, Charts, Trends & More |
| Latin America: Technical Analysis, Trends & YTD Performance | |
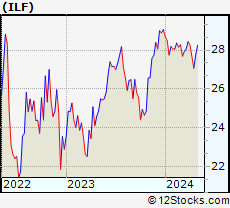
 ILF Weekly Chart |
|
| Long Term Trend: Not Good | |
| Medium Term Trend: Not Good | |
 ILF Daily Chart |
|
| Short Term Trend: Deteriorating | |
| Overall Trend Score: 18 | |
| YTD Performance: -6.19% | |
| **Trend Scores & Views Are Only For Educational Purposes And Not For Investing | |
| 12Stocks.com: Investing in Latin America Index using Exchange Traded Funds | |
|
The following table shows list of key exchange traded funds (ETF) that
help investors play Latin America stock market. For detailed view, check out our ETF Funds section of our website. Quick View: Move mouse or cursor over ETF symbol (ticker) to view short-term technical chart and over ETF name to view long term chart. Click on ticker or stock name for detailed view. Click on to add stock symbol to your watchlist and to view watchlist. |
12Stocks.com List of ETFs that track Latin America Index
| Ticker | ETF Name | Watchlist | Recent Price | Market Intelligence Score | Change % | Week % | Year-to-date % |
| ILF | Latin America 40 | | 27.26 | 18 | -0.18 | 0.7 | -6.19% |
| EWC | Canada | | 37.46 | 61 | 0.27 | 0.94 | 2.13% |
| FLN | Latin America AlphaDEX | | 19.29 | 31 | -0.92 | 0.36 | -7.22% |
| EWZ | Brazil | | 30.81 | 35 | -0.60 | 0.21 | -11.89% |
| EWW | Mexico | | 65.92 | 18 | 0.22 | 1.58 | -2.85% |
| ARGT | Argentina | | 54.54 | 71 | 0.04 | 2 | 6.23% |
| EWZS | Brazil Small-Cap | | 13.07 | 32 | -0.76 | 0.54 | -13.21% |
| BRF | Brazil Small-Cap | | 14.88 | 25 | -0.93 | 0.13 | -15.4% |
| BZQ | Short Brazil | | 12.70 | 63 | 1.40 | -0.25 | 26.62% |
| BRZU | Brazil Bull 3X | | 77.10 | 27 | -1.37 | 0.39 | -25.06% |
| FBZ | Brazil AlphaDEX | | 11.15 | 10 | -0.89 | -0.8 | -8.77% |
| 12Stocks.com: Charts, Trends, Fundamental Data and Performances of Latin America Stocks | |
|
We now take in-depth look at all Latin America stocks including charts, multi-period performances and overall trends (as measured by market intelligence score). One can sort Latin America stocks (click link to choose) by Daily, Weekly and by Year-to-Date performances. Also, one can sort by size of the company or by market capitalization. |
| Select Your Default Chart Type: | |||||
| |||||
| Click on stock symbol or name for detailed view. Click on to add stock symbol to your watchlist and to view watchlist. Quick View: Move mouse or cursor over "Daily" to quickly view daily technical stock chart and over "Weekly" to view weekly technical stock chart. | |||||

 | BRFS BRF S.A. |
| Sector: Consumer Staples | |
| SubSector: Meat Products | |
| MarketCap: 2635.51 Millions | |
| Recent Price: 3.36 Market Intelligence Score: 88 | |
| Day Percent Change: -0.88% Day Change: -0.03 | |
| Week Change: 2.44% Year-to-date Change: 20.9% | |
| BRFS Links: Profile News Message Board | |
| Charts:- Daily , Weekly | |
| Add BRFS to Watchlist: View: Get Complete BRFS Trend Analysis ➞ | |
 | AQN Algonquin Power & Utilities Corp. |
| Sector: Utilities | |
| SubSector: Diversified Utilities | |
| MarketCap: 5916.4 Millions | |
| Recent Price: 6.13 Market Intelligence Score: 78 | |
| Day Percent Change: -0.89% Day Change: -0.06 | |
| Week Change: 3.46% Year-to-date Change: -2.9% | |
| AQN Links: Profile News Message Board | |
| Charts:- Daily , Weekly | |
| Add AQN to Watchlist: View: Get Complete AQN Trend Analysis ➞ | |
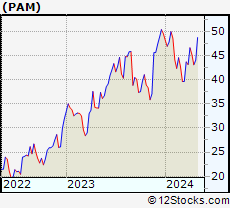 | PAM Pampa Energia S.A. |
| Sector: Utilities | |
| SubSector: Electric Utilities | |
| MarketCap: 1004.14 Millions | |
| Recent Price: 43.16 Market Intelligence Score: 7 | |
| Day Percent Change: -0.93% Day Change: -0.41 | |
| Week Change: 0.2% Year-to-date Change: -12.8% | |
| PAM Links: Profile News Message Board | |
| Charts:- Daily , Weekly | |
| Add PAM to Watchlist: View: Get Complete PAM Trend Analysis ➞ | |
 | TIXT TELUS International (Cda) Inc. |
| Sector: Technology | |
| SubSector: Software - Infrastructure | |
| MarketCap: 1470 Millions | |
| Recent Price: 8.15 Market Intelligence Score: 42 | |
| Day Percent Change: -0.97% Day Change: -0.08 | |
| Week Change: 4.35% Year-to-date Change: -4.7% | |
| TIXT Links: Profile News Message Board | |
| Charts:- Daily , Weekly | |
| Add TIXT to Watchlist: View: Get Complete TIXT Trend Analysis ➞ | |
 | SLF Sun Life Financial Inc. |
| Sector: Financials | |
| SubSector: Property & Casualty Insurance | |
| MarketCap: 17722 Millions | |
| Recent Price: 51.17 Market Intelligence Score: 45 | |
| Day Percent Change: -1.02% Day Change: -0.53 | |
| Week Change: 0.13% Year-to-date Change: -1.3% | |
| SLF Links: Profile News Message Board | |
| Charts:- Daily , Weekly | |
| Add SLF to Watchlist: View: Get Complete SLF Trend Analysis ➞ | |
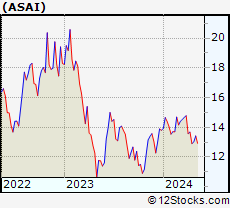 | ASAI Sendas Distribuidora S.A. |
| Sector: Consumer Staples | |
| SubSector: Grocery Stores | |
| MarketCap: 3790 Millions | |
| Recent Price: 12.96 Market Intelligence Score: 17 | |
| Day Percent Change: -1.03% Day Change: -0.13 | |
| Week Change: 0.43% Year-to-date Change: -6.1% | |
| ASAI Links: Profile News Message Board | |
| Charts:- Daily , Weekly | |
| Add ASAI to Watchlist: View: Get Complete ASAI Trend Analysis ➞ | |
 | RC Ready Capital Corporation |
| Sector: Financials | |
| SubSector: Mortgage Investment | |
| MarketCap: 358.039 Millions | |
| Recent Price: 8.72 Market Intelligence Score: 35 | |
| Day Percent Change: -1.08% Day Change: -0.10 | |
| Week Change: 1.22% Year-to-date Change: -14.9% | |
| RC Links: Profile News Message Board | |
| Charts:- Daily , Weekly | |
| Add RC to Watchlist: View: Get Complete RC Trend Analysis ➞ | |
 | ABEV Ambev S.A. |
| Sector: Consumer Staples | |
| SubSector: Beverages - Brewers | |
| MarketCap: 37753.5 Millions | |
| Recent Price: 2.29 Market Intelligence Score: 27 | |
| Day Percent Change: -1.08% Day Change: -0.02 | |
| Week Change: 0.22% Year-to-date Change: -18.0% | |
| ABEV Links: Profile News Message Board | |
| Charts:- Daily , Weekly | |
| Add ABEV to Watchlist: View: Get Complete ABEV Trend Analysis ➞ | |
 | GGB Gerdau S.A. |
| Sector: Materials | |
| SubSector: Steel & Iron | |
| MarketCap: 3607.48 Millions | |
| Recent Price: 3.52 Market Intelligence Score: 10 | |
| Day Percent Change: -1.12% Day Change: -0.04 | |
| Week Change: -3.83% Year-to-date Change: -27.4% | |
| GGB Links: Profile News Message Board | |
| Charts:- Daily , Weekly | |
| Add GGB to Watchlist: View: Get Complete GGB Trend Analysis ➞ | |
 | ELP Companhia Paranaense de Energia - COPEL |
| Sector: Utilities | |
| SubSector: Electric Utilities | |
| MarketCap: 3352.84 Millions | |
| Recent Price: 6.99 Market Intelligence Score: 7 | |
| Day Percent Change: -1.13% Day Change: -0.08 | |
| Week Change: -4.38% Year-to-date Change: -17.6% | |
| ELP Links: Profile News Message Board | |
| Charts:- Daily , Weekly | |
| Add ELP to Watchlist: View: Get Complete ELP Trend Analysis ➞ | |
 | ARCO Arcos Dorados Holdings Inc. |
| Sector: Services & Goods | |
| SubSector: Restaurants | |
| MarketCap: 778.87 Millions | |
| Recent Price: 10.80 Market Intelligence Score: 32 | |
| Day Percent Change: -1.24% Day Change: -0.13 | |
| Week Change: -0.96% Year-to-date Change: -14.9% | |
| ARCO Links: Profile News Message Board | |
| Charts:- Daily , Weekly | |
| Add ARCO to Watchlist: View: Get Complete ARCO Trend Analysis ➞ | |
 | MEOH Methanex Corporation |
| Sector: Materials | |
| SubSector: Specialty Chemicals | |
| MarketCap: 894.357 Millions | |
| Recent Price: 47.11 Market Intelligence Score: 61 | |
| Day Percent Change: -1.26% Day Change: -0.60 | |
| Week Change: -1.67% Year-to-date Change: -0.5% | |
| MEOH Links: Profile News Message Board | |
| Charts:- Daily , Weekly | |
| Add MEOH to Watchlist: View: Get Complete MEOH Trend Analysis ➞ | |
 | MGA Magna International Inc. |
| Sector: Services & Goods | |
| SubSector: Auto Parts Wholesale | |
| MarketCap: 8967.3 Millions | |
| Recent Price: 48.58 Market Intelligence Score: 25 | |
| Day Percent Change: -1.28% Day Change: -0.63 | |
| Week Change: 0.5% Year-to-date Change: -17.8% | |
| MGA Links: Profile News Message Board | |
| Charts:- Daily , Weekly | |
| Add MGA to Watchlist: View: Get Complete MGA Trend Analysis ➞ | |
 | VSTA Vasta Platform Limited |
| Sector: Consumer Staples | |
| SubSector: Education & Training Services | |
| MarketCap: 12747 Millions | |
| Recent Price: 3.75 Market Intelligence Score: 35 | |
| Day Percent Change: -1.32% Day Change: -0.05 | |
| Week Change: 0% Year-to-date Change: -14.8% | |
| VSTA Links: Profile News Message Board | |
| Charts:- Daily , Weekly | |
| Add VSTA to Watchlist: View: Get Complete VSTA Trend Analysis ➞ | |
 | LULU Lululemon Athletica Inc. |
| Sector: Consumer Staples | |
| SubSector: Textile - Apparel Clothing | |
| MarketCap: 24627.8 Millions | |
| Recent Price: 359.73 Market Intelligence Score: 57 | |
| Day Percent Change: -1.33% Day Change: -4.86 | |
| Week Change: 2.06% Year-to-date Change: -29.6% | |
| LULU Links: Profile News Message Board | |
| Charts:- Daily , Weekly | |
| Add LULU to Watchlist: View: Get Complete LULU Trend Analysis ➞ | |
 | GIB CGI Inc. |
| Sector: Technology | |
| SubSector: Information Technology Services | |
| MarketCap: 13185.3 Millions | |
| Recent Price: 103.51 Market Intelligence Score: 32 | |
| Day Percent Change: -1.33% Day Change: -1.39 | |
| Week Change: -0.48% Year-to-date Change: -3.5% | |
| GIB Links: Profile News Message Board | |
| Charts:- Daily , Weekly | |
| Add GIB to Watchlist: View: Get Complete GIB Trend Analysis ➞ | |
 | CLS Celestica Inc. |
| Sector: Technology | |
| SubSector: Printed Circuit Boards | |
| MarketCap: 474.235 Millions | |
| Recent Price: 43.51 Market Intelligence Score: 56 | |
| Day Percent Change: -1.34% Day Change: -0.59 | |
| Week Change: 6.83% Year-to-date Change: 48.6% | |
| CLS Links: Profile News Message Board | |
| Charts:- Daily , Weekly | |
| Add CLS to Watchlist: View: Get Complete CLS Trend Analysis ➞ | |
 | BNS The Bank of Nova Scotia |
| Sector: Financials | |
| SubSector: Money Center Banks | |
| MarketCap: 48742.1 Millions | |
| Recent Price: 46.16 Market Intelligence Score: 41 | |
| Day Percent Change: -1.37% Day Change: -0.64 | |
| Week Change: -1.24% Year-to-date Change: -5.2% | |
| BNS Links: Profile News Message Board | |
| Charts:- Daily , Weekly | |
| Add BNS to Watchlist: View: Get Complete BNS Trend Analysis ➞ | |
 | ONCY Oncolytics Biotech Inc. |
| Sector: Health Care | |
| SubSector: Biotechnology | |
| MarketCap: 57.3785 Millions | |
| Recent Price: 1.04 Market Intelligence Score: 30 | |
| Day Percent Change: -1.42% Day Change: -0.01 | |
| Week Change: -0.95% Year-to-date Change: -23.0% | |
| ONCY Links: Profile News Message Board | |
| Charts:- Daily , Weekly | |
| Add ONCY to Watchlist: View: Get Complete ONCY Trend Analysis ➞ | |
 | FSV FirstService Corporation |
| Sector: Financials | |
| SubSector: Property Management | |
| MarketCap: 2793.92 Millions | |
| Recent Price: 152.48 Market Intelligence Score: 27 | |
| Day Percent Change: -1.49% Day Change: -2.31 | |
| Week Change: 2.05% Year-to-date Change: -5.9% | |
| FSV Links: Profile News Message Board | |
| Charts:- Daily , Weekly | |
| Add FSV to Watchlist: View: Get Complete FSV Trend Analysis ➞ | |
 | DOOO BRP Inc. |
| Sector: Consumer Staples | |
| SubSector: Recreational Vehicles | |
| MarketCap: 638.559 Millions | |
| Recent Price: 68.22 Market Intelligence Score: 59 | |
| Day Percent Change: -1.52% Day Change: -1.05 | |
| Week Change: -1.76% Year-to-date Change: -4.9% | |
| DOOO Links: Profile News Message Board | |
| Charts:- Daily , Weekly | |
| Add DOOO to Watchlist: View: Get Complete DOOO Trend Analysis ➞ | |
 | ITUB Itau Unibanco Holding S.A. |
| Sector: Financials | |
| SubSector: Foreign Regional Banks | |
| MarketCap: 48121 Millions | |
| Recent Price: 6.12 Market Intelligence Score: 35 | |
| Day Percent Change: -1.53% Day Change: -0.09 | |
| Week Change: 1.07% Year-to-date Change: -12.0% | |
| ITUB Links: Profile News Message Board | |
| Charts:- Daily , Weekly | |
| Add ITUB to Watchlist: View: Get Complete ITUB Trend Analysis ➞ | |
 | STNE StoneCo Ltd. |
| Sector: Technology | |
| SubSector: Application Software | |
| MarketCap: 7347.82 Millions | |
| Recent Price: 15.59 Market Intelligence Score: 20 | |
| Day Percent Change: -1.55% Day Change: -0.24 | |
| Week Change: 1.86% Year-to-date Change: -13.6% | |
| STNE Links: Profile News Message Board | |
| Charts:- Daily , Weekly | |
| Add STNE to Watchlist: View: Get Complete STNE Trend Analysis ➞ | |
 | BB BlackBerry Limited |
| Sector: Technology | |
| SubSector: Communication Equipment | |
| MarketCap: 2100.39 Millions | |
| Recent Price: 2.83 Market Intelligence Score: 71 | |
| Day Percent Change: -1.57% Day Change: -0.04 | |
| Week Change: 2.73% Year-to-date Change: -20.2% | |
| BB Links: Profile News Message Board | |
| Charts:- Daily , Weekly | |
| Add BB to Watchlist: View: Get Complete BB Trend Analysis ➞ | |
 | IMAX IMAX Corporation |
| Sector: Services & Goods | |
| SubSector: Entertainment - Diversified | |
| MarketCap: 874.237 Millions | |
| Recent Price: 17.38 Market Intelligence Score: 63 | |
| Day Percent Change: -1.59% Day Change: -0.28 | |
| Week Change: 1.46% Year-to-date Change: 15.7% | |
| IMAX Links: Profile News Message Board | |
| Charts:- Daily , Weekly | |
| Add IMAX to Watchlist: View: Get Complete IMAX Trend Analysis ➞ | |
| To view more stocks, click on Next / Previous arrows or select different range: 0 - 25 , 25 - 50 , 50 - 75 , 75 - 100 , 100 - 125 , 125 - 150 , 150 - 175 , 175 - 200 , 200 - 225 | ||
| Click To Change The Sort Order: By Market Cap or Company Size Performance: Year-to-date, Week and Day | |
| Select Chart Type: | ||
 Best Stocks Today 12Stocks.com |
© 2024 12Stocks.com Terms & Conditions Privacy Contact Us
All Information Provided Only For Education And Not To Be Used For Investing or Trading. See Terms & Conditions


One More Thing ... Get Best Stocks Delivered Daily!
Never Ever Miss A Move With Our Top Ten Stocks Lists
Find Best Stocks In Any Market - Bull or Bear Market
Take A Peek At Our Top Ten Stocks Lists: Daily, Weekly, Year-to-Date & Top Trends
Find Best Stocks In Any Market - Bull or Bear Market
Take A Peek At Our Top Ten Stocks Lists: Daily, Weekly, Year-to-Date & Top Trends
Latin America Stocks With Best Up Trends [0-bearish to 100-bullish]: SilverCrest Metals[100], Grupo Aeroportuario[100], Descartes Systems[100], Mercer [100], Hudbay Minerals[95], Triple Flag[95], Grupo Aeroportuario[93], SunOpta [93], Despegar.com [90], Controladora Vuela[88], BRF S.A[88]
Best Latin America Stocks Year-to-Date:
Aurora Cannabis[1348.97%], Fusion [123.13%], Canopy Growth[72.41%], Banco Macro[71.88%], Grupo Financiero[71.33%], D-Wave Quantum[68.68%], Banco BBVA[67%], McEwen Mining[64.15%], Celestica [48.6%], OrganiGram [47.33%], Hudbay Minerals[47.01%] Best Latin America Stocks This Week:
Grupo Aeroportuario[14.76%], Grupo Aeroportuario[12.19%], Controladora Vuela[11.28%], Canopy Growth[10.96%], Central Puerto[10.62%], SunOpta [9.98%], Despegar.com [8.84%], Grupo Aeroportuario[7.87%], Afya [7.53%], Trilogy Metals[7.22%], Mercer [7.02%] Best Latin America Stocks Daily:
Teck Resources[9.08%], McEwen Mining[8.38%], Ambipar Emergency[5.31%], Hudbay Minerals[4.84%], New Gold[4.36%], Trilogy Metals[4.21%], Afya [3.52%], Eldorado Gold[3.24%], Coca-Cola FEMSA[2.94%], Seabridge Gold[2.84%], Fortuna Silver[2.80%]