
 Login Sign Up


| |||||
 |  | ||||

| 12Stocks.com Market Intelligence |
Best Latin America Stocks
|
|
| Quick Read: Top Latin America Stocks By Performances & Trends: Daily, Weekly, Year-to-Date, Market Cap (Size) & Technical Trends | |||
| Best Latin America Views: Quick Browse View, Summary & Slide Show | |||
| 12Stocks.com Latin America Stocks Performances & Trends Daily | |||||||||
|
|  The overall market intelligence score is 32 (0-bearish to 100-bullish) which puts Latin America index in short term bearish to neutral trend. The market intelligence score from previous trading session is 0 and hence an improvement of trend.
| ||||||||
| Here are the market intelligence trend scores of the most requested Latin America stocks at 12Stocks.com (click stock name for detailed review): | |
| Scroll down this page for most comprehensive review of Latin America stocks by performance, trends, technical analysis, charts, fund plays & more | |


| 12Stocks.com: Top Performing Latin America Index Stocks | ||||||||||||||||||||||||||||||||||||||||||||||||
 The top performing Latin America Index stocks year to date are
Now, more recently, over last week, the top performing Latin America Index stocks on the move are


|
||||||||||||||||||||||||||||||||||||||||||||||||
| 12Stocks.com: Investing in Latin America Index with Stocks | |
|
The following table helps investors and traders sort through current performance and trends (as measured by market intelligence score) of various
stocks in the Latin America Index. Quick View: Move mouse or cursor over stock symbol (ticker) to view short-term technical chart and over stock name to view long term chart. Click on  to add stock symbol to your watchlist and to add stock symbol to your watchlist and  to view watchlist. Click on any ticker or stock name for detailed market intelligence report for that stock. to view watchlist. Click on any ticker or stock name for detailed market intelligence report for that stock. |
12Stocks.com Performance of Stocks in Latin America Index
| Ticker | Stock Name | Watchlist | Category | Recent Price | Market Intelligence Score | Change % | YTD Change% |
| CEF | Sprott Physical |   | Financials | 22.38 | 83 | 0.67 | 16.87% |
| RCI | Rogers | | Technology | 38.54 | 42 | 0.63 | -17.67% |
| MFC | Manulife Financial | | Financials | 23.07 | 63 | 0.61 | 4.39% |
| MIST | Milestone | | Health Care | 1.64 | 36 | 0.61 | -1.80% |
| LVRO | Lavoro | | Materials | 5.88 | 42 | 0.60 | -33.78% |
| AEM | Agnico Eagle | | Materials | 63.84 | 93 | 0.58 | 16.39% |
| TLRY | Tilray | | Health Care | 1.73 | 15 | 0.58 | -24.78% |
| IAG | IAMGOLD | | Materials | 3.66 | 78 | 0.55 | 44.66% |
| OGI | OrganiGram | | Health Care | 1.88 | 43 | 0.53 | 43.51% |
| FMX | Fomento Economico | | Consumer Staples | 119.69 | 25 | 0.52 | -8.18% |
| ERF | Enerplus | | Energy | 19.93 | 51 | 0.50 | 29.92% |
| ABEV | Ambev S.A | | Consumer Staples | 2.29 | 32 | 0.44 | -18.21% |
| GFL | GFL Environmental | | Industrials | 33.15 | 10 | 0.39 | -3.94% |
| CNI | Canadian National | | Transports | 127.65 | 56 | 0.39 | 1.61% |
| BBD | Banco Bradesco | | Financials | 2.64 | 10 | 0.38 | -24.57% |
| CAE | CAE | | Industrials | 18.63 | 10 | 0.38 | -13.71% |
| BNS | Bank of Nova Scotia | | Financials | 46.74 | 37 | 0.37 | -4.00% |
| ASR | Grupo Aeroportuario | | Transports | 308.21 | 54 | 0.35 | 4.74% |
| PHYS | Sprott Physical | | Financials | 18.50 | 76 | 0.33 | 16.13% |
| ITUB | Itau Unibanco | | Financials | 6.05 | 25 | 0.33 | -12.95% |
| EDN | Empresa Distribuidora | | Utilities | 16.14 | 17 | 0.31 | -16.68% |
| TAC | TransAlta | | Utilities | 6.45 | 59 | 0.31 | -22.38% |
| BRFS | BRF S.A | | Consumer Staples | 3.28 | 45 | 0.31 | 17.99% |
| LEV | Lion Electric | | Industrials | 0.97 | 10 | 0.28 | -45.24% |
| BLCO | Bausch + | | Health Care | 14.64 | 58 | 0.27 | -13.88% |
| To view more stocks, click on Next / Previous arrows or select different range: 0 - 25 , 25 - 50 , 50 - 75 , 75 - 100 , 100 - 125 , 125 - 150 , 150 - 175 , 175 - 200 , 200 - 225 | ||
 | Click To Change The Sort Order: By Market Cap or Company Size Performance: Year-to-date, Week and Day |  |
| Detailed Overview Of Latin America Stocks |
| Latin America Technical Overview, Leaders & Laggards, Top Latin America ETF Funds & Detailed Latin America Stocks List, Charts, Trends & More |
| Latin America: Technical Analysis, Trends & YTD Performance | |
 ILF Weekly Chart |
|
| Long Term Trend: Not Good | |
| Medium Term Trend: Not Good | |
 ILF Daily Chart |
|
| Short Term Trend: Very Good | |
| Overall Trend Score: 32 | |
| YTD Performance: -6.85% | |
| **Trend Scores & Views Are Only For Educational Purposes And Not For Investing | |
| 12Stocks.com: Investing in Latin America Index using Exchange Traded Funds | |
|
The following table shows list of key exchange traded funds (ETF) that
help investors play Latin America stock market. For detailed view, check out our ETF Funds section of our website. Quick View: Move mouse or cursor over ETF symbol (ticker) to view short-term technical chart and over ETF name to view long term chart. Click on ticker or stock name for detailed view. Click on to add stock symbol to your watchlist and to view watchlist. |
12Stocks.com List of ETFs that track Latin America Index
| Ticker | ETF Name | Watchlist | Recent Price | Market Intelligence Score | Change % | Week % | Year-to-date % |
| ILF | Latin America 40 | | 27.07 | 32 | 1.20 | -2.1 | -6.85% |
| EWC | Canada | | 37.11 | 68 | 0.71 | -0.11 | 1.17% |
| FLN | Latin America AlphaDEX | | 19.22 | 18 | 0.68 | -5.78 | -7.55% |
| EWZ | Brazil | | 30.74 | 32 | 2.09 | -1.69 | -12.07% |
| EWW | Mexico | | 64.89 | 18 | -0.05 | -3.75 | -4.36% |
| ARGT | Argentina | | 53.47 | 58 | 1.06 | -3.88 | 4.15% |
| EWZS | Brazil Small-Cap | | 13.00 | 25 | 1.56 | -4.02 | -13.68% |
| BRF | Brazil Small-Cap | | 14.86 | 25 | 1.57 | -4.53 | -15.51% |
| BZQ | Short Brazil | | 12.73 | 68 | -3.98 | 3.43 | 26.94% |
| BRZU | Brazil Bull 3X | | 76.80 | 32 | 4.18 | -3.72 | -25.35% |
| FBZ | Brazil AlphaDEX | | 11.24 | 32 | 1.94 | -5.15 | -8.03% |
| 12Stocks.com: Charts, Trends, Fundamental Data and Performances of Latin America Stocks | |
|
We now take in-depth look at all Latin America stocks including charts, multi-period performances and overall trends (as measured by market intelligence score). One can sort Latin America stocks (click link to choose) by Daily, Weekly and by Year-to-Date performances. Also, one can sort by size of the company or by market capitalization. |
| Select Your Default Chart Type: | |||||
| |||||
| Click on stock symbol or name for detailed view. Click on to add stock symbol to your watchlist and to view watchlist. Quick View: Move mouse or cursor over "Daily" to quickly view daily technical stock chart and over "Weekly" to view weekly technical stock chart. | |||||

 | CEF Sprott Physical Gold and Silver Trust |
| Sector: Financials | |
| SubSector: Asset Management | |
| MarketCap: 2485.33 Millions | |
| Recent Price: 22.38 Market Intelligence Score: 83 | |
| Day Percent Change: 0.67% Day Change: 0.15 | |
| Week Change: 1.73% Year-to-date Change: 16.9% | |
| CEF Links: Profile News Message Board | |
| Charts:- Daily , Weekly | |
| Add CEF to Watchlist: View: Get Complete CEF Trend Analysis ➞ | |
 | RCI Rogers Communications Inc. |
| Sector: Technology | |
| SubSector: Wireless Communications | |
| MarketCap: 22111.6 Millions | |
| Recent Price: 38.54 Market Intelligence Score: 42 | |
| Day Percent Change: 0.63% Day Change: 0.24 | |
| Week Change: -1.61% Year-to-date Change: -17.7% | |
| RCI Links: Profile News Message Board | |
| Charts:- Daily , Weekly | |
| Add RCI to Watchlist: View: Get Complete RCI Trend Analysis ➞ | |
 | MFC Manulife Financial Corporation |
| Sector: Financials | |
| SubSector: Life Insurance | |
| MarketCap: 22188.7 Millions | |
| Recent Price: 23.07 Market Intelligence Score: 63 | |
| Day Percent Change: 0.61% Day Change: 0.14 | |
| Week Change: -2.7% Year-to-date Change: 4.4% | |
| MFC Links: Profile News Message Board | |
| Charts:- Daily , Weekly | |
| Add MFC to Watchlist: View: Get Complete MFC Trend Analysis ➞ | |
 | MIST Milestone Pharmaceuticals Inc. |
| Sector: Health Care | |
| SubSector: Biotechnology | |
| MarketCap: 342.685 Millions | |
| Recent Price: 1.64 Market Intelligence Score: 36 | |
| Day Percent Change: 0.61% Day Change: 0.01 | |
| Week Change: -5.2% Year-to-date Change: -1.8% | |
| MIST Links: Profile News Message Board | |
| Charts:- Daily , Weekly | |
| Add MIST to Watchlist: View: Get Complete MIST Trend Analysis ➞ | |
 | LVRO Lavoro Limited |
| Sector: Materials | |
| SubSector: Agricultural Inputs | |
| MarketCap: 686 Millions | |
| Recent Price: 5.88 Market Intelligence Score: 42 | |
| Day Percent Change: 0.60% Day Change: 0.04 | |
| Week Change: -3.45% Year-to-date Change: -33.8% | |
| LVRO Links: Profile News Message Board | |
| Charts:- Daily , Weekly | |
| Add LVRO to Watchlist: View: Get Complete LVRO Trend Analysis ➞ | |
 | AEM Agnico Eagle Mines Limited |
| Sector: Materials | |
| SubSector: Gold | |
| MarketCap: 9491.49 Millions | |
| Recent Price: 63.84 Market Intelligence Score: 93 | |
| Day Percent Change: 0.58% Day Change: 0.37 | |
| Week Change: 3.89% Year-to-date Change: 16.4% | |
| AEM Links: Profile News Message Board | |
| Charts:- Daily , Weekly | |
| Add AEM to Watchlist: View: Get Complete AEM Trend Analysis ➞ | |
 | TLRY Tilray, Inc. |
| Sector: Health Care | |
| SubSector: Drug Manufacturers - Other | |
| MarketCap: 452.533 Millions | |
| Recent Price: 1.73 Market Intelligence Score: 15 | |
| Day Percent Change: 0.58% Day Change: 0.01 | |
| Week Change: -4.95% Year-to-date Change: -24.8% | |
| TLRY Links: Profile News Message Board | |
| Charts:- Daily , Weekly | |
| Add TLRY to Watchlist: View: Get Complete TLRY Trend Analysis ➞ | |
 | IAG IAMGOLD Corporation |
| Sector: Materials | |
| SubSector: Gold | |
| MarketCap: 1158.09 Millions | |
| Recent Price: 3.66 Market Intelligence Score: 78 | |
| Day Percent Change: 0.55% Day Change: 0.02 | |
| Week Change: -2.66% Year-to-date Change: 44.7% | |
| IAG Links: Profile News Message Board | |
| Charts:- Daily , Weekly | |
| Add IAG to Watchlist: View: Get Complete IAG Trend Analysis ➞ | |
 | OGI OrganiGram Holdings Inc. |
| Sector: Health Care | |
| SubSector: Drugs - Generic | |
| MarketCap: 256.885 Millions | |
| Recent Price: 1.88 Market Intelligence Score: 43 | |
| Day Percent Change: 0.53% Day Change: 0.01 | |
| Week Change: -3.09% Year-to-date Change: 43.5% | |
| OGI Links: Profile News Message Board | |
| Charts:- Daily , Weekly | |
| Add OGI to Watchlist: View: Get Complete OGI Trend Analysis ➞ | |
 | FMX Fomento Economico Mexicano, S.A.B. de C.V. |
| Sector: Consumer Staples | |
| SubSector: Beverages - Brewers | |
| MarketCap: 22018.7 Millions | |
| Recent Price: 119.69 Market Intelligence Score: 25 | |
| Day Percent Change: 0.52% Day Change: 0.62 | |
| Week Change: -3.66% Year-to-date Change: -8.2% | |
| FMX Links: Profile News Message Board | |
| Charts:- Daily , Weekly | |
| Add FMX to Watchlist: View: Get Complete FMX Trend Analysis ➞ | |
 | ERF Enerplus Corporation |
| Sector: Energy | |
| SubSector: Oil & Gas Drilling & Exploration | |
| MarketCap: 372.639 Millions | |
| Recent Price: 19.93 Market Intelligence Score: 51 | |
| Day Percent Change: 0.50% Day Change: 0.10 | |
| Week Change: -3.58% Year-to-date Change: 29.9% | |
| ERF Links: Profile News Message Board | |
| Charts:- Daily , Weekly | |
| Add ERF to Watchlist: View: Get Complete ERF Trend Analysis ➞ | |
 | ABEV Ambev S.A. |
| Sector: Consumer Staples | |
| SubSector: Beverages - Brewers | |
| MarketCap: 37753.5 Millions | |
| Recent Price: 2.29 Market Intelligence Score: 32 | |
| Day Percent Change: 0.44% Day Change: 0.01 | |
| Week Change: -2.55% Year-to-date Change: -18.2% | |
| ABEV Links: Profile News Message Board | |
| Charts:- Daily , Weekly | |
| Add ABEV to Watchlist: View: Get Complete ABEV Trend Analysis ➞ | |
 | GFL GFL Environmental Inc. |
| Sector: Industrials | |
| SubSector: Waste Management | |
| MarketCap: 87627 Millions | |
| Recent Price: 33.15 Market Intelligence Score: 10 | |
| Day Percent Change: 0.39% Day Change: 0.13 | |
| Week Change: -0.75% Year-to-date Change: -3.9% | |
| GFL Links: Profile News Message Board | |
| Charts:- Daily , Weekly | |
| Add GFL to Watchlist: View: Get Complete GFL Trend Analysis ➞ | |
 | CNI Canadian National Railway Company |
| Sector: Transports | |
| SubSector: Railroads | |
| MarketCap: 54114.1 Millions | |
| Recent Price: 127.65 Market Intelligence Score: 56 | |
| Day Percent Change: 0.39% Day Change: 0.49 | |
| Week Change: -0.62% Year-to-date Change: 1.6% | |
| CNI Links: Profile News Message Board | |
| Charts:- Daily , Weekly | |
| Add CNI to Watchlist: View: Get Complete CNI Trend Analysis ➞ | |
 | BBD Banco Bradesco S.A. |
| Sector: Financials | |
| SubSector: Foreign Regional Banks | |
| MarketCap: 30281.7 Millions | |
| Recent Price: 2.64 Market Intelligence Score: 10 | |
| Day Percent Change: 0.38% Day Change: 0.01 | |
| Week Change: -4.69% Year-to-date Change: -24.6% | |
| BBD Links: Profile News Message Board | |
| Charts:- Daily , Weekly | |
| Add BBD to Watchlist: View: Get Complete BBD Trend Analysis ➞ | |
 | CAE CAE Inc. |
| Sector: Industrials | |
| SubSector: Aerospace/Defense Products & Services | |
| MarketCap: 3739.61 Millions | |
| Recent Price: 18.63 Market Intelligence Score: 10 | |
| Day Percent Change: 0.38% Day Change: 0.07 | |
| Week Change: -4.12% Year-to-date Change: -13.7% | |
| CAE Links: Profile News Message Board | |
| Charts:- Daily , Weekly | |
| Add CAE to Watchlist: View: Get Complete CAE Trend Analysis ➞ | |
 | BNS The Bank of Nova Scotia |
| Sector: Financials | |
| SubSector: Money Center Banks | |
| MarketCap: 48742.1 Millions | |
| Recent Price: 46.74 Market Intelligence Score: 37 | |
| Day Percent Change: 0.37% Day Change: 0.17 | |
| Week Change: -3.01% Year-to-date Change: -4.0% | |
| BNS Links: Profile News Message Board | |
| Charts:- Daily , Weekly | |
| Add BNS to Watchlist: View: Get Complete BNS Trend Analysis ➞ | |
 | ASR Grupo Aeroportuario del Sureste, S. A. B. de C. V. |
| Sector: Transports | |
| SubSector: Air Services, Other | |
| MarketCap: 2739.98 Millions | |
| Recent Price: 308.21 Market Intelligence Score: 54 | |
| Day Percent Change: 0.35% Day Change: 1.07 | |
| Week Change: -2.78% Year-to-date Change: 4.7% | |
| ASR Links: Profile News Message Board | |
| Charts:- Daily , Weekly | |
| Add ASR to Watchlist: View: Get Complete ASR Trend Analysis ➞ | |
 | PHYS Sprott Physical Gold Trust |
| Sector: Financials | |
| SubSector: Exchange Traded Fund | |
| MarketCap: 2365.21 Millions | |
| Recent Price: 18.50 Market Intelligence Score: 76 | |
| Day Percent Change: 0.33% Day Change: 0.06 | |
| Week Change: 2.32% Year-to-date Change: 16.1% | |
| PHYS Links: Profile News Message Board | |
| Charts:- Daily , Weekly | |
| Add PHYS to Watchlist: View: Get Complete PHYS Trend Analysis ➞ | |
 | ITUB Itau Unibanco Holding S.A. |
| Sector: Financials | |
| SubSector: Foreign Regional Banks | |
| MarketCap: 48121 Millions | |
| Recent Price: 6.05 Market Intelligence Score: 25 | |
| Day Percent Change: 0.33% Day Change: 0.02 | |
| Week Change: -4.72% Year-to-date Change: -13.0% | |
| ITUB Links: Profile News Message Board | |
| Charts:- Daily , Weekly | |
| Add ITUB to Watchlist: View: Get Complete ITUB Trend Analysis ➞ | |
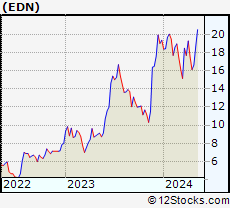 | EDN Empresa Distribuidora y Comercializadora Norte Sociedad Anonima |
| Sector: Utilities | |
| SubSector: Electric Utilities | |
| MarketCap: 105.914 Millions | |
| Recent Price: 16.14 Market Intelligence Score: 17 | |
| Day Percent Change: 0.31% Day Change: 0.05 | |
| Week Change: -7.82% Year-to-date Change: -16.7% | |
| EDN Links: Profile News Message Board | |
| Charts:- Daily , Weekly | |
| Add EDN to Watchlist: View: Get Complete EDN Trend Analysis ➞ | |
 | TAC TransAlta Corporation |
| Sector: Utilities | |
| SubSector: Diversified Utilities | |
| MarketCap: 1487.8 Millions | |
| Recent Price: 6.45 Market Intelligence Score: 59 | |
| Day Percent Change: 0.31% Day Change: 0.02 | |
| Week Change: 6.44% Year-to-date Change: -22.4% | |
| TAC Links: Profile News Message Board | |
| Charts:- Daily , Weekly | |
| Add TAC to Watchlist: View: Get Complete TAC Trend Analysis ➞ | |
 | BRFS BRF S.A. |
| Sector: Consumer Staples | |
| SubSector: Meat Products | |
| MarketCap: 2635.51 Millions | |
| Recent Price: 3.28 Market Intelligence Score: 45 | |
| Day Percent Change: 0.31% Day Change: 0.01 | |
| Week Change: 2.82% Year-to-date Change: 18.0% | |
| BRFS Links: Profile News Message Board | |
| Charts:- Daily , Weekly | |
| Add BRFS to Watchlist: View: Get Complete BRFS Trend Analysis ➞ | |
 | LEV The Lion Electric Company |
| Sector: Industrials | |
| SubSector: Farm & Heavy Construction Machinery | |
| MarketCap: 414 Millions | |
| Recent Price: 0.97 Market Intelligence Score: 10 | |
| Day Percent Change: 0.28% Day Change: 0.00 | |
| Week Change: -20.33% Year-to-date Change: -45.2% | |
| LEV Links: Profile News Message Board | |
| Charts:- Daily , Weekly | |
| Add LEV to Watchlist: View: Get Complete LEV Trend Analysis ➞ | |
 | BLCO Bausch + Lomb Corporation |
| Sector: Health Care | |
| SubSector: Medical Instruments & Supplies | |
| MarketCap: 7100 Millions | |
| Recent Price: 14.64 Market Intelligence Score: 58 | |
| Day Percent Change: 0.27% Day Change: 0.04 | |
| Week Change: 2.81% Year-to-date Change: -13.9% | |
| BLCO Links: Profile News Message Board | |
| Charts:- Daily , Weekly | |
| Add BLCO to Watchlist: View: Get Complete BLCO Trend Analysis ➞ | |
| To view more stocks, click on Next / Previous arrows or select different range: 0 - 25 , 25 - 50 , 50 - 75 , 75 - 100 , 100 - 125 , 125 - 150 , 150 - 175 , 175 - 200 , 200 - 225 | ||
| Click To Change The Sort Order: By Market Cap or Company Size Performance: Year-to-date, Week and Day | |
| Select Chart Type: | ||
 Best Stocks Today 12Stocks.com |
© 2024 12Stocks.com Terms & Conditions Privacy Contact Us
All Information Provided Only For Education And Not To Be Used For Investing or Trading. See Terms & Conditions


One More Thing ... Get Best Stocks Delivered Daily!
Never Ever Miss A Move With Our Top Ten Stocks Lists
Find Best Stocks In Any Market - Bull or Bear Market
Take A Peek At Our Top Ten Stocks Lists: Daily, Weekly, Year-to-Date & Top Trends
Find Best Stocks In Any Market - Bull or Bear Market
Take A Peek At Our Top Ten Stocks Lists: Daily, Weekly, Year-to-Date & Top Trends
Latin America Stocks With Best Up Trends [0-bearish to 100-bullish]: SilverCrest Metals[100], Alamos Gold[100], Kinross Gold[93], Methanex [93], Agnico Eagle[93], Pan American[90], Crescent Point[88], IRSA Inversiones[88], Sandstorm Gold[88], Suncor Energy[88], Cenovus Energy[88]
Best Latin America Stocks Year-to-Date:
Aurora Cannabis[1256.57%], Fusion [121.04%], D-Wave Quantum[81.22%], Banco Macro[73.59%], Grupo Financiero[64.84%], Banco BBVA[57.54%], McEwen Mining[55.62%], Canopy Growth[55.38%], IAMGOLD [44.66%], OrganiGram [43.51%], Hudbay Minerals[41.12%] Best Latin America Stocks This Week:
Controladora Vuela[10.64%], SilverCrest Metals[9.57%], TransAlta [6.44%], Canada Goose[5.84%], Lululemon Athletica[4.86%], Petroleo Brasileiro[4.77%], Kinross Gold[4.48%], IMAX [4.26%], BrasilAgro -[4.16%], Agnico Eagle[3.89%], Ready Capital[3.61%] Best Latin America Stocks Daily:
Vision Marine[7.40%], Banco BBVA[6.20%], Ambipar Emergency[6.09%], Trilogy Metals[5.79%], Petroleo Brasileiro[5.71%], Cresud Sociedad[4.44%], BrasilAgro -[4.38%], SilverCrest Metals[4.36%], Kinross Gold[3.99%], SSR Mining[3.99%], Grupo Supervielle[3.77%]