
 Login Sign Up


| |||||
 |  | ||||

| 12Stocks.com Market Intelligence |
Best Industrial Stocks
| In a hurry? Industrial Stocks Lists: Performance Trends Table, Stock Charts
Sort Industrial stocks: Daily, Weekly, Year-to-Date, Market Cap & Trends. Filter Industrial stocks list by size:All Industrial Large Mid-Range Small |
| 12Stocks.com Industrial Stocks Performances & Trends Daily | |||||||||
|
|  The overall Smart Investing & Trading Score is 73 (0-bearish to 100-bullish) which puts Industrial sector in short term neutral to bullish trend. The Smart Investing & Trading Score from previous trading session is 30 and hence an improvement of trend.
| ||||||||
Here are the Smart Investing & Trading Scores of the most requested Industrial stocks at 12Stocks.com (click stock name for detailed review):
|


| 12Stocks.com: Investing in Industrial sector with Stocks | |
|
The following table helps investors and traders sort through current performance and trends (as measured by Smart Investing & Trading Score) of various
stocks in the Industrial sector. Quick View: Move mouse or cursor over stock symbol (ticker) to view short-term Technical chart and over stock name to view long term chart. Click on  to add stock symbol to your watchlist and to add stock symbol to your watchlist and  to view watchlist. Click on any ticker or stock name for detailed market intelligence report for that stock. to view watchlist. Click on any ticker or stock name for detailed market intelligence report for that stock. |
12Stocks.com Performance of Stocks in Industrial Sector
| Ticker | Stock Name | Watchlist | Category | Recent Price | Smart Investing & Trading Score | Change % | YTD Change% |
| EOSE | Eos Energy |   | Electrical Equipment & Parts | 0.75 | 22 | 8.59 | -31.52% |
| SYM | Symbotic | | Specialty Industrial Machinery | 41.11 | 75 | 4.53 | -19.22% |
| DHI | D.R. Horton | | Residential | 148.48 | 62 | 2.08 | -2.30% |
| AME | AMETEK | | Machinery | 166.56 | 0 | 1.97 | 1.01% |
| CARR | Carrier Global | | Building Products & Equipment | 62.09 | 95 | 1.89 | 8.08% |
| LEN | Lennar | | Residential | 158.10 | 62 | 1.86 | 6.08% |
| TDG | TransDigm | | Aerospace/Defense | 1293.80 | 95 | 1.73 | 27.90% |
| AZEK | AZEK | | Building Products & Equipment | 46.52 | 39 | 1.73 | 21.62% |
| ETN | Eaton | | Machinery | 320.50 | 70 | 1.66 | 33.09% |
| ROK | Rockwell Automation | | Machinery | 274.05 | 32 | 1.48 | -11.73% |
| NVR | NVR | | Residential | 7586.55 | 45 | 1.44 | 8.37% |
| DE | Deere & | | Machinery | 400.96 | 83 | 1.26 | 0.27% |
| ROP | Roper Technologies | | Machinery | 517.21 | 32 | 1.25 | -5.13% |
| HON | Honeywell | | Machinery | 195.81 | 57 | 1.12 | -6.63% |
| PH | Parker-Hannifin | | Equipment | 536.18 | 20 | 1.04 | 16.38% |
| SWK | Stanley Black | | Machine Tools | 85.80 | 7 | 0.95 | -12.54% |
| GE | General Electric | | Machinery | 164.11 | 90 | 0.90 | 28.58% |
| XYL | Xylem | | Machinery | 137.21 | 100 | 0.90 | 19.98% |
| MAS | Masco | | Building Materials | 69.56 | 32 | 0.84 | 3.85% |
| DOV | Dover | | Machinery | 178.99 | 71 | 0.81 | 16.37% |
| ITW | Illinois Tool | | Machinery | 243.92 | 25 | 0.78 | -6.88% |
| HEI | HEICO | | Aerospace/Defense | 211.36 | 95 | 0.63 | 18.16% |
| DHR | Danaher | | Machinery | 248.38 | 62 | 0.62 | 7.37% |
| MEG | Montrose Environmental | | Waste Mgmt | 44.51 | 88 | 0.54 | 38.40% |
| BA | Boeing | | Aerospace/Defense | 179.79 | 64 | 0.53 | -31.03% |
| For chart view version of above stock list: Chart View ➞ 0 - 25 , 25 - 50 | ||
 | Click To Change The Sort Order: By Market Cap or Company Size Performance: Year-to-date, Week and Day |  |
|
Get the most comprehensive stock market coverage daily at 12Stocks.com ➞ Best Stocks Today ➞ Best Stocks Weekly ➞ Best Stocks Year-to-Date ➞ Best Stocks Trends ➞  Best Stocks Today 12Stocks.com Best Nasdaq Stocks ➞ Best S&P 500 Stocks ➞ Best Tech Stocks ➞ Best Biotech Stocks ➞ |
| Detailed Overview of Industrial Stocks |
| Industrial Technical Overview, Leaders & Laggards, Top Industrial ETF Funds & Detailed Industrial Stocks List, Charts, Trends & More |
| Industrial Sector: Technical Analysis, Trends & YTD Performance | |
| Industrial sector is composed of stocks
from industrial machinery, aerospace, defense, farm/construction
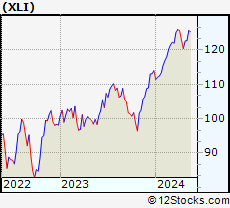
and industrial services subsectors. Industrial sector, as represented by XLI, an exchange-traded fund [ETF] that holds basket of Industrial stocks (e.g, Caterpillar, Boeing) is up by 7.7% and is currently outperforming the overall market by 0.82% year-to-date. Below is a quick view of Technical charts and trends: |
|
 XLI Weekly Chart |
|
| Long Term Trend: Good | |
| Medium Term Trend: Not Good | |
 XLI Daily Chart |
|
| Short Term Trend: Very Good | |
| Overall Trend Score: 73 | |
| YTD Performance: 7.7% | |
| **Trend Scores & Views Are Only For Educational Purposes And Not For Investing | |
| 12Stocks.com: Top Performing Industrial Sector Stocks | ||||||||||||||||||||||||||||||||||||||||||||||||
 The top performing Industrial sector stocks year to date are
Now, more recently, over last week, the top performing Industrial sector stocks on the move are


|
||||||||||||||||||||||||||||||||||||||||||||||||
| 12Stocks.com: Investing in Industrial Sector using Exchange Traded Funds | |
|
The following table shows list of key exchange traded funds (ETF) that
help investors track Industrial Index. For detailed view, check out our ETF Funds section of our website. Quick View: Move mouse or cursor over ETF symbol (ticker) to view short-term Technical chart and over ETF name to view long term chart. Click on ticker or stock name for detailed view. Click on to add stock symbol to your watchlist and to view watchlist. |
12Stocks.com List of ETFs that track Industrial Index
| Ticker | ETF Name | Watchlist | Recent Price | Smart Investing & Trading Score | Change % | Week % | Year-to-date % |
| XLI | Industrial | | 122.77 | 73 | 0.70 | 0.09 | 7.7% |
| UXI | Industrials | | 32.75 | 78 | 1.99 | 0.06 | 13.74% |
| PPA | Aerospace & Defense | | 102.93 | 95 | 0.62 | 2 | 11.69% |
| ITA | Aerospace & Defense | | 132.57 | 95 | 0.39 | 2.35 | 4.72% |
| ITB | Home Construction | | 107.37 | 60 | 1.71 | 1.63 | 5.54% |
| XHB | Homebuilders | | 105.22 | 80 | 1.63 | 1.45 | 9.99% |
| SIJ | Short Industrials | | 9.86 | 28 | -1.50 | 0.41 | -13.05% |
| IYJ | Industrials | | 121.18 | 53 | 0.64 | -0.31 | 5.96% |
| EXI | Global Industrials | | 137.33 | 85 | 0.94 | 0.91 | 7.77% |
| VIS | Industrials | | 237.47 | 66 | 0.71 | 0.41 | 7.73% |
| PSCI | SmallCap Industrials | | 120.90 | 53 | 1.00 | -0.38 | 4.26% |
| XAR | Aerospace & Defense | | 139.48 | 95 | 0.77 | 2.48 | 3% |
| ARKQ | ARK Industrial Innovation | | 54.11 | 82 | 0.50 | 1.41 | -6.22% |
| 12Stocks.com: Charts, Trends, Fundamental Data and Performances of Industrial Stocks | |
|
We now take in-depth look at all Industrial stocks including charts, multi-period performances and overall trends (as measured by Smart Investing & Trading Score). One can sort Industrial stocks (click link to choose) by Daily, Weekly and by Year-to-Date performances. Also, one can sort by size of the company or by market capitalization. |
| Select Your Default Chart Type: | |||||
| |||||
| Click on stock symbol or name for detailed view. Click on to add stock symbol to your watchlist and to view watchlist. Quick View: Move mouse or cursor over "Daily" to quickly view daily Technical stock chart and over "Weekly" to view weekly Technical stock chart. | |||||

 | EOSE Eos Energy Enterprises, Inc. |
| Sector: Industrials | |
| SubSector: Electrical Equipment & Parts | |
| MarketCap: 76627 Millions | |
| Recent Price: 0.75 Smart Investing & Trading Score: 22 | |
| Day Percent Change: 8.59% Day Change: 0.06 | |
| Week Change: -6.94% Year-to-date Change: -31.5% | |
| EOSE Links: Profile News Message Board | |
| Charts:- Daily , Weekly | |
| Add EOSE to Watchlist: View: Get Complete EOSE Trend Analysis ➞ | |
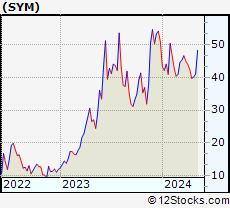 | SYM Symbotic Inc. |
| Sector: Industrials | |
| SubSector: Specialty Industrial Machinery | |
| MarketCap: 24000 Millions | |
| Recent Price: 41.11 Smart Investing & Trading Score: 75 | |
| Day Percent Change: 4.53% Day Change: 1.78 | |
| Week Change: 2.31% Year-to-date Change: -19.2% | |
| SYM Links: Profile News Message Board | |
| Charts:- Daily , Weekly | |
| Add SYM to Watchlist: View: Get Complete SYM Trend Analysis ➞ | |
 | DHI D.R. Horton, Inc. |
| Sector: Industrials | |
| SubSector: Residential Construction | |
| MarketCap: 13372.6 Millions | |
| Recent Price: 148.48 Smart Investing & Trading Score: 62 | |
| Day Percent Change: 2.08% Day Change: 3.02 | |
| Week Change: 2.17% Year-to-date Change: -2.3% | |
| DHI Links: Profile News Message Board | |
| Charts:- Daily , Weekly | |
| Add DHI to Watchlist: View: Get Complete DHI Trend Analysis ➞ | |
 | AME AMETEK, Inc. |
| Sector: Industrials | |
| SubSector: Diversified Machinery | |
| MarketCap: 16611.8 Millions | |
| Recent Price: 166.56 Smart Investing & Trading Score: 0 | |
| Day Percent Change: 1.97% Day Change: 3.22 | |
| Week Change: -6.17% Year-to-date Change: 1.0% | |
| AME Links: Profile News Message Board | |
| Charts:- Daily , Weekly | |
| Add AME to Watchlist: View: Get Complete AME Trend Analysis ➞ | |
 | CARR Carrier Global Corporation |
| Sector: Industrials | |
| SubSector: Building Products & Equipment | |
| MarketCap: 32547 Millions | |
| Recent Price: 62.09 Smart Investing & Trading Score: 95 | |
| Day Percent Change: 1.89% Day Change: 1.15 | |
| Week Change: 2.63% Year-to-date Change: 8.1% | |
| CARR Links: Profile News Message Board | |
| Charts:- Daily , Weekly | |
| Add CARR to Watchlist: View: Get Complete CARR Trend Analysis ➞ | |
 | LEN Lennar Corporation |
| Sector: Industrials | |
| SubSector: Residential Construction | |
| MarketCap: 11926.6 Millions | |
| Recent Price: 158.10 Smart Investing & Trading Score: 62 | |
| Day Percent Change: 1.86% Day Change: 2.89 | |
| Week Change: 2.47% Year-to-date Change: 6.1% | |
| LEN Links: Profile News Message Board | |
| Charts:- Daily , Weekly | |
| Add LEN to Watchlist: View: Get Complete LEN Trend Analysis ➞ | |
 | TDG TransDigm Group Incorporated |
| Sector: Industrials | |
| SubSector: Aerospace/Defense Products & Services | |
| MarketCap: 18441 Millions | |
| Recent Price: 1293.80 Smart Investing & Trading Score: 95 | |
| Day Percent Change: 1.73% Day Change: 22.02 | |
| Week Change: 2.75% Year-to-date Change: 27.9% | |
| TDG Links: Profile News Message Board | |
| Charts:- Daily , Weekly | |
| Add TDG to Watchlist: View: Get Complete TDG Trend Analysis ➞ | |
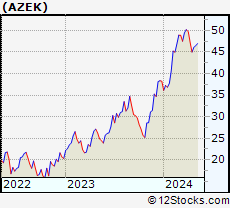 | AZEK The AZEK Company Inc. |
| Sector: Industrials | |
| SubSector: Building Products & Equipment | |
| MarketCap: 55127 Millions | |
| Recent Price: 46.52 Smart Investing & Trading Score: 39 | |
| Day Percent Change: 1.73% Day Change: 0.79 | |
| Week Change: 0.85% Year-to-date Change: 21.6% | |
| AZEK Links: Profile News Message Board | |
| Charts:- Daily , Weekly | |
| Add AZEK to Watchlist: View: Get Complete AZEK Trend Analysis ➞ | |
 | ETN Eaton Corporation plc |
| Sector: Industrials | |
| SubSector: Diversified Machinery | |
| MarketCap: 29829.4 Millions | |
| Recent Price: 320.50 Smart Investing & Trading Score: 70 | |
| Day Percent Change: 1.66% Day Change: 5.23 | |
| Week Change: -1.17% Year-to-date Change: 33.1% | |
| ETN Links: Profile News Message Board | |
| Charts:- Daily , Weekly | |
| Add ETN to Watchlist: View: Get Complete ETN Trend Analysis ➞ | |
 | ROK Rockwell Automation, Inc. |
| Sector: Industrials | |
| SubSector: Diversified Machinery | |
| MarketCap: 15666.1 Millions | |
| Recent Price: 274.05 Smart Investing & Trading Score: 32 | |
| Day Percent Change: 1.48% Day Change: 4.01 | |
| Week Change: -2.17% Year-to-date Change: -11.7% | |
| ROK Links: Profile News Message Board | |
| Charts:- Daily , Weekly | |
| Add ROK to Watchlist: View: Get Complete ROK Trend Analysis ➞ | |
 | NVR NVR, Inc. |
| Sector: Industrials | |
| SubSector: Residential Construction | |
| MarketCap: 9912.56 Millions | |
| Recent Price: 7586.55 Smart Investing & Trading Score: 45 | |
| Day Percent Change: 1.44% Day Change: 107.54 | |
| Week Change: -0.79% Year-to-date Change: 8.4% | |
| NVR Links: Profile News Message Board | |
| Charts:- Daily , Weekly | |
| Add NVR to Watchlist: View: Get Complete NVR Trend Analysis ➞ | |
 | DE Deere & Company |
| Sector: Industrials | |
| SubSector: Farm & Construction Machinery | |
| MarketCap: 39168.7 Millions | |
| Recent Price: 400.96 Smart Investing & Trading Score: 83 | |
| Day Percent Change: 1.26% Day Change: 5.00 | |
| Week Change: 1.94% Year-to-date Change: 0.3% | |
| DE Links: Profile News Message Board | |
| Charts:- Daily , Weekly | |
| Add DE to Watchlist: View: Get Complete DE Trend Analysis ➞ | |
 | ROP Roper Technologies, Inc. |
| Sector: Industrials | |
| SubSector: Diversified Machinery | |
| MarketCap: 33366.2 Millions | |
| Recent Price: 517.21 Smart Investing & Trading Score: 32 | |
| Day Percent Change: 1.25% Day Change: 6.39 | |
| Week Change: -1.82% Year-to-date Change: -5.1% | |
| ROP Links: Profile News Message Board | |
| Charts:- Daily , Weekly | |
| Add ROP to Watchlist: View: Get Complete ROP Trend Analysis ➞ | |
 | HON Honeywell International Inc. |
| Sector: Industrials | |
| SubSector: Diversified Machinery | |
| MarketCap: 91189.1 Millions | |
| Recent Price: 195.81 Smart Investing & Trading Score: 57 | |
| Day Percent Change: 1.12% Day Change: 2.17 | |
| Week Change: 1.22% Year-to-date Change: -6.6% | |
| HON Links: Profile News Message Board | |
| Charts:- Daily , Weekly | |
| Add HON to Watchlist: View: Get Complete HON Trend Analysis ➞ | |
 | PH Parker-Hannifin Corporation |
| Sector: Industrials | |
| SubSector: Industrial Equipment & Components | |
| MarketCap: 14888.9 Millions | |
| Recent Price: 536.18 Smart Investing & Trading Score: 20 | |
| Day Percent Change: 1.04% Day Change: 5.50 | |
| Week Change: -3.15% Year-to-date Change: 16.4% | |
| PH Links: Profile News Message Board | |
| Charts:- Daily , Weekly | |
| Add PH to Watchlist: View: Get Complete PH Trend Analysis ➞ | |
 | SWK Stanley Black & Decker, Inc. |
| Sector: Industrials | |
| SubSector: Machine Tools & Accessories | |
| MarketCap: 14274.8 Millions | |
| Recent Price: 85.80 Smart Investing & Trading Score: 7 | |
| Day Percent Change: 0.95% Day Change: 0.81 | |
| Week Change: -4.36% Year-to-date Change: -12.5% | |
| SWK Links: Profile News Message Board | |
| Charts:- Daily , Weekly | |
| Add SWK to Watchlist: View: Get Complete SWK Trend Analysis ➞ | |
 | GE General Electric Company |
| Sector: Industrials | |
| SubSector: Diversified Machinery | |
| MarketCap: 64710.6 Millions | |
| Recent Price: 164.11 Smart Investing & Trading Score: 90 | |
| Day Percent Change: 0.90% Day Change: 1.47 | |
| Week Change: 1.08% Year-to-date Change: 28.6% | |
| GE Links: Profile News Message Board | |
| Charts:- Daily , Weekly | |
| Add GE to Watchlist: View: Get Complete GE Trend Analysis ➞ | |
 | XYL Xylem Inc. |
| Sector: Industrials | |
| SubSector: Diversified Machinery | |
| MarketCap: 12195.1 Millions | |
| Recent Price: 137.21 Smart Investing & Trading Score: 100 | |
| Day Percent Change: 0.90% Day Change: 1.22 | |
| Week Change: 3.63% Year-to-date Change: 20.0% | |
| XYL Links: Profile News Message Board | |
| Charts:- Daily , Weekly | |
| Add XYL to Watchlist: View: Get Complete XYL Trend Analysis ➞ | |
 | MAS Masco Corporation |
| Sector: Industrials | |
| SubSector: General Building Materials | |
| MarketCap: 8655.63 Millions | |
| Recent Price: 69.56 Smart Investing & Trading Score: 32 | |
| Day Percent Change: 0.84% Day Change: 0.58 | |
| Week Change: -0.42% Year-to-date Change: 3.9% | |
| MAS Links: Profile News Message Board | |
| Charts:- Daily , Weekly | |
| Add MAS to Watchlist: View: Get Complete MAS Trend Analysis ➞ | |
 | DOV Dover Corporation |
| Sector: Industrials | |
| SubSector: Diversified Machinery | |
| MarketCap: 10725.6 Millions | |
| Recent Price: 178.99 Smart Investing & Trading Score: 71 | |
| Day Percent Change: 0.81% Day Change: 1.44 | |
| Week Change: -0.65% Year-to-date Change: 16.4% | |
| DOV Links: Profile News Message Board | |
| Charts:- Daily , Weekly | |
| Add DOV to Watchlist: View: Get Complete DOV Trend Analysis ➞ | |
 | ITW Illinois Tool Works Inc. |
| Sector: Industrials | |
| SubSector: Diversified Machinery | |
| MarketCap: 45324.8 Millions | |
| Recent Price: 243.92 Smart Investing & Trading Score: 25 | |
| Day Percent Change: 0.78% Day Change: 1.88 | |
| Week Change: -1.76% Year-to-date Change: -6.9% | |
| ITW Links: Profile News Message Board | |
| Charts:- Daily , Weekly | |
| Add ITW to Watchlist: View: Get Complete ITW Trend Analysis ➞ | |
 | HEI HEICO Corporation |
| Sector: Industrials | |
| SubSector: Aerospace/Defense Products & Services | |
| MarketCap: 10023.1 Millions | |
| Recent Price: 211.36 Smart Investing & Trading Score: 95 | |
| Day Percent Change: 0.63% Day Change: 1.32 | |
| Week Change: 2.37% Year-to-date Change: 18.2% | |
| HEI Links: Profile News Message Board | |
| Charts:- Daily , Weekly | |
| Add HEI to Watchlist: View: Get Complete HEI Trend Analysis ➞ | |
 | DHR Danaher Corporation |
| Sector: Industrials | |
| SubSector: Diversified Machinery | |
| MarketCap: 93210.3 Millions | |
| Recent Price: 248.38 Smart Investing & Trading Score: 62 | |
| Day Percent Change: 0.62% Day Change: 1.54 | |
| Week Change: 0.73% Year-to-date Change: 7.4% | |
| DHR Links: Profile News Message Board | |
| Charts:- Daily , Weekly | |
| Add DHR to Watchlist: View: Get Complete DHR Trend Analysis ➞ | |
 | MEG Montrose Environmental Group, Inc. |
| Sector: Industrials | |
| SubSector: Waste Management | |
| MarketCap: 71627 Millions | |
| Recent Price: 44.51 Smart Investing & Trading Score: 88 | |
| Day Percent Change: 0.54% Day Change: 0.24 | |
| Week Change: 3.25% Year-to-date Change: 38.4% | |
| MEG Links: Profile News Message Board | |
| Charts:- Daily , Weekly | |
| Add MEG to Watchlist: View: Get Complete MEG Trend Analysis ➞ | |
 | BA The Boeing Company |
| Sector: Industrials | |
| SubSector: Aerospace/Defense Products & Services | |
| MarketCap: 65336.4 Millions | |
| Recent Price: 179.79 Smart Investing & Trading Score: 64 | |
| Day Percent Change: 0.53% Day Change: 0.94 | |
| Week Change: 7.52% Year-to-date Change: -31.0% | |
| BA Links: Profile News Message Board | |
| Charts:- Daily , Weekly | |
| Add BA to Watchlist: View: Get Complete BA Trend Analysis ➞ | |
| For tabular summary view of above stock list: Summary View ➞ 0 - 25 , 25 - 50 | ||
| Click To Change The Sort Order: By Market Cap or Company Size Performance: Year-to-date, Week and Day | |
| Select Chart Type: | ||
|
Best Stocks Today 12Stocks.com |
© 2024 12Stocks.com Terms & Conditions Privacy Contact Us
All Information Provided Only For Education And Not To Be Used For Investing or Trading. See Terms & Conditions


One More Thing ... Get Best Stocks Delivered Daily!
Never Ever Miss A Move With Our Top Ten Stocks Lists
Find Best Stocks In Any Market - Bull or Bear Market
Take A Peek At Our Top Ten Stocks Lists: Daily, Weekly, Year-to-Date & Top Trends
Find Best Stocks In Any Market - Bull or Bear Market
Take A Peek At Our Top Ten Stocks Lists: Daily, Weekly, Year-to-Date & Top Trends
Industrial Stocks With Best Up Trends [0-bearish to 100-bullish]: IES [100], Enovix [100], MasTec [100], Arcosa [100], Interface [100], SPX [100], Luxfer [100], Aspen Aerogels[100], United States[100], Carpenter Technology[100], Granite Construction[100]
Best Industrial Stocks Year-to-Date:
Intuitive Machines[119.14%], IES [103.72%], Tutor Perini[97.69%], NuScale Power[87.6%], FTAI Infrastructure[87.4%], Powell Industries[80.94%], Caesarstone [70.86%], EMCOR [68.86%], Aspen Aerogels[59.13%], Masonite [56.74%], Comfort Systems[53.17%] Best Industrial Stocks This Week:
Aspen Aerogels[55.96%], Enovix [54.02%], TPI Composites[34.53%], Amprius Technologies[23.85%], Carpenter Technology[23.38%], IES [23.1%], Luxfer [20.25%], LanzaTech Global[19.78%], Pinterest [18.99%], Valmont Industries[17.25%], ESS Tech[15.91%] Best Industrial Stocks Daily:
IES [17.92%], Enovix [16.62%], Latham [13.51%], MasTec [11.87%], Plug Power[11.84%], Arcosa [9.96%], Interface [9.65%], PureCycle Technologies[9.31%], Lion Electric[8.71%], Eos Energy[8.59%], Virgin Galactic[7.50%]