
 Login Sign Up


| |||||
 |  | ||||

| 12Stocks.com Market Intelligence |
Best Consumer Staples Stocks
| In a hurry? Consumer Staples Stocks: Performance Trends Table, Stock Charts
Sort Consumer Staples : Daily, Weekly, Year-to-Date, Market Cap & Trends. Filter Consumer Staples stocks list by size: All Large Mid-Range Small |
| 12Stocks.com Consumer Staples Stocks Performances & Trends Daily | |||||||||
|
|  The overall Smart Investing & Trading Score is 71 (0-bearish to 100-bullish) which puts Consumer Staples sector in short term neutral to bullish trend. The Smart Investing & Trading Score from previous trading session is 81 and hence a deterioration of trend.
| ||||||||
Here are the Smart Investing & Trading Scores of the most requested Consumer Staples stocks at 12Stocks.com (click stock name for detailed review):
|


| 12Stocks.com: Investing in Consumer Staples sector with Stocks | |
|
The following table helps investors and traders sort through current performance and trends (as measured by Smart Investing & Trading Score) of various
stocks in the Consumer Staples sector. Quick View: Move mouse or cursor over stock symbol (ticker) to view short-term Technical chart and over stock name to view long term chart. Click on  to add stock symbol to your watchlist and to add stock symbol to your watchlist and  to view watchlist. Click on any ticker or stock name for detailed market intelligence report for that stock. to view watchlist. Click on any ticker or stock name for detailed market intelligence report for that stock. |
12Stocks.com Performance of Stocks in Consumer Staples Sector
| Ticker | Stock Name | Watchlist | Category | Recent Price | Smart Investing & Trading Score | Change % | YTD Change% |
| SEE | Sealed Air |   | Packaging & Containers | 31.48 | 35 | -1.07% | -13.80% |
| NAPA | Duckhorn Portfolio | | Beverages - Wineries & Distilleries | 8.47 | 60 | -0.59% | -13.92% |
| VRA | Vera Bradley | | Textile - Apparel Footwear & Accessories | 6.59 | 32 | -2.80% | -14.42% |
| RCKY | Rocky Brands | | Textile - Apparel Footwear & Accessories | 25.77 | 5 | -2.61% | -14.61% |
| DAN | Dana | | Auto Parts | 12.43 | 57 | -1.51% | -14.92% |
| NKE | NIKE | | Textile - Apparel Footwear & Accessories | 92.26 | 18 | -1.91% | -15.02% |
| WPRT | Westport Fuel | | Auto Parts | 5.61 | 18 | -1.23% | -15.26% |
| WGO | Winnebago Industries | | Recreational Vehicles | 61.58 | 0 | -2.67% | -15.50% |
| MOV | Movado | | Recreational Goods, Other | 25.47 | 25 | -2.26% | -15.52% |
| BSET | Bassett Furniture | | Home Furnishings & Fixtures | 13.98 | 64 | -0.85% | -15.78% |
| THO | Thor Industries | | Recreational Vehicles | 99.42 | 10 | -3.24% | -15.92% |
| BERY | Berry Global | | Packaging & Containers | 56.64 | 32 | -1.41% | -15.95% |
| GT | Goodyear Tire | | Rubber & Plastics | 11.96 | 35 | -1.32% | -16.48% |
| BC | Brunswick | | Recreational Goods, Other | 80.64 | 38 | -1.79% | -16.65% |
| AXL | American Axle | | Auto Parts | 7.34 | 42 | -2.91% | -16.69% |
| DNUT | Krispy Kreme | | Grocery Stores | 12.65 | 10 | -2.77% | -16.75% |
| SPTN | SpartanNash | | Food Wholesale | 19.09 | 35 | -1.55% | -16.82% |
| ABEV | Ambev S.A | | Beverages | 2.32 | 39 | -1.69% | -17.14% |
| GIII | G-III Apparel | | Textile - Apparel Clothing | 28.15 | 32 | -1.85% | -17.16% |
| LCII | LCI Industries | | Recreational Vehicles | 103.98 | 0 | -3.27% | -17.29% |
| BEST | BEST | | Packaging & Containers | 2.11 | 42 | 0.48% | -17.30% |
| ADNT | Adient | | Auto Parts | 29.87 | 45 | -2.86% | -17.85% |
| JJSF | J & J Snack Foods | | Processed | 137.29 | 30 | 0.51% | -17.86% |
| CENT | Central Garden | | Food | 40.95 | 40 | -0.70% | -18.28% |
| ADM | Archer-Daniels-Midland | | Farm | 58.66 | 36 | -3.34% | -18.78% |
| For chart view version of above stock list: Chart View ➞ 0 - 25 , 25 - 50 , 50 - 75 , 75 - 100 , 100 - 125 , 125 - 150 , 150 - 175 , 175 - 200 , 200 - 225 , 225 - 250 , 250 - 275 , 275 - 300 | ||
 | Click To Change The Sort Order: By Market Cap or Company Size Performance: Year-to-date, Week and Day |  |
|
Get the most comprehensive stock market coverage daily at 12Stocks.com ➞ Best Stocks Today ➞ Best Stocks Weekly ➞ Best Stocks Year-to-Date ➞ Best Stocks Trends ➞  Best Stocks Today 12Stocks.com Best Nasdaq Stocks ➞ Best S&P 500 Stocks ➞ Best Tech Stocks ➞ Best Biotech Stocks ➞ |
| Detailed Overview of Consumer Staples Stocks |
| Consumer Staples Technical Overview, Leaders & Laggards, Top Consumer Staples ETF Funds & Detailed Consumer Staples Stocks List, Charts, Trends & More |
| Consumer Staples Sector: Technical Analysis, Trends & YTD Performance | |
| Consumer Staples sector is composed of stocks
from household consumer products, food, farm, cosmetics, tobacco,
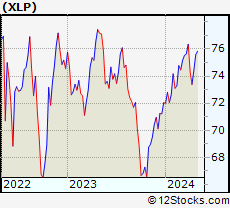
and beverages subsectors. Consumer Staples sector, as represented by XLP, an exchange-traded fund [ETF] that holds basket of Consumer Staples stocks (e.g, Proctor & Gamble, Pepsi) is up by 4.82% and is currently outperforming the overall market by 0.02% year-to-date. Below is a quick view of Technical charts and trends: |
|
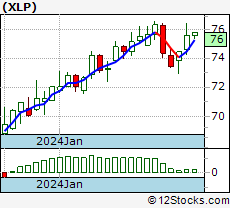 XLP Weekly Chart |
|
| Long Term Trend: Very Good | |
| Medium Term Trend: Good | |
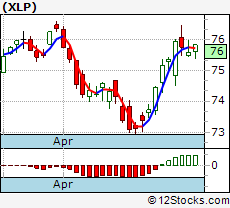 XLP Daily Chart |
|
| Short Term Trend: Not Good | |
| Overall Trend Score: 71 | |
| YTD Performance: 4.82% | |
| **Trend Scores & Views Are Only For Educational Purposes And Not For Investing | |
| 12Stocks.com: Top Performing Consumer Staples Sector Stocks | ||||||||||||||||||||||||||||||||||||||||||||||||
 The top performing Consumer Staples sector stocks year to date are
Now, more recently, over last week, the top performing Consumer Staples sector stocks on the move are


|
||||||||||||||||||||||||||||||||||||||||||||||||
| 12Stocks.com: Investing in Consumer Staples Sector using Exchange Traded Funds | |
|
The following table shows list of key exchange traded funds (ETF) that
help investors track Consumer Staples Index. For detailed view, check out our ETF Funds section of our website. Quick View: Move mouse or cursor over ETF symbol (ticker) to view short-term Technical chart and over ETF name to view long term chart. Click on ticker or stock name for detailed view. Click on to add stock symbol to your watchlist and to view watchlist. |
12Stocks.com List of ETFs that track Consumer Staples Index
| Ticker | ETF Name | Watchlist | Recent Price | Smart Investing & Trading Score | Change % | Week % | Year-to-date % |
| XLP | Consumer Staples | | 75.50 | 71 | -0.44 | -0.12 | 4.82% |
| VDC | Consumer Staples | | 200.80 | 66 | -0.54 | -0.2 | 5.15% |
| KXI | Global Consumer Staples | | 60.07 | 76 | -0.45 | -0.22 | 1.32% |
| PSL | DWA Consumer Staples | | 94.01 | 56 | -1.26 | -1.31 | 2.75% |
| FSTA | Consumer Staples | | 46.84 | 66 | -0.52 | -0.2 | 4.96% |
| 12Stocks.com: Charts, Trends, Fundamental Data and Performances of Consumer Staples Stocks | |
|
We now take in-depth look at all Consumer Staples stocks including charts, multi-period performances and overall trends (as measured by Smart Investing & Trading Score). One can sort Consumer Staples stocks (click link to choose) by Daily, Weekly and by Year-to-Date performances. Also, one can sort by size of the company or by market capitalization. |
| Select Your Default Chart Type: | |||||
| |||||
| Click on stock symbol or name for detailed view. Click on to add stock symbol to your watchlist and to view watchlist. Quick View: Move mouse or cursor over "Daily" to quickly view daily Technical stock chart and over "Weekly" to view weekly Technical stock chart. | |||||
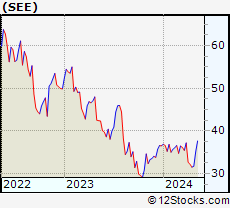 | SEE Sealed Air Corporation |
| Sector: Consumer Staples | |
| SubSector: Packaging & Containers | |
| MarketCap: 4037.23 Millions | |
| Recent Price: 31.48 Smart Investing & Trading Score: 35 | |
| Day Percent Change: -1.07% Day Change: -0.34 | |
| Week Change: -0.82% Year-to-date Change: -13.8% | |
| SEE Links: Profile News Message Board | |
| Charts:- Daily , Weekly | |
| Add SEE to Watchlist: View: Get Complete SEE Trend Analysis ➞ | |
 | NAPA The Duckhorn Portfolio, Inc. |
| Sector: Consumer Staples | |
| SubSector: Beverages - Wineries & Distilleries | |
| MarketCap: 1500 Millions | |
| Recent Price: 8.47 Smart Investing & Trading Score: 60 | |
| Day Percent Change: -0.59% Day Change: -0.05 | |
| Week Change: 0.95% Year-to-date Change: -13.9% | |
| NAPA Links: Profile News Message Board | |
| Charts:- Daily , Weekly | |
| Add NAPA to Watchlist: View: Get Complete NAPA Trend Analysis ➞ | |
 | VRA Vera Bradley, Inc. |
| Sector: Consumer Staples | |
| SubSector: Textile - Apparel Footwear & Accessories | |
| MarketCap: 151.17 Millions | |
| Recent Price: 6.59 Smart Investing & Trading Score: 32 | |
| Day Percent Change: -2.80% Day Change: -0.19 | |
| Week Change: -2.3% Year-to-date Change: -14.4% | |
| VRA Links: Profile News Message Board | |
| Charts:- Daily , Weekly | |
| Add VRA to Watchlist: View: Get Complete VRA Trend Analysis ➞ | |
 | RCKY Rocky Brands, Inc. |
| Sector: Consumer Staples | |
| SubSector: Textile - Apparel Footwear & Accessories | |
| MarketCap: 137.47 Millions | |
| Recent Price: 25.77 Smart Investing & Trading Score: 5 | |
| Day Percent Change: -2.61% Day Change: -0.69 | |
| Week Change: -2.72% Year-to-date Change: -14.6% | |
| RCKY Links: Profile News Message Board | |
| Charts:- Daily , Weekly | |
| Add RCKY to Watchlist: View: Get Complete RCKY Trend Analysis ➞ | |
 | DAN Dana Incorporated |
| Sector: Consumer Staples | |
| SubSector: Auto Parts | |
| MarketCap: 1052.59 Millions | |
| Recent Price: 12.43 Smart Investing & Trading Score: 57 | |
| Day Percent Change: -1.51% Day Change: -0.19 | |
| Week Change: -0.4% Year-to-date Change: -14.9% | |
| DAN Links: Profile News Message Board | |
| Charts:- Daily , Weekly | |
| Add DAN to Watchlist: View: Get Complete DAN Trend Analysis ➞ | |
 | NKE NIKE, Inc. |
| Sector: Consumer Staples | |
| SubSector: Textile - Apparel Footwear & Accessories | |
| MarketCap: 118918 Millions | |
| Recent Price: 92.26 Smart Investing & Trading Score: 18 | |
| Day Percent Change: -1.91% Day Change: -1.80 | |
| Week Change: -1.98% Year-to-date Change: -15.0% | |
| NKE Links: Profile News Message Board | |
| Charts:- Daily , Weekly | |
| Add NKE to Watchlist: View: Get Complete NKE Trend Analysis ➞ | |
 | WPRT Westport Fuel Systems Inc. |
| Sector: Consumer Staples | |
| SubSector: Auto Parts | |
| MarketCap: 108.939 Millions | |
| Recent Price: 5.61 Smart Investing & Trading Score: 18 | |
| Day Percent Change: -1.23% Day Change: -0.07 | |
| Week Change: -0.88% Year-to-date Change: -15.3% | |
| WPRT Links: Profile News Message Board | |
| Charts:- Daily , Weekly | |
| Add WPRT to Watchlist: View: Get Complete WPRT Trend Analysis ➞ | |
 | WGO Winnebago Industries, Inc. |
| Sector: Consumer Staples | |
| SubSector: Recreational Vehicles | |
| MarketCap: 896.559 Millions | |
| Recent Price: 61.58 Smart Investing & Trading Score: 0 | |
| Day Percent Change: -2.67% Day Change: -1.69 | |
| Week Change: -2.36% Year-to-date Change: -15.5% | |
| WGO Links: Profile News Message Board | |
| Charts:- Daily , Weekly | |
| Add WGO to Watchlist: View: Get Complete WGO Trend Analysis ➞ | |
 | MOV Movado Group, Inc. |
| Sector: Consumer Staples | |
| SubSector: Recreational Goods, Other | |
| MarketCap: 161.659 Millions | |
| Recent Price: 25.47 Smart Investing & Trading Score: 25 | |
| Day Percent Change: -2.26% Day Change: -0.59 | |
| Week Change: -2% Year-to-date Change: -15.5% | |
| MOV Links: Profile News Message Board | |
| Charts:- Daily , Weekly | |
| Add MOV to Watchlist: View: Get Complete MOV Trend Analysis ➞ | |
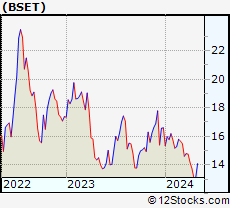 | BSET Bassett Furniture Industries, Incorporated |
| Sector: Consumer Staples | |
| SubSector: Home Furnishings & Fixtures | |
| MarketCap: 66.3435 Millions | |
| Recent Price: 13.98 Smart Investing & Trading Score: 64 | |
| Day Percent Change: -0.85% Day Change: -0.12 | |
| Week Change: 6.55% Year-to-date Change: -15.8% | |
| BSET Links: Profile News Message Board | |
| Charts:- Daily , Weekly | |
| Add BSET to Watchlist: View: Get Complete BSET Trend Analysis ➞ | |
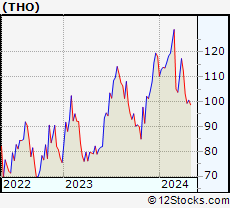 | THO Thor Industries, Inc. |
| Sector: Consumer Staples | |
| SubSector: Recreational Vehicles | |
| MarketCap: 2279.29 Millions | |
| Recent Price: 99.42 Smart Investing & Trading Score: 10 | |
| Day Percent Change: -3.24% Day Change: -3.33 | |
| Week Change: -1.16% Year-to-date Change: -15.9% | |
| THO Links: Profile News Message Board | |
| Charts:- Daily , Weekly | |
| Add THO to Watchlist: View: Get Complete THO Trend Analysis ➞ | |
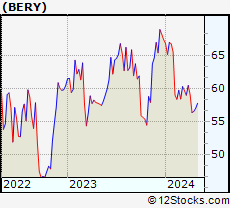 | BERY Berry Global Group, Inc. |
| Sector: Consumer Staples | |
| SubSector: Packaging & Containers | |
| MarketCap: 4349.33 Millions | |
| Recent Price: 56.64 Smart Investing & Trading Score: 32 | |
| Day Percent Change: -1.41% Day Change: -0.81 | |
| Week Change: -0.72% Year-to-date Change: -16.0% | |
| BERY Links: Profile News Message Board | |
| Charts:- Daily , Weekly | |
| Add BERY to Watchlist: View: Get Complete BERY Trend Analysis ➞ | |
 | GT The Goodyear Tire & Rubber Company |
| Sector: Consumer Staples | |
| SubSector: Rubber & Plastics | |
| MarketCap: 1483.7 Millions | |
| Recent Price: 11.96 Smart Investing & Trading Score: 35 | |
| Day Percent Change: -1.32% Day Change: -0.16 | |
| Week Change: 1.01% Year-to-date Change: -16.5% | |
| GT Links: Profile News Message Board | |
| Charts:- Daily , Weekly | |
| Add GT to Watchlist: View: Get Complete GT Trend Analysis ➞ | |
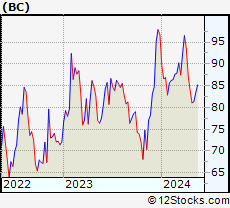 | BC Brunswick Corporation |
| Sector: Consumer Staples | |
| SubSector: Recreational Goods, Other | |
| MarketCap: 2481.59 Millions | |
| Recent Price: 80.64 Smart Investing & Trading Score: 38 | |
| Day Percent Change: -1.79% Day Change: -1.47 | |
| Week Change: -0.54% Year-to-date Change: -16.7% | |
| BC Links: Profile News Message Board | |
| Charts:- Daily , Weekly | |
| Add BC to Watchlist: View: Get Complete BC Trend Analysis ➞ | |
 | AXL American Axle & Manufacturing Holdings, Inc. |
| Sector: Consumer Staples | |
| SubSector: Auto Parts | |
| MarketCap: 407.139 Millions | |
| Recent Price: 7.34 Smart Investing & Trading Score: 42 | |
| Day Percent Change: -2.91% Day Change: -0.22 | |
| Week Change: -2.39% Year-to-date Change: -16.7% | |
| AXL Links: Profile News Message Board | |
| Charts:- Daily , Weekly | |
| Add AXL to Watchlist: View: Get Complete AXL Trend Analysis ➞ | |
 | DNUT Krispy Kreme, Inc. |
| Sector: Consumer Staples | |
| SubSector: Grocery Stores | |
| MarketCap: 2480 Millions | |
| Recent Price: 12.65 Smart Investing & Trading Score: 10 | |
| Day Percent Change: -2.77% Day Change: -0.36 | |
| Week Change: -2.69% Year-to-date Change: -16.8% | |
| DNUT Links: Profile News Message Board | |
| Charts:- Daily , Weekly | |
| Add DNUT to Watchlist: View: Get Complete DNUT Trend Analysis ➞ | |
 | SPTN SpartanNash Company |
| Sector: Consumer Staples | |
| SubSector: Food Wholesale | |
| MarketCap: 671.229 Millions | |
| Recent Price: 19.09 Smart Investing & Trading Score: 35 | |
| Day Percent Change: -1.55% Day Change: -0.30 | |
| Week Change: -1.14% Year-to-date Change: -16.8% | |
| SPTN Links: Profile News Message Board | |
| Charts:- Daily , Weekly | |
| Add SPTN to Watchlist: View: Get Complete SPTN Trend Analysis ➞ | |
 | ABEV Ambev S.A. |
| Sector: Consumer Staples | |
| SubSector: Beverages - Brewers | |
| MarketCap: 37753.5 Millions | |
| Recent Price: 2.32 Smart Investing & Trading Score: 39 | |
| Day Percent Change: -1.69% Day Change: -0.04 | |
| Week Change: -0.43% Year-to-date Change: -17.1% | |
| ABEV Links: Profile News Message Board | |
| Charts:- Daily , Weekly | |
| Add ABEV to Watchlist: View: Get Complete ABEV Trend Analysis ➞ | |
 | GIII G-III Apparel Group, Ltd. |
| Sector: Consumer Staples | |
| SubSector: Textile - Apparel Clothing | |
| MarketCap: 354.365 Millions | |
| Recent Price: 28.15 Smart Investing & Trading Score: 32 | |
| Day Percent Change: -1.85% Day Change: -0.53 | |
| Week Change: -0.95% Year-to-date Change: -17.2% | |
| GIII Links: Profile News Message Board | |
| Charts:- Daily , Weekly | |
| Add GIII to Watchlist: View: Get Complete GIII Trend Analysis ➞ | |
 | LCII LCI Industries |
| Sector: Consumer Staples | |
| SubSector: Recreational Vehicles | |
| MarketCap: 1663.59 Millions | |
| Recent Price: 103.98 Smart Investing & Trading Score: 0 | |
| Day Percent Change: -3.27% Day Change: -3.51 | |
| Week Change: -3.11% Year-to-date Change: -17.3% | |
| LCII Links: Profile News Message Board | |
| Charts:- Daily , Weekly | |
| Add LCII to Watchlist: View: Get Complete LCII Trend Analysis ➞ | |
 | BEST BEST Inc. |
| Sector: Consumer Staples | |
| SubSector: Packaging & Containers | |
| MarketCap: 1981.73 Millions | |
| Recent Price: 2.11 Smart Investing & Trading Score: 42 | |
| Day Percent Change: 0.48% Day Change: 0.01 | |
| Week Change: 0% Year-to-date Change: -17.3% | |
| BEST Links: Profile News Message Board | |
| Charts:- Daily , Weekly | |
| Add BEST to Watchlist: View: Get Complete BEST Trend Analysis ➞ | |
 | ADNT Adient plc |
| Sector: Consumer Staples | |
| SubSector: Auto Parts | |
| MarketCap: 1003.39 Millions | |
| Recent Price: 29.87 Smart Investing & Trading Score: 45 | |
| Day Percent Change: -2.86% Day Change: -0.88 | |
| Week Change: -1.81% Year-to-date Change: -17.9% | |
| ADNT Links: Profile News Message Board | |
| Charts:- Daily , Weekly | |
| Add ADNT to Watchlist: View: Get Complete ADNT Trend Analysis ➞ | |
 | JJSF J & J Snack Foods Corp. |
| Sector: Consumer Staples | |
| SubSector: Processed & Packaged Goods | |
| MarketCap: 2706.28 Millions | |
| Recent Price: 137.29 Smart Investing & Trading Score: 30 | |
| Day Percent Change: 0.51% Day Change: 0.70 | |
| Week Change: 0.45% Year-to-date Change: -17.9% | |
| JJSF Links: Profile News Message Board | |
| Charts:- Daily , Weekly | |
| Add JJSF to Watchlist: View: Get Complete JJSF Trend Analysis ➞ | |
 | CENT Central Garden & Pet Company |
| Sector: Consumer Staples | |
| SubSector: Food - Major Diversified | |
| MarketCap: 1396.43 Millions | |
| Recent Price: 40.95 Smart Investing & Trading Score: 40 | |
| Day Percent Change: -0.70% Day Change: -0.29 | |
| Week Change: -0.82% Year-to-date Change: -18.3% | |
| CENT Links: Profile News Message Board | |
| Charts:- Daily , Weekly | |
| Add CENT to Watchlist: View: Get Complete CENT Trend Analysis ➞ | |
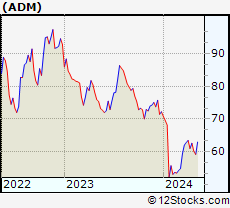 | ADM Archer-Daniels-Midland Company |
| Sector: Consumer Staples | |
| SubSector: Farm Products | |
| MarketCap: 18988.7 Millions | |
| Recent Price: 58.66 Smart Investing & Trading Score: 36 | |
| Day Percent Change: -3.34% Day Change: -2.03 | |
| Week Change: -2.4% Year-to-date Change: -18.8% | |
| ADM Links: Profile News Message Board | |
| Charts:- Daily , Weekly | |
| Add ADM to Watchlist: View: Get Complete ADM Trend Analysis ➞ | |
| For tabular summary view of above stock list: Summary View ➞ 0 - 25 , 25 - 50 , 50 - 75 , 75 - 100 , 100 - 125 , 125 - 150 , 150 - 175 , 175 - 200 , 200 - 225 , 225 - 250 , 250 - 275 , 275 - 300 | ||
| Click To Change The Sort Order: By Market Cap or Company Size Performance: Year-to-date, Week and Day | |
| Select Chart Type: | ||
|
Best Stocks Today 12Stocks.com |
© 2024 12Stocks.com Terms & Conditions Privacy Contact Us
All Information Provided Only For Education And Not To Be Used For Investing or Trading. See Terms & Conditions


One More Thing ... Get Best Stocks Delivered Daily!
Never Ever Miss A Move With Our Top Ten Stocks Lists
Find Best Stocks In Any Market - Bull or Bear Market
Take A Peek At Our Top Ten Stocks Lists: Daily, Weekly, Year-to-Date & Top Trends
Find Best Stocks In Any Market - Bull or Bear Market
Take A Peek At Our Top Ten Stocks Lists: Daily, Weekly, Year-to-Date & Top Trends
Consumer Staples Stocks With Best Up Trends [0-bearish to 100-bullish]: Village Farms[100], Clearwater Paper[100], Tuniu [100], Colgate-Palmolive [100], Cresud Sociedad[100], Unilever [100], Turning Point[95], Beyond Meat[95], Hormel Foods[95], Skechers U.S.A[93], Niu Technologies[93]
Best Consumer Staples Stocks Year-to-Date:
China Liberal[504.03%], Laird Superfood[113.16%], Village Farms[101.05%], QuantaSing [85.8%], Flexsteel Industries[74.85%], Vital Farms[70.45%], Modine [55.16%], Tuniu [50.52%], Purple Innovation[47.57%], Lifetime Brands[36.21%], Crocs [33.14%] Best Consumer Staples Stocks This Week:
Lixiang Education[20.85%], Tuniu [19.16%], Oatly [14.92%], Village Farms[12.92%], Clearwater Paper[11.96%], iRobot [9.96%], Tesla [8.91%], Dingdong (Cayman)[8.73%], Zevia PBC[7.34%], Simply Good[5.96%], Beyond Meat[5.94%] Best Consumer Staples Stocks Daily:
Village Farms[16.79%], Oatly [14.00%], Clearwater Paper[10.69%], Tuniu [9.77%], Skillful Craftsman[7.89%], Simply Good[6.42%], Pitney Bowes[2.65%], NIO [2.61%], Dingdong (Cayman)[2.24%], National Beverage[1.78%], Campbell Soup[1.74%]