
 Login Sign Up


| |||||
 |  | ||||

| 12Stocks.com Market Intelligence |
Best Healthcare Stocks
 | "Discover best trending healthcare stocks with 12Stocks.com." |
| - Subu Vdaygiri, Founder, 12Stocks.com |
| In a hurry? Healthcare Stocks Lists: Performance Trends Table, Stock Charts
Sort Healthcare stocks: Daily, Weekly, Year-to-Date, Market Cap & Trends. Filter Healthcare stocks list by size:All Healthcare Large Mid-Range Small |
| 12Stocks.com Healthcare Stocks Performances & Trends Daily | |||||||||
|
|  The overall Smart Investing & Trading Score is 88 (0-bearish to 100-bullish) which puts Healthcare sector in short term bullish trend. The Smart Investing & Trading Score from previous trading session is 95 and hence a deterioration of trend.
| ||||||||
Here are the Smart Investing & Trading Scores of the most requested Healthcare stocks at 12Stocks.com (click stock name for detailed review):
|


| 12Stocks.com: Investing in Healthcare sector with Stocks | |
|
The following table helps investors and traders sort through current performance and trends (as measured by Smart Investing & Trading Score) of various
stocks in the Healthcare sector. Quick View: Move mouse or cursor over stock symbol (ticker) to view short-term Technical chart and over stock name to view long term chart. Click on  to add stock symbol to your watchlist and to add stock symbol to your watchlist and  to view watchlist. Click on any ticker or stock name for detailed market intelligence report for that stock. to view watchlist. Click on any ticker or stock name for detailed market intelligence report for that stock. |
12Stocks.com Performance of Stocks in Healthcare Sector
| Ticker | Stock Name | Watchlist | Category | Recent Price | Smart Investing & Trading Score | Change % | Weekly Change% |
| ORGO | Organogenesis |   | Pharmaceutical | 2.74 | 30 | -3.86% | -9.57% |
| IMCR | Immunocore | | Biotechnology | 53.29 | 0 | -1.77% | -9.60% |
| ANIP | ANI | | Biotechnology | 61.43 | 0 | -3.67% | -9.73% |
| MCRB | Seres | | Biotechnology | 0.92 | 52 | -0.49% | -9.81% |
| SPRB | Spruce Biosciences | | Biotechnology | 0.75 | 25 | -2.58% | -9.93% |
| PIII | P3 Health | | Medical Care Facilities | 0.60 | 35 | 0.73% | -10.03% |
| CVM | CEL-SCI | | Biotechnology | 1.27 | 10 | -9.42% | -10.56% |
| INFU | InfuSystem | | Instruments | 6.51 | 0 | -4.62% | -10.58% |
| APLM | Apollomics | | Biotechnology | 0.33 | 17 | -0.89% | -10.67% |
| IMNM | Immunome | | Biotechnology | 13.83 | 15 | -3.96% | -10.77% |
| PSNL | Personalis | | Biotechnology | 1.40 | 20 | 0.36% | -10.83% |
| LIFW | MSP Recovery | | Health Information | 0.77 | 20 | -3.05% | -11.10% |
| DRRX | DURECT | | Pharmaceutical | 0.94 | 40 | -0.95% | -11.22% |
| PAVM | PAVmed | | Equipment | 1.88 | 25 | -1.57% | -11.32% |
| XFOR | X4 | | Biotechnology | 0.93 | 10 | -3.26% | -11.58% |
| ALXO | ALX Oncology | | Biotechnology | 14.21 | 0 | -3.07% | -12.34% |
| CGEM | Cullinan Oncology | | Biotechnology | 23.17 | 36 | -2.69% | -12.80% |
| SLDB | Solid Biosciences | | Pharmaceutical | 8.95 | 8 | -3.76% | -13.86% |
| ADVM | Adverum Biotechnologies | | Biotechnology | 8.00 | 36 | -2.68% | -13.98% |
| PBYI | Puma Biotechnology | | Biotechnology | 4.09 | 0 | -7.14% | -14.86% |
| MPLN | MultiPlan | | Healthcare Plans | 0.59 | 23 | -1.36% | -16.55% |
| RNLX | Renalytix AI | | Diagnostics & Research | 0.51 | 0 | -12.87% | -16.84% |
| RANI | Rani | | Biotechnology | 5.22 | 36 | -4.40% | -17.27% |
| DMTK | DermTech | | Equipment | 0.50 | 0 | -12.54% | -20.04% |
| BDTX | Black Diamond | | Biotechnology | 4.87 | 0 | -7.06% | -22.70% |
| For chart view version of above stock list: Chart View ➞ 0 - 25 , 25 - 50 , 50 - 75 , 75 - 100 , 100 - 125 , 125 - 150 , 150 - 175 , 175 - 200 , 200 - 225 , 225 - 250 , 250 - 275 , 275 - 300 , 300 - 325 , 325 - 350 , 350 - 375 , 375 - 400 , 400 - 425 , 425 - 450 , 450 - 475 , 475 - 500 , 500 - 525 , 525 - 550 , 550 - 575 , 575 - 600 , 600 - 625 , 625 - 650 , 650 - 675 , 675 - 700 , 700 - 725 | ||
 | Click To Change The Sort Order: By Market Cap or Company Size Performance: Year-to-date, Week and Day |  |
|
Get the most comprehensive stock market coverage daily at 12Stocks.com ➞ Best Stocks Today ➞ Best Stocks Weekly ➞ Best Stocks Year-to-Date ➞ Best Stocks Trends ➞  Best Stocks Today 12Stocks.com Best Nasdaq Stocks ➞ Best S&P 500 Stocks ➞ Best Tech Stocks ➞ Best Biotech Stocks ➞ |
| Detailed Overview of Healthcare Stocks |
| Healthcare Technical Overview, Leaders & Laggards, Top Healthcare ETF Funds & Detailed Healthcare Stocks List, Charts, Trends & More |
| Healthcare Sector: Technical Analysis, Trends & YTD Performance | |
| Healthcare sector is composed of stocks
from pharmaceutical, biotech, diagnostics labs, insurance providers
and healthcare services. Healthcare sector, as represented by XLV, an exchange-traded fund [ETF] that holds basket of Healthcare stocks (e.g, Merck, Amgen) is up by 7.28% and is currently underperforming the overall market by -3.29% year-to-date. Below is a quick view of Technical charts and trends: |
|
 XLV Weekly Chart |
|
| Long Term Trend: Very Good | |
| Medium Term Trend: Very Good | |
 XLV Daily Chart |
|
| Short Term Trend: Good | |
| Overall Trend Score: 88 | |
| YTD Performance: 7.28% | |
| **Trend Scores & Views Are Only For Educational Purposes And Not For Investing | |
| 12Stocks.com: Top Performing Healthcare Sector Stocks | ||||||||||||||||||||||||||||||||||||||||||||||||
 The top performing Healthcare sector stocks year to date are
Now, more recently, over last week, the top performing Healthcare sector stocks on the move are


|
||||||||||||||||||||||||||||||||||||||||||||||||
| 12Stocks.com: Investing in Healthcare Sector using Exchange Traded Funds | |
|
The following table shows list of key exchange traded funds (ETF) that
help investors track Healthcare Index. For detailed view, check out our ETF Funds section of our website. Quick View: Move mouse or cursor over ETF symbol (ticker) to view short-term Technical chart and over ETF name to view long term chart. Click on ticker or stock name for detailed view. Click on to add stock symbol to your watchlist and to view watchlist. |
12Stocks.com List of ETFs that track Healthcare Index
| Ticker | ETF Name | Watchlist | Recent Price | Smart Investing & Trading Score | Change % | Week % | Year-to-date % |
| XLV | Health Care | | 146.31 | 88 | 0.19 | 1.89 | 7.28% |
| XBI | Biotech | | 91.18 | 45 | -0.91 | 3.45 | 2.12% |
| IBB | Biotechnology | | 136.69 | 70 | -0.44 | 2.47 | 0.62% |
| BBH | Biotech | | 167.99 | 83 | -0.43 | 2.4 | 1.62% |
| VHT | Health Care | | 267.11 | 75 | 0.00 | 1.88 | 6.55% |
| IYH | Healthcare | | 61.34 | 75 | 0.08 | 1.78 | 7.15% |
| IHF | Healthcare Providers | | 53.91 | 88 | 0.50 | 1.45 | 2.67% |
| IHI | Medical Devices | | 56.69 | 70 | -0.27 | 1.54 | 5.04% |
| BIB | Biotechnology | | 56.96 | 57 | -0.99 | 4.57 | -0.16% |
| BIS | Short Biotech | | 17.59 | 30 | 1.13 | -3.93 | -2.66% |
| XHE | Health Care Equipment | | 87.45 | 88 | -0.30 | 2.45 | 3.79% |
| CURE | Healthcare Bull 3X | | 119.10 | 82 | 0.46 | 5.46 | 17.06% |
| LABU | Biotech Bull 3X | | 111.79 | 47 | -2.79 | 10 | -8.35% |
| LABD | Biotech Bear 3X | | 7.95 | 53 | 2.71 | -9.86 | -17.96% |
| PSCH | SmallCap Health Care | | 43.40 | 71 | -0.31 | 0.99 | 1.39% |
| XHS | Health Care Services | | 91.55 | 76 | -0.22 | 2.24 | 2.92% |
| PTH | DWA Healthcare Momentum | | 42.63 | 52 | -0.46 | 2.03 | 8.92% |
| BTEC | Principal Healthcare Innovators | | 36.48 | 45 | -1.25 | 0.84 | 0.41% |
| RXL | Health Care | | 102.76 | 75 | 0.12 | 3.46 | 12.42% |
| RXD | Short Health Care | | 10.56 | 10 | 0.10 | -3.36 | -11.43% |
| 12Stocks.com: Charts, Trends, Fundamental Data and Performances of Healthcare Stocks | |
|
We now take in-depth look at all Healthcare stocks including charts, multi-period performances and overall trends (as measured by Smart Investing & Trading Score). One can sort Healthcare stocks (click link to choose) by Daily, Weekly and by Year-to-Date performances. Also, one can sort by size of the company or by market capitalization. |
| Select Your Default Chart Type: | |||||
| |||||
| Click on stock symbol or name for detailed view. Click on to add stock symbol to your watchlist and to view watchlist. Quick View: Move mouse or cursor over "Daily" to quickly view daily Technical stock chart and over "Weekly" to view weekly Technical stock chart. | |||||

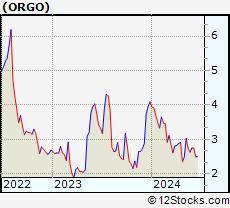 | ORGO Organogenesis Holdings Inc. |
| Sector: Health Care | |
| SubSector: Drugs - Generic | |
| MarketCap: 239.685 Millions | |
| Recent Price: 2.74 Smart Investing & Trading Score: 30 | |
| Day Percent Change: -3.86% Day Change: -0.11 | |
| Week Change: -9.57% Year-to-date Change: -33.0% | |
| ORGO Links: Profile News Message Board | |
| Charts:- Daily , Weekly | |
| Add ORGO to Watchlist: View: Get Complete ORGO Trend Analysis ➞ | |
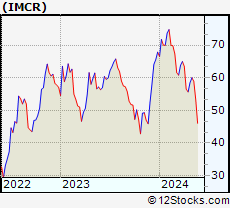 | IMCR Immunocore Holdings plc |
| Sector: Health Care | |
| SubSector: Biotechnology | |
| MarketCap: 2830 Millions | |
| Recent Price: 53.29 Smart Investing & Trading Score: 0 | |
| Day Percent Change: -1.77% Day Change: -0.96 | |
| Week Change: -9.6% Year-to-date Change: -21.5% | |
| IMCR Links: Profile News Message Board | |
| Charts:- Daily , Weekly | |
| Add IMCR to Watchlist: View: Get Complete IMCR Trend Analysis ➞ | |
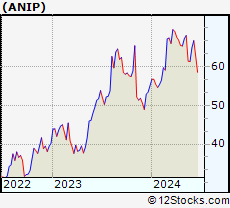 | ANIP ANI Pharmaceuticals, Inc. |
| Sector: Health Care | |
| SubSector: Biotechnology | |
| MarketCap: 489.285 Millions | |
| Recent Price: 61.43 Smart Investing & Trading Score: 0 | |
| Day Percent Change: -3.67% Day Change: -2.34 | |
| Week Change: -9.73% Year-to-date Change: 11.4% | |
| ANIP Links: Profile News Message Board | |
| Charts:- Daily , Weekly | |
| Add ANIP to Watchlist: View: Get Complete ANIP Trend Analysis ➞ | |
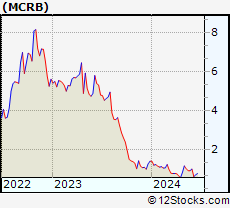 | MCRB Seres Therapeutics, Inc. |
| Sector: Health Care | |
| SubSector: Biotechnology | |
| MarketCap: 217.585 Millions | |
| Recent Price: 0.92 Smart Investing & Trading Score: 52 | |
| Day Percent Change: -0.49% Day Change: 0.00 | |
| Week Change: -9.81% Year-to-date Change: -34.3% | |
| MCRB Links: Profile News Message Board | |
| Charts:- Daily , Weekly | |
| Add MCRB to Watchlist: View: Get Complete MCRB Trend Analysis ➞ | |
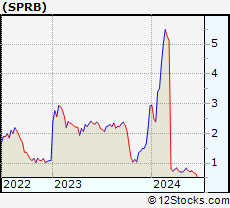 | SPRB Spruce Biosciences, Inc. |
| Sector: Health Care | |
| SubSector: Biotechnology | |
| MarketCap: 49487 Millions | |
| Recent Price: 0.75 Smart Investing & Trading Score: 25 | |
| Day Percent Change: -2.58% Day Change: -0.02 | |
| Week Change: -9.93% Year-to-date Change: -74.3% | |
| SPRB Links: Profile News Message Board | |
| Charts:- Daily , Weekly | |
| Add SPRB to Watchlist: View: Get Complete SPRB Trend Analysis ➞ | |
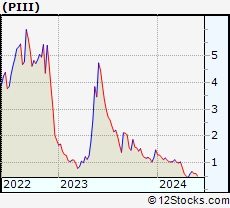 | PIII P3 Health Partners Inc. |
| Sector: Health Care | |
| SubSector: Medical Care Facilities | |
| MarketCap: 944 Millions | |
| Recent Price: 0.60 Smart Investing & Trading Score: 35 | |
| Day Percent Change: 0.73% Day Change: 0.00 | |
| Week Change: -10.03% Year-to-date Change: -59.2% | |
| PIII Links: Profile News Message Board | |
| Charts:- Daily , Weekly | |
| Add PIII to Watchlist: View: Get Complete PIII Trend Analysis ➞ | |
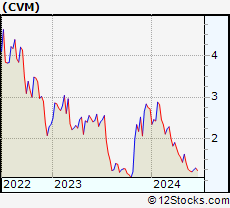 | CVM CEL-SCI Corporation |
| Sector: Health Care | |
| SubSector: Biotechnology | |
| MarketCap: 483.885 Millions | |
| Recent Price: 1.27 Smart Investing & Trading Score: 10 | |
| Day Percent Change: -9.42% Day Change: -0.13 | |
| Week Change: -10.56% Year-to-date Change: -53.3% | |
| CVM Links: Profile News Message Board | |
| Charts:- Daily , Weekly | |
| Add CVM to Watchlist: View: Get Complete CVM Trend Analysis ➞ | |
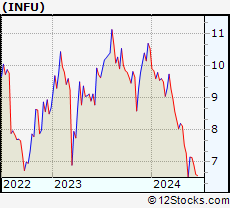 | INFU InfuSystem Holdings Inc. |
| Sector: Health Care | |
| SubSector: Medical Instruments & Supplies | |
| MarketCap: 136.76 Millions | |
| Recent Price: 6.51 Smart Investing & Trading Score: 0 | |
| Day Percent Change: -4.62% Day Change: -0.32 | |
| Week Change: -10.58% Year-to-date Change: -38.2% | |
| INFU Links: Profile News Message Board | |
| Charts:- Daily , Weekly | |
| Add INFU to Watchlist: View: Get Complete INFU Trend Analysis ➞ | |
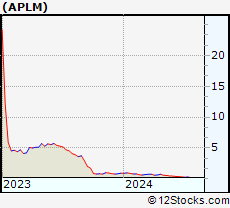 | APLM Apollomics, Inc. |
| Sector: Health Care | |
| SubSector: Biotechnology | |
| MarketCap: 481 Millions | |
| Recent Price: 0.33 Smart Investing & Trading Score: 17 | |
| Day Percent Change: -0.89% Day Change: 0.00 | |
| Week Change: -10.67% Year-to-date Change: -64.2% | |
| APLM Links: Profile News Message Board | |
| Charts:- Daily , Weekly | |
| Add APLM to Watchlist: View: Get Complete APLM Trend Analysis ➞ | |
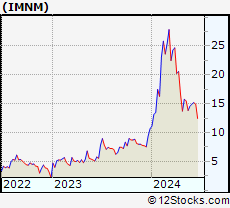 | IMNM Immunome, Inc. |
| Sector: Health Care | |
| SubSector: Biotechnology | |
| MarketCap: 12487 Millions | |
| Recent Price: 13.83 Smart Investing & Trading Score: 15 | |
| Day Percent Change: -3.96% Day Change: -0.57 | |
| Week Change: -10.77% Year-to-date Change: 29.4% | |
| IMNM Links: Profile News Message Board | |
| Charts:- Daily , Weekly | |
| Add IMNM to Watchlist: View: Get Complete IMNM Trend Analysis ➞ | |
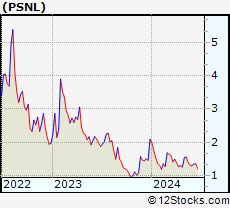 | PSNL Personalis, Inc. |
| Sector: Health Care | |
| SubSector: Biotechnology | |
| MarketCap: 242.385 Millions | |
| Recent Price: 1.40 Smart Investing & Trading Score: 20 | |
| Day Percent Change: 0.36% Day Change: 0.00 | |
| Week Change: -10.83% Year-to-date Change: -33.3% | |
| PSNL Links: Profile News Message Board | |
| Charts:- Daily , Weekly | |
| Add PSNL to Watchlist: View: Get Complete PSNL Trend Analysis ➞ | |
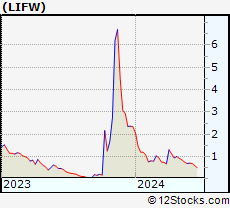 | LIFW MSP Recovery, Inc. |
| Sector: Health Care | |
| SubSector: Health Information Services | |
| MarketCap: 1110 Millions | |
| Recent Price: 0.77 Smart Investing & Trading Score: 20 | |
| Day Percent Change: -3.05% Day Change: -0.02 | |
| Week Change: -11.1% Year-to-date Change: -67.3% | |
| LIFW Links: Profile News Message Board | |
| Charts:- Daily , Weekly | |
| Add LIFW to Watchlist: View: Get Complete LIFW Trend Analysis ➞ | |
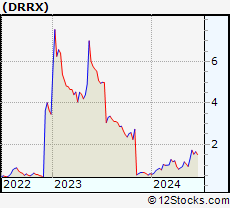 | DRRX DURECT Corporation |
| Sector: Health Care | |
| SubSector: Drug Manufacturers - Other | |
| MarketCap: 256.333 Millions | |
| Recent Price: 0.94 Smart Investing & Trading Score: 40 | |
| Day Percent Change: -0.95% Day Change: -0.01 | |
| Week Change: -11.22% Year-to-date Change: 59.5% | |
| DRRX Links: Profile News Message Board | |
| Charts:- Daily , Weekly | |
| Add DRRX to Watchlist: View: Get Complete DRRX Trend Analysis ➞ | |
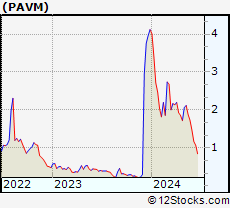 | PAVM PAVmed Inc. |
| Sector: Health Care | |
| SubSector: Medical Appliances & Equipment | |
| MarketCap: 65.408 Millions | |
| Recent Price: 1.88 Smart Investing & Trading Score: 25 | |
| Day Percent Change: -1.57% Day Change: -0.03 | |
| Week Change: -11.32% Year-to-date Change: -54.4% | |
| PAVM Links: Profile News Message Board | |
| Charts:- Daily , Weekly | |
| Add PAVM to Watchlist: View: Get Complete PAVM Trend Analysis ➞ | |
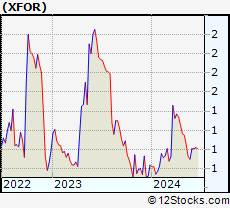 | XFOR X4 Pharmaceuticals, Inc. |
| Sector: Health Care | |
| SubSector: Biotechnology | |
| MarketCap: 143.385 Millions | |
| Recent Price: 0.93 Smart Investing & Trading Score: 10 | |
| Day Percent Change: -3.26% Day Change: -0.03 | |
| Week Change: -11.58% Year-to-date Change: 10.7% | |
| XFOR Links: Profile News Message Board | |
| Charts:- Daily , Weekly | |
| Add XFOR to Watchlist: View: Get Complete XFOR Trend Analysis ➞ | |
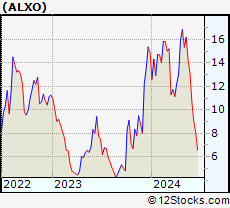 | ALXO ALX Oncology Holdings Inc. |
| Sector: Health Care | |
| SubSector: Biotechnology | |
| MarketCap: 41787 Millions | |
| Recent Price: 14.21 Smart Investing & Trading Score: 0 | |
| Day Percent Change: -3.07% Day Change: -0.45 | |
| Week Change: -12.34% Year-to-date Change: -4.5% | |
| ALXO Links: Profile News Message Board | |
| Charts:- Daily , Weekly | |
| Add ALXO to Watchlist: View: Get Complete ALXO Trend Analysis ➞ | |
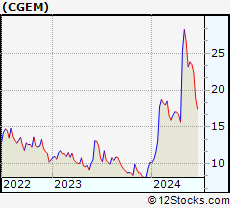 | CGEM Cullinan Oncology, Inc. |
| Sector: Health Care | |
| SubSector: Biotechnology | |
| MarketCap: 433 Millions | |
| Recent Price: 23.17 Smart Investing & Trading Score: 36 | |
| Day Percent Change: -2.69% Day Change: -0.64 | |
| Week Change: -12.8% Year-to-date Change: 127.3% | |
| CGEM Links: Profile News Message Board | |
| Charts:- Daily , Weekly | |
| Add CGEM to Watchlist: View: Get Complete CGEM Trend Analysis ➞ | |
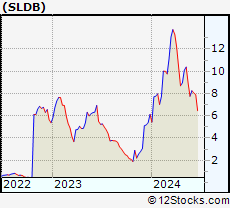 | SLDB Solid Biosciences Inc. |
| Sector: Health Care | |
| SubSector: Drugs - Generic | |
| MarketCap: 126.585 Millions | |
| Recent Price: 8.95 Smart Investing & Trading Score: 8 | |
| Day Percent Change: -3.76% Day Change: -0.35 | |
| Week Change: -13.86% Year-to-date Change: 45.8% | |
| SLDB Links: Profile News Message Board | |
| Charts:- Daily , Weekly | |
| Add SLDB to Watchlist: View: Get Complete SLDB Trend Analysis ➞ | |
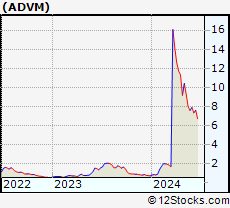 | ADVM Adverum Biotechnologies, Inc. |
| Sector: Health Care | |
| SubSector: Biotechnology | |
| MarketCap: 902.585 Millions | |
| Recent Price: 8.00 Smart Investing & Trading Score: 36 | |
| Day Percent Change: -2.68% Day Change: -0.22 | |
| Week Change: -13.98% Year-to-date Change: 962.7% | |
| ADVM Links: Profile News Message Board | |
| Charts:- Daily , Weekly | |
| Add ADVM to Watchlist: View: Get Complete ADVM Trend Analysis ➞ | |
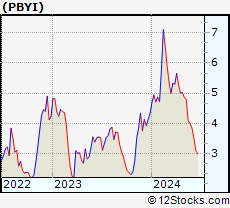 | PBYI Puma Biotechnology, Inc. |
| Sector: Health Care | |
| SubSector: Biotechnology | |
| MarketCap: 385.585 Millions | |
| Recent Price: 4.09 Smart Investing & Trading Score: 0 | |
| Day Percent Change: -7.14% Day Change: -0.32 | |
| Week Change: -14.86% Year-to-date Change: -5.4% | |
| PBYI Links: Profile News Message Board | |
| Charts:- Daily , Weekly | |
| Add PBYI to Watchlist: View: Get Complete PBYI Trend Analysis ➞ | |
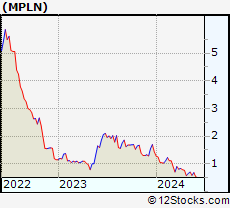 | MPLN MultiPlan Corporation |
| Sector: Health Care | |
| SubSector: Healthcare Plans | |
| MarketCap: 56087 Millions | |
| Recent Price: 0.59 Smart Investing & Trading Score: 23 | |
| Day Percent Change: -1.36% Day Change: -0.01 | |
| Week Change: -16.55% Year-to-date Change: -59.1% | |
| MPLN Links: Profile News Message Board | |
| Charts:- Daily , Weekly | |
| Add MPLN to Watchlist: View: Get Complete MPLN Trend Analysis ➞ | |
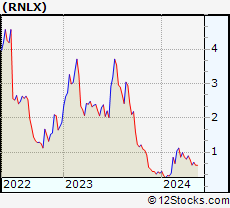 | RNLX Renalytix AI plc |
| Sector: Health Care | |
| SubSector: Diagnostics & Research | |
| MarketCap: 45487 Millions | |
| Recent Price: 0.51 Smart Investing & Trading Score: 0 | |
| Day Percent Change: -12.87% Day Change: -0.08 | |
| Week Change: -16.84% Year-to-date Change: 31.2% | |
| RNLX Links: Profile News Message Board | |
| Charts:- Daily , Weekly | |
| Add RNLX to Watchlist: View: Get Complete RNLX Trend Analysis ➞ | |
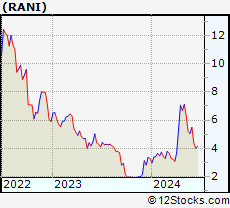 | RANI Rani Therapeutics Holdings, Inc. |
| Sector: Health Care | |
| SubSector: Biotechnology | |
| MarketCap: 202 Millions | |
| Recent Price: 5.22 Smart Investing & Trading Score: 36 | |
| Day Percent Change: -4.40% Day Change: -0.24 | |
| Week Change: -17.27% Year-to-date Change: 58.2% | |
| RANI Links: Profile News Message Board | |
| Charts:- Daily , Weekly | |
| Add RANI to Watchlist: View: Get Complete RANI Trend Analysis ➞ | |
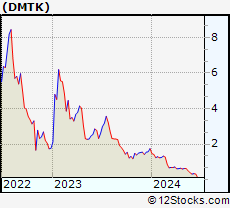 | DMTK DermTech, Inc. |
| Sector: Health Care | |
| SubSector: Medical Appliances & Equipment | |
| MarketCap: 144.08 Millions | |
| Recent Price: 0.50 Smart Investing & Trading Score: 0 | |
| Day Percent Change: -12.54% Day Change: -0.07 | |
| Week Change: -20.04% Year-to-date Change: -71.5% | |
| DMTK Links: Profile News Message Board | |
| Charts:- Daily , Weekly | |
| Add DMTK to Watchlist: View: Get Complete DMTK Trend Analysis ➞ | |
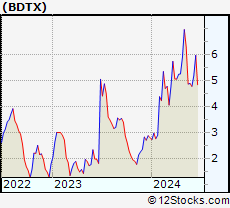 | BDTX Black Diamond Therapeutics, Inc. |
| Sector: Health Care | |
| SubSector: Biotechnology | |
| MarketCap: 12587 Millions | |
| Recent Price: 4.87 Smart Investing & Trading Score: 0 | |
| Day Percent Change: -7.06% Day Change: -0.37 | |
| Week Change: -22.7% Year-to-date Change: 73.3% | |
| BDTX Links: Profile News Message Board | |
| Charts:- Daily , Weekly | |
| Add BDTX to Watchlist: View: Get Complete BDTX Trend Analysis ➞ | |
| For tabular summary view of above stock list: Summary View ➞ 0 - 25 , 25 - 50 , 50 - 75 , 75 - 100 , 100 - 125 , 125 - 150 , 150 - 175 , 175 - 200 , 200 - 225 , 225 - 250 , 250 - 275 , 275 - 300 , 300 - 325 , 325 - 350 , 350 - 375 , 375 - 400 , 400 - 425 , 425 - 450 , 450 - 475 , 475 - 500 , 500 - 525 , 525 - 550 , 550 - 575 , 575 - 600 , 600 - 625 , 625 - 650 , 650 - 675 , 675 - 700 , 700 - 725 | ||
| Click To Change The Sort Order: By Market Cap or Company Size Performance: Year-to-date, Week and Day | |
| Select Chart Type: | ||
|
Best Stocks Today 12Stocks.com |
© 2024 12Stocks.com Terms & Conditions Privacy Contact Us
All Information Provided Only For Education And Not To Be Used For Investing or Trading. See Terms & Conditions


One More Thing ... Get Best Stocks Delivered Daily!
Never Ever Miss A Move With Our Top Ten Stocks Lists
Find Best Stocks In Any Market - Bull or Bear Market
Take A Peek At Our Top Ten Stocks Lists: Daily, Weekly, Year-to-Date & Top Trends
Find Best Stocks In Any Market - Bull or Bear Market
Take A Peek At Our Top Ten Stocks Lists: Daily, Weekly, Year-to-Date & Top Trends
Healthcare Stocks With Best Up Trends [0-bearish to 100-bullish]: Nurix [100], Wave Life[100], Innate Pharma[100], Inventiva S.A[100], Harrow Health[100], Arbutus Biopharma[100], Avidity Biosciences[100], Integer [100], Quest Diagnostics[100], BeiGene [100], Zura Bio[100]
Best Healthcare Stocks Year-to-Date:
Pieris [6081.32%], Precision BioSciences[3297.26%], Inovio [2252.94%], Avenue [2216.77%], Assembly Biosciences[1671.74%], Aurora Cannabis[1449.77%], Agenus [1211.75%], NuCana [1106.9%], Adverum Biotechnologies[962.7%], Burning Rock[760.19%], Affimed N.V[738.4%] Best Healthcare Stocks This Week:
Burning Rock[946.66%], Vaxxinity [58.82%], Novavax [46.51%], Vicarious Surgical[45.62%], Harrow Health[44.48%], ProKidney [44.31%], Acutus [43.9%], Annovis Bio[40.13%], InflaRx N.V[38.14%], AC Immune[37.66%], Vaxart [36%] Best Healthcare Stocks Daily:
Vaxxinity [45.95%], Acutus [31.11%], Vicarious Surgical[27.93%], Doximity [18.07%], Orchestra BioMed[12.77%], InflaRx N.V[12.41%], Fortress Biotech[9.66%], Tenaya [9.65%], Sharecare [9.12%], AirSculpt Technologies[7.87%], Autolus [7.86%]