
 Login Sign Up


| |||||
 |  | ||||

| 12Stocks.com Market Intelligence |
Best Healthcare Stocks
 | "Discover best trending healthcare stocks with 12Stocks.com." |
| - Subu Vdaygiri, Founder, 12Stocks.com |
| In a hurry? Healthcare Stocks Lists: Performance Trends Table, Stock Charts
Sort Healthcare stocks: Daily, Weekly, Year-to-Date, Market Cap & Trends. Filter Healthcare stocks list by size:All Healthcare Large Mid-Range Small |
| 12Stocks.com Healthcare Stocks Performances & Trends Daily | |||||||||
|
|  The overall Smart Investing & Trading Score is 88 (0-bearish to 100-bullish) which puts Healthcare sector in short term bullish trend. The Smart Investing & Trading Score from previous trading session is 95 and hence a deterioration of trend.
| ||||||||
Here are the Smart Investing & Trading Scores of the most requested Healthcare stocks at 12Stocks.com (click stock name for detailed review):
|


| 12Stocks.com: Investing in Healthcare sector with Stocks | |
|
The following table helps investors and traders sort through current performance and trends (as measured by Smart Investing & Trading Score) of various
stocks in the Healthcare sector. Quick View: Move mouse or cursor over stock symbol (ticker) to view short-term Technical chart and over stock name to view long term chart. Click on  to add stock symbol to your watchlist and to add stock symbol to your watchlist and  to view watchlist. Click on any ticker or stock name for detailed market intelligence report for that stock. to view watchlist. Click on any ticker or stock name for detailed market intelligence report for that stock. |
12Stocks.com Performance of Stocks in Healthcare Sector
| Ticker | Stock Name | Watchlist | Category | Recent Price | Smart Investing & Trading Score | Change % | Weekly Change% |
| ALVR | AlloVir |   | Biotechnology | 0.78 | 59 | 3.19% | -1.29% |
| RDY | Dr. Reddy | | Pharmaceutical | 68.26 | 0 | -1.50% | -1.32% |
| MRUS | Merus N.V | | Biotechnology | 43.91 | 0 | -2.47% | -1.37% |
| LGND | Ligand | | Biotechnology | 86.06 | 90 | 1.22% | -1.40% |
| FDMT | 4D Molecular | | Biotechnology | 25.34 | 22 | -1.17% | -1.40% |
| BPMC | Blueprint Medicines | | Biotechnology | 104.96 | 76 | -1.58% | -1.63% |
| VCEL | Vericel | | Biotechnology | 47.31 | 48 | -0.63% | -1.63% |
| IDYA | IDEAYA Biosciences | | Biotechnology | 40.50 | 32 | -2.48% | -1.63% |
| GHRS | GH Research | | Biotechnology | 12.60 | 63 | -1.02% | -1.64% |
| BHC | Bausch Health | | Delivery | 6.77 | 10 | -4.24% | -1.67% |
| SAGE | Sage | | Biotechnology | 11.70 | 15 | -2.58% | -1.68% |
| CHE | Chemed | | Home Care | 565.52 | 28 | -0.50% | -1.69% |
| IMAB | I Mab | | Biotechnology | 1.75 | 5 | -1.13% | -1.69% |
| AIRS | AirSculpt Technologies | | Medical Care Facilities | 4.66 | 32 | 7.87% | -1.69% |
| OMER | Omeros | | Biotechnology | 3.45 | 32 | 4.23% | -1.71% |
| DERM | Dermira | | Biotechnology | 3.45 | 32 | -4.70% | -1.71% |
| CUE | Cue Biopharma | | Biotechnology | 1.71 | 50 | -1.72% | -1.72% |
| CODX | Co-Diagnostics | | Laboratories | 1.09 | 10 | -4.39% | -1.80% |
| GLMD | Galmed | | Biotechnology | 0.39 | 39 | 0.26% | -1.83% |
| GEHC | GE | | Health Information | 81.86 | 32 | 0.68% | -1.85% |
| RCKT | Rocket | | Biotechnology | 22.62 | 25 | -3.33% | -1.91% |
| XENE | Xenon | | Biotechnology | 39.76 | 0 | -1.38% | -1.92% |
| APLS | Apellis | | Biotechnology | 41.31 | 25 | -1.64% | -1.96% |
| MOH | Molina | | Insurance | 347.62 | 52 | 0.76% | -1.97% |
| IMUX | Immunic | | Biotechnology | 1.25 | 20 | -0.40% | -1.97% |
| For chart view version of above stock list: Chart View ➞ 0 - 25 , 25 - 50 , 50 - 75 , 75 - 100 , 100 - 125 , 125 - 150 , 150 - 175 , 175 - 200 , 200 - 225 , 225 - 250 , 250 - 275 , 275 - 300 , 300 - 325 , 325 - 350 , 350 - 375 , 375 - 400 , 400 - 425 , 425 - 450 , 450 - 475 , 475 - 500 , 500 - 525 , 525 - 550 , 550 - 575 , 575 - 600 , 600 - 625 , 625 - 650 , 650 - 675 , 675 - 700 , 700 - 725 | ||
 | Click To Change The Sort Order: By Market Cap or Company Size Performance: Year-to-date, Week and Day |  |
|
Get the most comprehensive stock market coverage daily at 12Stocks.com ➞ Best Stocks Today ➞ Best Stocks Weekly ➞ Best Stocks Year-to-Date ➞ Best Stocks Trends ➞  Best Stocks Today 12Stocks.com Best Nasdaq Stocks ➞ Best S&P 500 Stocks ➞ Best Tech Stocks ➞ Best Biotech Stocks ➞ |
| Detailed Overview of Healthcare Stocks |
| Healthcare Technical Overview, Leaders & Laggards, Top Healthcare ETF Funds & Detailed Healthcare Stocks List, Charts, Trends & More |
| Healthcare Sector: Technical Analysis, Trends & YTD Performance | |
| Healthcare sector is composed of stocks
from pharmaceutical, biotech, diagnostics labs, insurance providers
and healthcare services. Healthcare sector, as represented by XLV, an exchange-traded fund [ETF] that holds basket of Healthcare stocks (e.g, Merck, Amgen) is up by 7.28% and is currently underperforming the overall market by -3.29% year-to-date. Below is a quick view of Technical charts and trends: |
|
 XLV Weekly Chart |
|
| Long Term Trend: Very Good | |
| Medium Term Trend: Very Good | |
 XLV Daily Chart |
|
| Short Term Trend: Good | |
| Overall Trend Score: 88 | |
| YTD Performance: 7.28% | |
| **Trend Scores & Views Are Only For Educational Purposes And Not For Investing | |
| 12Stocks.com: Top Performing Healthcare Sector Stocks | ||||||||||||||||||||||||||||||||||||||||||||||||
 The top performing Healthcare sector stocks year to date are
Now, more recently, over last week, the top performing Healthcare sector stocks on the move are


|
||||||||||||||||||||||||||||||||||||||||||||||||
| 12Stocks.com: Investing in Healthcare Sector using Exchange Traded Funds | |
|
The following table shows list of key exchange traded funds (ETF) that
help investors track Healthcare Index. For detailed view, check out our ETF Funds section of our website. Quick View: Move mouse or cursor over ETF symbol (ticker) to view short-term Technical chart and over ETF name to view long term chart. Click on ticker or stock name for detailed view. Click on to add stock symbol to your watchlist and to view watchlist. |
12Stocks.com List of ETFs that track Healthcare Index
| Ticker | ETF Name | Watchlist | Recent Price | Smart Investing & Trading Score | Change % | Week % | Year-to-date % |
| XLV | Health Care | | 146.31 | 88 | 0.19 | 1.89 | 7.28% |
| XBI | Biotech | | 91.18 | 45 | -0.91 | 3.45 | 2.12% |
| IBB | Biotechnology | | 136.69 | 70 | -0.44 | 2.47 | 0.62% |
| BBH | Biotech | | 167.99 | 83 | -0.43 | 2.4 | 1.62% |
| VHT | Health Care | | 267.11 | 75 | 0.00 | 1.88 | 6.55% |
| IYH | Healthcare | | 61.34 | 75 | 0.08 | 1.78 | 7.15% |
| IHF | Healthcare Providers | | 53.91 | 88 | 0.50 | 1.45 | 2.67% |
| IHI | Medical Devices | | 56.69 | 70 | -0.27 | 1.54 | 5.04% |
| BIB | Biotechnology | | 56.96 | 57 | -0.99 | 4.57 | -0.16% |
| BIS | Short Biotech | | 17.59 | 30 | 1.13 | -3.93 | -2.66% |
| XHE | Health Care Equipment | | 87.45 | 88 | -0.30 | 2.45 | 3.79% |
| CURE | Healthcare Bull 3X | | 119.10 | 82 | 0.46 | 5.46 | 17.06% |
| LABU | Biotech Bull 3X | | 111.79 | 47 | -2.79 | 10 | -8.35% |
| LABD | Biotech Bear 3X | | 7.95 | 53 | 2.71 | -9.86 | -17.96% |
| PSCH | SmallCap Health Care | | 43.40 | 71 | -0.31 | 0.99 | 1.39% |
| XHS | Health Care Services | | 91.55 | 76 | -0.22 | 2.24 | 2.92% |
| PTH | DWA Healthcare Momentum | | 42.63 | 52 | -0.46 | 2.03 | 8.92% |
| BTEC | Principal Healthcare Innovators | | 36.48 | 45 | -1.25 | 0.84 | 0.41% |
| RXL | Health Care | | 102.76 | 75 | 0.12 | 3.46 | 12.42% |
| RXD | Short Health Care | | 10.56 | 10 | 0.10 | -3.36 | -11.43% |
| 12Stocks.com: Charts, Trends, Fundamental Data and Performances of Healthcare Stocks | |
|
We now take in-depth look at all Healthcare stocks including charts, multi-period performances and overall trends (as measured by Smart Investing & Trading Score). One can sort Healthcare stocks (click link to choose) by Daily, Weekly and by Year-to-Date performances. Also, one can sort by size of the company or by market capitalization. |
| Select Your Default Chart Type: | |||||
| |||||
| Click on stock symbol or name for detailed view. Click on to add stock symbol to your watchlist and to view watchlist. Quick View: Move mouse or cursor over "Daily" to quickly view daily Technical stock chart and over "Weekly" to view weekly Technical stock chart. | |||||

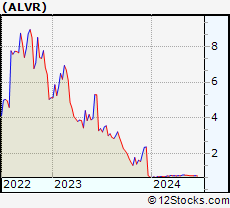 | ALVR AlloVir, Inc. |
| Sector: Health Care | |
| SubSector: Biotechnology | |
| MarketCap: 25787 Millions | |
| Recent Price: 0.78 Smart Investing & Trading Score: 59 | |
| Day Percent Change: 3.19% Day Change: 0.02 | |
| Week Change: -1.29% Year-to-date Change: 14.1% | |
| ALVR Links: Profile News Message Board | |
| Charts:- Daily , Weekly | |
| Add ALVR to Watchlist: View: Get Complete ALVR Trend Analysis ➞ | |
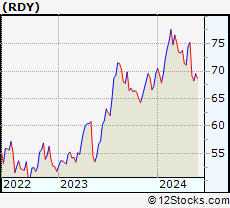 | RDY Dr. Reddy s Laboratories Limited |
| Sector: Health Care | |
| SubSector: Drug Manufacturers - Other | |
| MarketCap: 6590.23 Millions | |
| Recent Price: 68.26 Smart Investing & Trading Score: 0 | |
| Day Percent Change: -1.50% Day Change: -1.04 | |
| Week Change: -1.32% Year-to-date Change: -1.9% | |
| RDY Links: Profile News Message Board | |
| Charts:- Daily , Weekly | |
| Add RDY to Watchlist: View: Get Complete RDY Trend Analysis ➞ | |
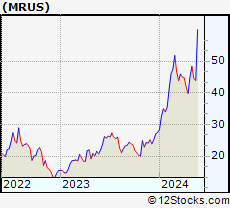 | MRUS Merus N.V. |
| Sector: Health Care | |
| SubSector: Biotechnology | |
| MarketCap: 417.385 Millions | |
| Recent Price: 43.91 Smart Investing & Trading Score: 0 | |
| Day Percent Change: -2.47% Day Change: -1.11 | |
| Week Change: -1.37% Year-to-date Change: 59.7% | |
| MRUS Links: Profile News Message Board | |
| Charts:- Daily , Weekly | |
| Add MRUS to Watchlist: View: Get Complete MRUS Trend Analysis ➞ | |
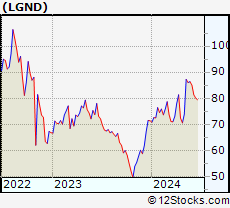 | LGND Ligand Pharmaceuticals Incorporated |
| Sector: Health Care | |
| SubSector: Biotechnology | |
| MarketCap: 1344.45 Millions | |
| Recent Price: 86.06 Smart Investing & Trading Score: 90 | |
| Day Percent Change: 1.22% Day Change: 1.04 | |
| Week Change: -1.4% Year-to-date Change: 20.5% | |
| LGND Links: Profile News Message Board | |
| Charts:- Daily , Weekly | |
| Add LGND to Watchlist: View: Get Complete LGND Trend Analysis ➞ | |
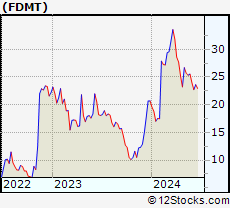 | FDMT 4D Molecular Therapeutics, Inc. |
| Sector: Health Care | |
| SubSector: Biotechnology | |
| MarketCap: 772 Millions | |
| Recent Price: 25.34 Smart Investing & Trading Score: 22 | |
| Day Percent Change: -1.17% Day Change: -0.30 | |
| Week Change: -1.4% Year-to-date Change: 22.4% | |
| FDMT Links: Profile News Message Board | |
| Charts:- Daily , Weekly | |
| Add FDMT to Watchlist: View: Get Complete FDMT Trend Analysis ➞ | |
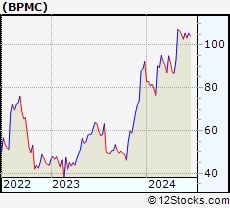 | BPMC Blueprint Medicines Corporation |
| Sector: Health Care | |
| SubSector: Biotechnology | |
| MarketCap: 3113.55 Millions | |
| Recent Price: 104.96 Smart Investing & Trading Score: 76 | |
| Day Percent Change: -1.58% Day Change: -1.68 | |
| Week Change: -1.63% Year-to-date Change: 13.8% | |
| BPMC Links: Profile News Message Board | |
| Charts:- Daily , Weekly | |
| Add BPMC to Watchlist: View: Get Complete BPMC Trend Analysis ➞ | |
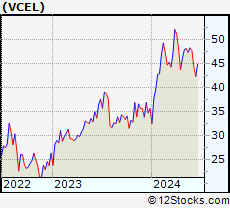 | VCEL Vericel Corporation |
| Sector: Health Care | |
| SubSector: Biotechnology | |
| MarketCap: 391.885 Millions | |
| Recent Price: 47.31 Smart Investing & Trading Score: 48 | |
| Day Percent Change: -0.63% Day Change: -0.30 | |
| Week Change: -1.63% Year-to-date Change: 32.9% | |
| VCEL Links: Profile News Message Board | |
| Charts:- Daily , Weekly | |
| Add VCEL to Watchlist: View: Get Complete VCEL Trend Analysis ➞ | |
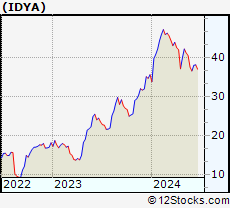 | IDYA IDEAYA Biosciences, Inc. |
| Sector: Health Care | |
| SubSector: Biotechnology | |
| MarketCap: 89.1785 Millions | |
| Recent Price: 40.50 Smart Investing & Trading Score: 32 | |
| Day Percent Change: -2.48% Day Change: -1.03 | |
| Week Change: -1.63% Year-to-date Change: 13.8% | |
| IDYA Links: Profile News Message Board | |
| Charts:- Daily , Weekly | |
| Add IDYA to Watchlist: View: Get Complete IDYA Trend Analysis ➞ | |
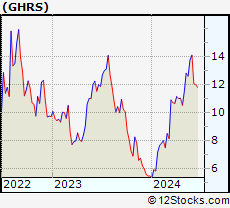 | GHRS GH Research PLC |
| Sector: Health Care | |
| SubSector: Biotechnology | |
| MarketCap: 614 Millions | |
| Recent Price: 12.60 Smart Investing & Trading Score: 63 | |
| Day Percent Change: -1.02% Day Change: -0.13 | |
| Week Change: -1.64% Year-to-date Change: 129.9% | |
| GHRS Links: Profile News Message Board | |
| Charts:- Daily , Weekly | |
| Add GHRS to Watchlist: View: Get Complete GHRS Trend Analysis ➞ | |
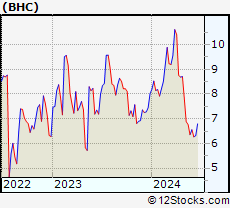 | BHC Bausch Health Companies Inc. |
| Sector: Health Care | |
| SubSector: Drug Delivery | |
| MarketCap: 5485.3 Millions | |
| Recent Price: 6.77 Smart Investing & Trading Score: 10 | |
| Day Percent Change: -4.24% Day Change: -0.30 | |
| Week Change: -1.67% Year-to-date Change: -15.6% | |
| BHC Links: Profile News Message Board | |
| Charts:- Daily , Weekly | |
| Add BHC to Watchlist: View: Get Complete BHC Trend Analysis ➞ | |
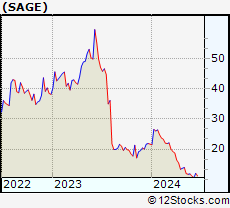 | SAGE Sage Therapeutics, Inc. |
| Sector: Health Care | |
| SubSector: Biotechnology | |
| MarketCap: 1683.75 Millions | |
| Recent Price: 11.70 Smart Investing & Trading Score: 15 | |
| Day Percent Change: -2.58% Day Change: -0.31 | |
| Week Change: -1.68% Year-to-date Change: -46.0% | |
| SAGE Links: Profile News Message Board | |
| Charts:- Daily , Weekly | |
| Add SAGE to Watchlist: View: Get Complete SAGE Trend Analysis ➞ | |
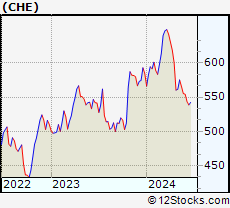 | CHE Chemed Corporation |
| Sector: Health Care | |
| SubSector: Home Health Care | |
| MarketCap: 6148.95 Millions | |
| Recent Price: 565.52 Smart Investing & Trading Score: 28 | |
| Day Percent Change: -0.50% Day Change: -2.85 | |
| Week Change: -1.69% Year-to-date Change: -3.3% | |
| CHE Links: Profile News Message Board | |
| Charts:- Daily , Weekly | |
| Add CHE to Watchlist: View: Get Complete CHE Trend Analysis ➞ | |
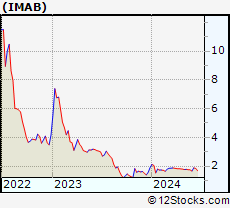 | IMAB I Mab |
| Sector: Health Care | |
| SubSector: Biotechnology | |
| MarketCap: 26187 Millions | |
| Recent Price: 1.75 Smart Investing & Trading Score: 5 | |
| Day Percent Change: -1.13% Day Change: -0.02 | |
| Week Change: -1.69% Year-to-date Change: -7.9% | |
| IMAB Links: Profile News Message Board | |
| Charts:- Daily , Weekly | |
| Add IMAB to Watchlist: View: Get Complete IMAB Trend Analysis ➞ | |
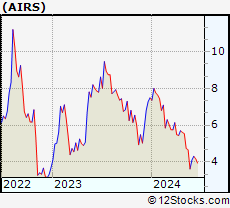 | AIRS AirSculpt Technologies, Inc. |
| Sector: Health Care | |
| SubSector: Medical Care Facilities | |
| MarketCap: 497 Millions | |
| Recent Price: 4.66 Smart Investing & Trading Score: 32 | |
| Day Percent Change: 7.87% Day Change: 0.34 | |
| Week Change: -1.69% Year-to-date Change: -37.8% | |
| AIRS Links: Profile News Message Board | |
| Charts:- Daily , Weekly | |
| Add AIRS to Watchlist: View: Get Complete AIRS Trend Analysis ➞ | |
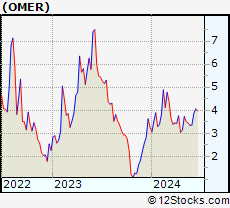 | OMER Omeros Corporation |
| Sector: Health Care | |
| SubSector: Biotechnology | |
| MarketCap: 759.585 Millions | |
| Recent Price: 3.45 Smart Investing & Trading Score: 32 | |
| Day Percent Change: 4.23% Day Change: 0.14 | |
| Week Change: -1.71% Year-to-date Change: 5.5% | |
| OMER Links: Profile News Message Board | |
| Charts:- Daily , Weekly | |
| Add OMER to Watchlist: View: Get Complete OMER Trend Analysis ➞ | |
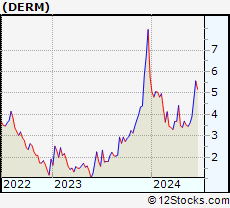 | DERM Dermira, Inc. |
| Sector: Health Care | |
| SubSector: Biotechnology | |
| MarketCap: 1312.25 Millions | |
| Recent Price: 3.45 Smart Investing & Trading Score: 32 | |
| Day Percent Change: -4.70% Day Change: -0.17 | |
| Week Change: -1.71% Year-to-date Change: -40.1% | |
| DERM Links: Profile News Message Board | |
| Charts:- Daily , Weekly | |
| Add DERM to Watchlist: View: Get Complete DERM Trend Analysis ➞ | |
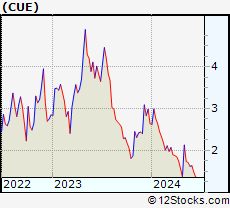 | CUE Cue Biopharma, Inc. |
| Sector: Health Care | |
| SubSector: Biotechnology | |
| MarketCap: 352.785 Millions | |
| Recent Price: 1.71 Smart Investing & Trading Score: 50 | |
| Day Percent Change: -1.72% Day Change: -0.03 | |
| Week Change: -1.72% Year-to-date Change: -35.2% | |
| CUE Links: Profile News Message Board | |
| Charts:- Daily , Weekly | |
| Add CUE to Watchlist: View: Get Complete CUE Trend Analysis ➞ | |
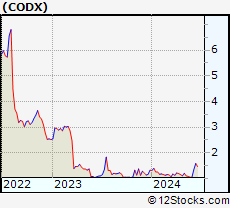 | CODX Co-Diagnostics, Inc. |
| Sector: Health Care | |
| SubSector: Medical Laboratories & Research | |
| MarketCap: 297.5 Millions | |
| Recent Price: 1.09 Smart Investing & Trading Score: 10 | |
| Day Percent Change: -4.39% Day Change: -0.05 | |
| Week Change: -1.8% Year-to-date Change: -18.1% | |
| CODX Links: Profile News Message Board | |
| Charts:- Daily , Weekly | |
| Add CODX to Watchlist: View: Get Complete CODX Trend Analysis ➞ | |
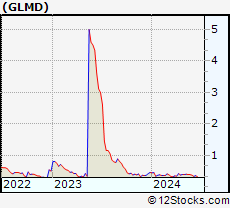 | GLMD Galmed Pharmaceuticals Ltd. |
| Sector: Health Care | |
| SubSector: Biotechnology | |
| MarketCap: 93.8785 Millions | |
| Recent Price: 0.39 Smart Investing & Trading Score: 39 | |
| Day Percent Change: 0.26% Day Change: 0.00 | |
| Week Change: -1.83% Year-to-date Change: -14.1% | |
| GLMD Links: Profile News Message Board | |
| Charts:- Daily , Weekly | |
| Add GLMD to Watchlist: View: Get Complete GLMD Trend Analysis ➞ | |
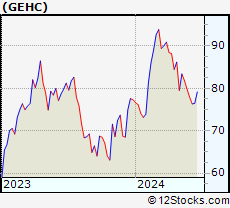 | GEHC GE HealthCare Technologies Inc. |
| Sector: Health Care | |
| SubSector: Health Information Services | |
| MarketCap: 36240 Millions | |
| Recent Price: 81.86 Smart Investing & Trading Score: 32 | |
| Day Percent Change: 0.68% Day Change: 0.55 | |
| Week Change: -1.85% Year-to-date Change: 5.8% | |
| GEHC Links: Profile News Message Board | |
| Charts:- Daily , Weekly | |
| Add GEHC to Watchlist: View: Get Complete GEHC Trend Analysis ➞ | |
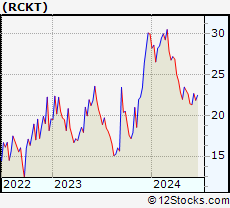 | RCKT Rocket Pharmaceuticals, Inc. |
| Sector: Health Care | |
| SubSector: Biotechnology | |
| MarketCap: 899.585 Millions | |
| Recent Price: 22.62 Smart Investing & Trading Score: 25 | |
| Day Percent Change: -3.33% Day Change: -0.78 | |
| Week Change: -1.91% Year-to-date Change: -24.5% | |
| RCKT Links: Profile News Message Board | |
| Charts:- Daily , Weekly | |
| Add RCKT to Watchlist: View: Get Complete RCKT Trend Analysis ➞ | |
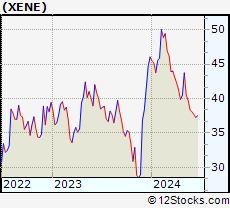 | XENE Xenon Pharmaceuticals Inc. |
| Sector: Health Care | |
| SubSector: Biotechnology | |
| MarketCap: 388.585 Millions | |
| Recent Price: 39.76 Smart Investing & Trading Score: 0 | |
| Day Percent Change: -1.38% Day Change: -0.55 | |
| Week Change: -1.92% Year-to-date Change: -13.7% | |
| XENE Links: Profile News Message Board | |
| Charts:- Daily , Weekly | |
| Add XENE to Watchlist: View: Get Complete XENE Trend Analysis ➞ | |
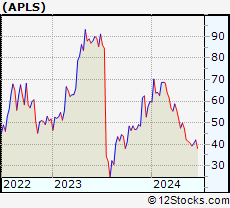 | APLS Apellis Pharmaceuticals, Inc. |
| Sector: Health Care | |
| SubSector: Biotechnology | |
| MarketCap: 2030.95 Millions | |
| Recent Price: 41.31 Smart Investing & Trading Score: 25 | |
| Day Percent Change: -1.64% Day Change: -0.69 | |
| Week Change: -1.96% Year-to-date Change: -31.0% | |
| APLS Links: Profile News Message Board | |
| Charts:- Daily , Weekly | |
| Add APLS to Watchlist: View: Get Complete APLS Trend Analysis ➞ | |
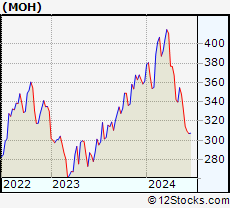 | MOH Molina Healthcare, Inc. |
| Sector: Health Care | |
| SubSector: Health Care Plans | |
| MarketCap: 7235.6 Millions | |
| Recent Price: 347.62 Smart Investing & Trading Score: 52 | |
| Day Percent Change: 0.76% Day Change: 2.62 | |
| Week Change: -1.97% Year-to-date Change: -3.8% | |
| MOH Links: Profile News Message Board | |
| Charts:- Daily , Weekly | |
| Add MOH to Watchlist: View: Get Complete MOH Trend Analysis ➞ | |
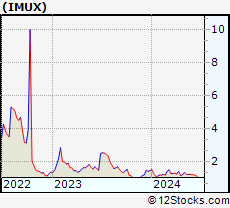 | IMUX Immunic, Inc. |
| Sector: Health Care | |
| SubSector: Biotechnology | |
| MarketCap: 57.1785 Millions | |
| Recent Price: 1.25 Smart Investing & Trading Score: 20 | |
| Day Percent Change: -0.40% Day Change: 0.00 | |
| Week Change: -1.97% Year-to-date Change: -16.4% | |
| IMUX Links: Profile News Message Board | |
| Charts:- Daily , Weekly | |
| Add IMUX to Watchlist: View: Get Complete IMUX Trend Analysis ➞ | |
| For tabular summary view of above stock list: Summary View ➞ 0 - 25 , 25 - 50 , 50 - 75 , 75 - 100 , 100 - 125 , 125 - 150 , 150 - 175 , 175 - 200 , 200 - 225 , 225 - 250 , 250 - 275 , 275 - 300 , 300 - 325 , 325 - 350 , 350 - 375 , 375 - 400 , 400 - 425 , 425 - 450 , 450 - 475 , 475 - 500 , 500 - 525 , 525 - 550 , 550 - 575 , 575 - 600 , 600 - 625 , 625 - 650 , 650 - 675 , 675 - 700 , 700 - 725 | ||
| Click To Change The Sort Order: By Market Cap or Company Size Performance: Year-to-date, Week and Day | |
| Select Chart Type: | ||
|
Best Stocks Today 12Stocks.com |
© 2024 12Stocks.com Terms & Conditions Privacy Contact Us
All Information Provided Only For Education And Not To Be Used For Investing or Trading. See Terms & Conditions


One More Thing ... Get Best Stocks Delivered Daily!
Never Ever Miss A Move With Our Top Ten Stocks Lists
Find Best Stocks In Any Market - Bull or Bear Market
Take A Peek At Our Top Ten Stocks Lists: Daily, Weekly, Year-to-Date & Top Trends
Find Best Stocks In Any Market - Bull or Bear Market
Take A Peek At Our Top Ten Stocks Lists: Daily, Weekly, Year-to-Date & Top Trends
Healthcare Stocks With Best Up Trends [0-bearish to 100-bullish]: Nurix [100], Wave Life[100], Innate Pharma[100], Inventiva S.A[100], Harrow Health[100], Arbutus Biopharma[100], Avidity Biosciences[100], Integer [100], Quest Diagnostics[100], BeiGene [100], Zura Bio[100]
Best Healthcare Stocks Year-to-Date:
Pieris [6081.32%], Precision BioSciences[3297.26%], Inovio [2252.94%], Avenue [2216.77%], Assembly Biosciences[1671.74%], Aurora Cannabis[1449.77%], Agenus [1211.75%], NuCana [1106.9%], Adverum Biotechnologies[962.7%], Burning Rock[760.19%], Affimed N.V[738.4%] Best Healthcare Stocks This Week:
Burning Rock[946.66%], Vaxxinity [58.82%], Novavax [46.51%], Vicarious Surgical[45.62%], Harrow Health[44.48%], ProKidney [44.31%], Acutus [43.9%], Annovis Bio[40.13%], InflaRx N.V[38.14%], AC Immune[37.66%], Vaxart [36%] Best Healthcare Stocks Daily:
Vaxxinity [45.95%], Acutus [31.11%], Vicarious Surgical[27.93%], Doximity [18.07%], Orchestra BioMed[12.77%], InflaRx N.V[12.41%], Fortress Biotech[9.66%], Tenaya [9.65%], Sharecare [9.12%], AirSculpt Technologies[7.87%], Autolus [7.86%]