
 Login Sign Up


| |||||
 |  | ||||

| 12Stocks.com Market Intelligence |
Best Healthcare Stocks
 | "Discover best trending healthcare stocks with 12Stocks.com." |
| - Subu Vdaygiri, Founder, 12Stocks.com |
| In a hurry? Healthcare Stocks Lists: Performance Trends Table, Stock Charts
Sort Healthcare stocks: Daily, Weekly, Year-to-Date, Market Cap & Trends. Filter Healthcare stocks list by size:All Healthcare Large Mid-Range Small |
| 12Stocks.com Healthcare Stocks Performances & Trends Daily | |||||||||
|
|  The overall Smart Investing & Trading Score is 88 (0-bearish to 100-bullish) which puts Healthcare sector in short term bullish trend. The Smart Investing & Trading Score from previous trading session is 95 and hence a deterioration of trend.
| ||||||||
Here are the Smart Investing & Trading Scores of the most requested Healthcare stocks at 12Stocks.com (click stock name for detailed review):
|


| 12Stocks.com: Investing in Healthcare sector with Stocks | |
|
The following table helps investors and traders sort through current performance and trends (as measured by Smart Investing & Trading Score) of various
stocks in the Healthcare sector. Quick View: Move mouse or cursor over stock symbol (ticker) to view short-term Technical chart and over stock name to view long term chart. Click on  to add stock symbol to your watchlist and to add stock symbol to your watchlist and  to view watchlist. Click on any ticker or stock name for detailed market intelligence report for that stock. to view watchlist. Click on any ticker or stock name for detailed market intelligence report for that stock. |
12Stocks.com Performance of Stocks in Healthcare Sector
| Ticker | Stock Name | Watchlist | Category | Recent Price | Smart Investing & Trading Score | Change % | Weekly Change% |
| AIM | AIM ImmunoTech |   | Pharmaceutical | 0.40 | 37 | 3.33% | 0.75% |
| MRSN | Mersana | | Biotechnology | 2.73 | 32 | 5.81% | 0.74% |
| ALLO | Allogene | | Biotechnology | 2.77 | 5 | -7.97% | 0.73% |
| AQST | Aquestive | | Biotechnology | 3.11 | 10 | -5.18% | 0.65% |
| ARAY | Accuray | | Equipment | 1.63 | 35 | -2.40% | 0.62% |
| STE | STERIS | | Instruments | 232.69 | 55 | 0.85% | 0.59% |
| ARDX | Ardelyx | | Biotechnology | 7.81 | 40 | 0.26% | 0.51% |
| GNFT | Genfit SA | | Biotechnology | 3.76 | 78 | -1.08% | 0.51% |
| QDEL | Quidel | | Diagnostic | 42.82 | 42 | -2.66% | 0.49% |
| ILMN | Illumina | | Biotechnology | 111.07 | 7 | -2.96% | 0.49% |
| SUPN | Supernus | | Pharmaceutical | 29.10 | 18 | -0.21% | 0.48% |
| MRKR | Marker | | Biotechnology | 4.15 | 58 | 1.22% | 0.48% |
| REPL | Replimune | | Biotechnology | 6.44 | 30 | -4.17% | 0.47% |
| NVS | Novartis AG | | Pharmaceutical | 102.57 | 83 | -0.12% | 0.46% |
| ALKS | Alkermes | | Biotechnology | 24.15 | 24 | -1.27% | 0.42% |
| KNSA | Kiniksa | | Biotechnology | 19.77 | 40 | -1.69% | 0.41% |
| TMO | Thermo Fisher | | Laboratories | 595.30 | 76 | -0.31% | 0.38% |
| GRTS | Gritstone Oncology | | Biotechnology | 0.79 | 37 | 5.46% | 0.37% |
| CNC | Centene | | Insurance | 78.06 | 75 | 1.19% | 0.35% |
| SDGR | Schrodinger | | Health Information | 22.76 | 10 | -0.61% | 0.35% |
| DCPH | Deciphera | | Biotechnology | 25.46 | 75 | 0.04% | 0.33% |
| USPH | U.S. Physical | | Specialized | 106.72 | 63 | 0.44% | 0.31% |
| BDX | Becton Dickinson | | Instruments | 236.30 | 63 | -0.14% | 0.27% |
| NVST | Envista | | Instruments | 18.53 | 10 | -3.14% | 0.27% |
| GERN | Geron | | Biotechnology | 3.81 | 76 | -2.31% | 0.26% |
| For chart view version of above stock list: Chart View ➞ 0 - 25 , 25 - 50 , 50 - 75 , 75 - 100 , 100 - 125 , 125 - 150 , 150 - 175 , 175 - 200 , 200 - 225 , 225 - 250 , 250 - 275 , 275 - 300 , 300 - 325 , 325 - 350 , 350 - 375 , 375 - 400 , 400 - 425 , 425 - 450 , 450 - 475 , 475 - 500 , 500 - 525 , 525 - 550 , 550 - 575 , 575 - 600 , 600 - 625 , 625 - 650 , 650 - 675 , 675 - 700 , 700 - 725 | ||
 | Click To Change The Sort Order: By Market Cap or Company Size Performance: Year-to-date, Week and Day |  |
|
Get the most comprehensive stock market coverage daily at 12Stocks.com ➞ Best Stocks Today ➞ Best Stocks Weekly ➞ Best Stocks Year-to-Date ➞ Best Stocks Trends ➞  Best Stocks Today 12Stocks.com Best Nasdaq Stocks ➞ Best S&P 500 Stocks ➞ Best Tech Stocks ➞ Best Biotech Stocks ➞ |
| Detailed Overview of Healthcare Stocks |
| Healthcare Technical Overview, Leaders & Laggards, Top Healthcare ETF Funds & Detailed Healthcare Stocks List, Charts, Trends & More |
| Healthcare Sector: Technical Analysis, Trends & YTD Performance | |
| Healthcare sector is composed of stocks
from pharmaceutical, biotech, diagnostics labs, insurance providers
and healthcare services. Healthcare sector, as represented by XLV, an exchange-traded fund [ETF] that holds basket of Healthcare stocks (e.g, Merck, Amgen) is up by 7.28% and is currently underperforming the overall market by -3.29% year-to-date. Below is a quick view of Technical charts and trends: |
|
 XLV Weekly Chart |
|
| Long Term Trend: Very Good | |
| Medium Term Trend: Very Good | |
 XLV Daily Chart |
|
| Short Term Trend: Good | |
| Overall Trend Score: 88 | |
| YTD Performance: 7.28% | |
| **Trend Scores & Views Are Only For Educational Purposes And Not For Investing | |
| 12Stocks.com: Top Performing Healthcare Sector Stocks | ||||||||||||||||||||||||||||||||||||||||||||||||
 The top performing Healthcare sector stocks year to date are
Now, more recently, over last week, the top performing Healthcare sector stocks on the move are


|
||||||||||||||||||||||||||||||||||||||||||||||||
| 12Stocks.com: Investing in Healthcare Sector using Exchange Traded Funds | |
|
The following table shows list of key exchange traded funds (ETF) that
help investors track Healthcare Index. For detailed view, check out our ETF Funds section of our website. Quick View: Move mouse or cursor over ETF symbol (ticker) to view short-term Technical chart and over ETF name to view long term chart. Click on ticker or stock name for detailed view. Click on to add stock symbol to your watchlist and to view watchlist. |
12Stocks.com List of ETFs that track Healthcare Index
| Ticker | ETF Name | Watchlist | Recent Price | Smart Investing & Trading Score | Change % | Week % | Year-to-date % |
| XLV | Health Care | | 146.31 | 88 | 0.19 | 1.89 | 7.28% |
| XBI | Biotech | | 91.18 | 45 | -0.91 | 3.45 | 2.12% |
| IBB | Biotechnology | | 136.69 | 70 | -0.44 | 2.47 | 0.62% |
| BBH | Biotech | | 167.99 | 83 | -0.43 | 2.4 | 1.62% |
| VHT | Health Care | | 267.11 | 75 | 0.00 | 1.88 | 6.55% |
| IYH | Healthcare | | 61.34 | 75 | 0.08 | 1.78 | 7.15% |
| IHF | Healthcare Providers | | 53.91 | 88 | 0.50 | 1.45 | 2.67% |
| IHI | Medical Devices | | 56.69 | 70 | -0.27 | 1.54 | 5.04% |
| BIB | Biotechnology | | 56.96 | 57 | -0.99 | 4.57 | -0.16% |
| BIS | Short Biotech | | 17.59 | 30 | 1.13 | -3.93 | -2.66% |
| XHE | Health Care Equipment | | 87.45 | 88 | -0.30 | 2.45 | 3.79% |
| CURE | Healthcare Bull 3X | | 119.10 | 82 | 0.46 | 5.46 | 17.06% |
| LABU | Biotech Bull 3X | | 111.79 | 47 | -2.79 | 10 | -8.35% |
| LABD | Biotech Bear 3X | | 7.95 | 53 | 2.71 | -9.86 | -17.96% |
| PSCH | SmallCap Health Care | | 43.40 | 71 | -0.31 | 0.99 | 1.39% |
| XHS | Health Care Services | | 91.55 | 76 | -0.22 | 2.24 | 2.92% |
| PTH | DWA Healthcare Momentum | | 42.63 | 52 | -0.46 | 2.03 | 8.92% |
| BTEC | Principal Healthcare Innovators | | 36.48 | 45 | -1.25 | 0.84 | 0.41% |
| RXL | Health Care | | 102.76 | 75 | 0.12 | 3.46 | 12.42% |
| RXD | Short Health Care | | 10.56 | 10 | 0.10 | -3.36 | -11.43% |
| 12Stocks.com: Charts, Trends, Fundamental Data and Performances of Healthcare Stocks | |
|
We now take in-depth look at all Healthcare stocks including charts, multi-period performances and overall trends (as measured by Smart Investing & Trading Score). One can sort Healthcare stocks (click link to choose) by Daily, Weekly and by Year-to-Date performances. Also, one can sort by size of the company or by market capitalization. |
| Select Your Default Chart Type: | |||||
| |||||
| Click on stock symbol or name for detailed view. Click on to add stock symbol to your watchlist and to view watchlist. Quick View: Move mouse or cursor over "Daily" to quickly view daily Technical stock chart and over "Weekly" to view weekly Technical stock chart. | |||||

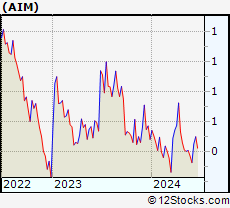 | AIM AIM ImmunoTech Inc. |
| Sector: Health Care | |
| SubSector: Drug Manufacturers - Other | |
| MarketCap: 61.4033 Millions | |
| Recent Price: 0.40 Smart Investing & Trading Score: 37 | |
| Day Percent Change: 3.33% Day Change: 0.01 | |
| Week Change: 0.75% Year-to-date Change: -8.4% | |
| AIM Links: Profile News Message Board | |
| Charts:- Daily , Weekly | |
| Add AIM to Watchlist: View: Get Complete AIM Trend Analysis ➞ | |
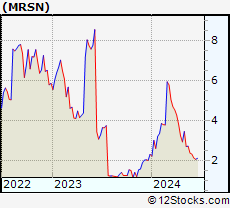 | MRSN Mersana Therapeutics, Inc. |
| Sector: Health Care | |
| SubSector: Biotechnology | |
| MarketCap: 224.385 Millions | |
| Recent Price: 2.73 Smart Investing & Trading Score: 32 | |
| Day Percent Change: 5.81% Day Change: 0.15 | |
| Week Change: 0.74% Year-to-date Change: 17.7% | |
| MRSN Links: Profile News Message Board | |
| Charts:- Daily , Weekly | |
| Add MRSN to Watchlist: View: Get Complete MRSN Trend Analysis ➞ | |
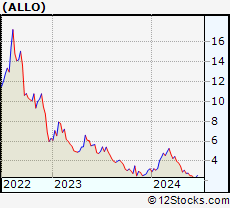 | ALLO Allogene Therapeutics, Inc. |
| Sector: Health Care | |
| SubSector: Biotechnology | |
| MarketCap: 2858.65 Millions | |
| Recent Price: 2.77 Smart Investing & Trading Score: 5 | |
| Day Percent Change: -7.97% Day Change: -0.24 | |
| Week Change: 0.73% Year-to-date Change: -13.7% | |
| ALLO Links: Profile News Message Board | |
| Charts:- Daily , Weekly | |
| Add ALLO to Watchlist: View: Get Complete ALLO Trend Analysis ➞ | |
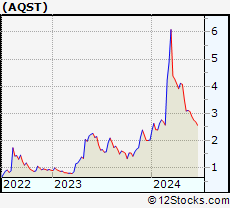 | AQST Aquestive Therapeutics, Inc. |
| Sector: Health Care | |
| SubSector: Biotechnology | |
| MarketCap: 94.2785 Millions | |
| Recent Price: 3.11 Smart Investing & Trading Score: 10 | |
| Day Percent Change: -5.18% Day Change: -0.17 | |
| Week Change: 0.65% Year-to-date Change: 54.0% | |
| AQST Links: Profile News Message Board | |
| Charts:- Daily , Weekly | |
| Add AQST to Watchlist: View: Get Complete AQST Trend Analysis ➞ | |
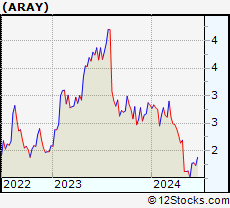 | ARAY Accuray Incorporated |
| Sector: Health Care | |
| SubSector: Medical Appliances & Equipment | |
| MarketCap: 169.58 Millions | |
| Recent Price: 1.63 Smart Investing & Trading Score: 35 | |
| Day Percent Change: -2.40% Day Change: -0.04 | |
| Week Change: 0.62% Year-to-date Change: -42.4% | |
| ARAY Links: Profile News Message Board | |
| Charts:- Daily , Weekly | |
| Add ARAY to Watchlist: View: Get Complete ARAY Trend Analysis ➞ | |
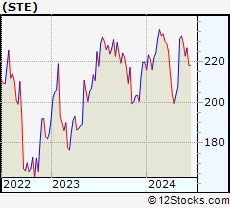 | STE STERIS plc |
| Sector: Health Care | |
| SubSector: Medical Instruments & Supplies | |
| MarketCap: 10875 Millions | |
| Recent Price: 232.69 Smart Investing & Trading Score: 55 | |
| Day Percent Change: 0.85% Day Change: 1.96 | |
| Week Change: 0.59% Year-to-date Change: 5.8% | |
| STE Links: Profile News Message Board | |
| Charts:- Daily , Weekly | |
| Add STE to Watchlist: View: Get Complete STE Trend Analysis ➞ | |
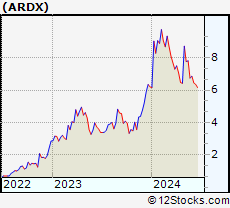 | ARDX Ardelyx, Inc. |
| Sector: Health Care | |
| SubSector: Biotechnology | |
| MarketCap: 541.985 Millions | |
| Recent Price: 7.81 Smart Investing & Trading Score: 40 | |
| Day Percent Change: 0.26% Day Change: 0.02 | |
| Week Change: 0.51% Year-to-date Change: 26.0% | |
| ARDX Links: Profile News Message Board | |
| Charts:- Daily , Weekly | |
| Add ARDX to Watchlist: View: Get Complete ARDX Trend Analysis ➞ | |
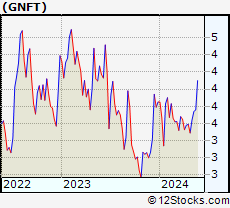 | GNFT Genfit SA |
| Sector: Health Care | |
| SubSector: Biotechnology | |
| MarketCap: 529.285 Millions | |
| Recent Price: 3.76 Smart Investing & Trading Score: 78 | |
| Day Percent Change: -1.08% Day Change: -0.04 | |
| Week Change: 0.51% Year-to-date Change: -2.4% | |
| GNFT Links: Profile News Message Board | |
| Charts:- Daily , Weekly | |
| Add GNFT to Watchlist: View: Get Complete GNFT Trend Analysis ➞ | |
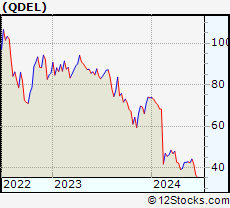 | QDEL Quidel Corporation |
| Sector: Health Care | |
| SubSector: Diagnostic Substances | |
| MarketCap: 4104.91 Millions | |
| Recent Price: 42.82 Smart Investing & Trading Score: 42 | |
| Day Percent Change: -2.66% Day Change: -1.17 | |
| Week Change: 0.49% Year-to-date Change: -41.9% | |
| QDEL Links: Profile News Message Board | |
| Charts:- Daily , Weekly | |
| Add QDEL to Watchlist: View: Get Complete QDEL Trend Analysis ➞ | |
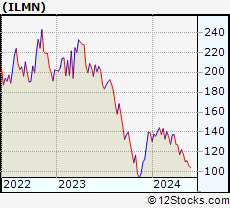 | ILMN Illumina, Inc. |
| Sector: Health Care | |
| SubSector: Biotechnology | |
| MarketCap: 39194.3 Millions | |
| Recent Price: 111.07 Smart Investing & Trading Score: 7 | |
| Day Percent Change: -2.96% Day Change: -3.39 | |
| Week Change: 0.49% Year-to-date Change: -20.2% | |
| ILMN Links: Profile News Message Board | |
| Charts:- Daily , Weekly | |
| Add ILMN to Watchlist: View: Get Complete ILMN Trend Analysis ➞ | |
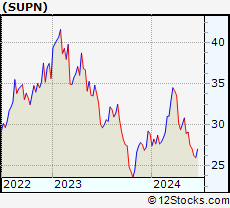 | SUPN Supernus Pharmaceuticals, Inc. |
| Sector: Health Care | |
| SubSector: Drugs - Generic | |
| MarketCap: 833.585 Millions | |
| Recent Price: 29.10 Smart Investing & Trading Score: 18 | |
| Day Percent Change: -0.21% Day Change: -0.06 | |
| Week Change: 0.48% Year-to-date Change: 0.6% | |
| SUPN Links: Profile News Message Board | |
| Charts:- Daily , Weekly | |
| Add SUPN to Watchlist: View: Get Complete SUPN Trend Analysis ➞ | |
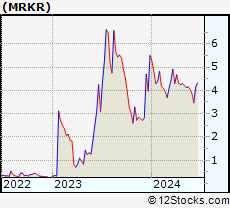 | MRKR Marker Therapeutics, Inc. |
| Sector: Health Care | |
| SubSector: Biotechnology | |
| MarketCap: 93.3785 Millions | |
| Recent Price: 4.15 Smart Investing & Trading Score: 58 | |
| Day Percent Change: 1.22% Day Change: 0.05 | |
| Week Change: 0.48% Year-to-date Change: -24.6% | |
| MRKR Links: Profile News Message Board | |
| Charts:- Daily , Weekly | |
| Add MRKR to Watchlist: View: Get Complete MRKR Trend Analysis ➞ | |
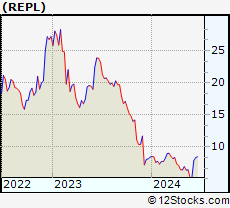 | REPL Replimune Group, Inc. |
| Sector: Health Care | |
| SubSector: Biotechnology | |
| MarketCap: 367.885 Millions | |
| Recent Price: 6.44 Smart Investing & Trading Score: 30 | |
| Day Percent Change: -4.17% Day Change: -0.28 | |
| Week Change: 0.47% Year-to-date Change: -23.6% | |
| REPL Links: Profile News Message Board | |
| Charts:- Daily , Weekly | |
| Add REPL to Watchlist: View: Get Complete REPL Trend Analysis ➞ | |
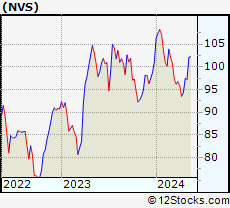 | NVS Novartis AG |
| Sector: Health Care | |
| SubSector: Drug Manufacturers - Major | |
| MarketCap: 203929 Millions | |
| Recent Price: 102.57 Smart Investing & Trading Score: 83 | |
| Day Percent Change: -0.12% Day Change: -0.12 | |
| Week Change: 0.46% Year-to-date Change: 1.6% | |
| NVS Links: Profile News Message Board | |
| Charts:- Daily , Weekly | |
| Add NVS to Watchlist: View: Get Complete NVS Trend Analysis ➞ | |
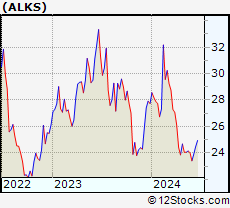 | ALKS Alkermes plc |
| Sector: Health Care | |
| SubSector: Biotechnology | |
| MarketCap: 2311.95 Millions | |
| Recent Price: 24.15 Smart Investing & Trading Score: 24 | |
| Day Percent Change: -1.27% Day Change: -0.31 | |
| Week Change: 0.42% Year-to-date Change: -12.9% | |
| ALKS Links: Profile News Message Board | |
| Charts:- Daily , Weekly | |
| Add ALKS to Watchlist: View: Get Complete ALKS Trend Analysis ➞ | |
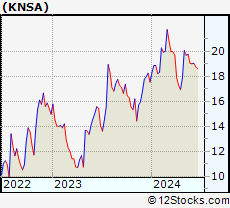 | KNSA Kiniksa Pharmaceuticals, Ltd. |
| Sector: Health Care | |
| SubSector: Biotechnology | |
| MarketCap: 780.285 Millions | |
| Recent Price: 19.77 Smart Investing & Trading Score: 40 | |
| Day Percent Change: -1.69% Day Change: -0.34 | |
| Week Change: 0.41% Year-to-date Change: 12.7% | |
| KNSA Links: Profile News Message Board | |
| Charts:- Daily , Weekly | |
| Add KNSA to Watchlist: View: Get Complete KNSA Trend Analysis ➞ | |
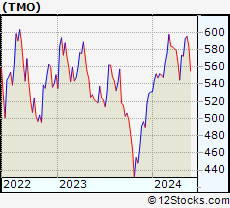 | TMO Thermo Fisher Scientific Inc. |
| Sector: Health Care | |
| SubSector: Medical Laboratories & Research | |
| MarketCap: 112999 Millions | |
| Recent Price: 595.30 Smart Investing & Trading Score: 76 | |
| Day Percent Change: -0.31% Day Change: -1.85 | |
| Week Change: 0.38% Year-to-date Change: 12.2% | |
| TMO Links: Profile News Message Board | |
| Charts:- Daily , Weekly | |
| Add TMO to Watchlist: View: Get Complete TMO Trend Analysis ➞ | |
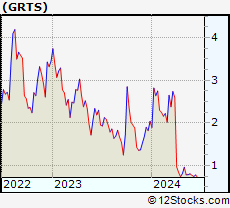 | GRTS Gritstone Oncology, Inc. |
| Sector: Health Care | |
| SubSector: Biotechnology | |
| MarketCap: 240.085 Millions | |
| Recent Price: 0.79 Smart Investing & Trading Score: 37 | |
| Day Percent Change: 5.46% Day Change: 0.04 | |
| Week Change: 0.37% Year-to-date Change: -61.4% | |
| GRTS Links: Profile News Message Board | |
| Charts:- Daily , Weekly | |
| Add GRTS to Watchlist: View: Get Complete GRTS Trend Analysis ➞ | |
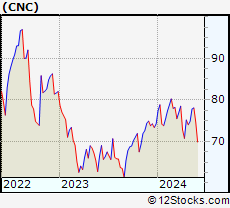 | CNC Centene Corporation |
| Sector: Health Care | |
| SubSector: Health Care Plans | |
| MarketCap: 29075 Millions | |
| Recent Price: 78.06 Smart Investing & Trading Score: 75 | |
| Day Percent Change: 1.19% Day Change: 0.92 | |
| Week Change: 0.35% Year-to-date Change: 5.2% | |
| CNC Links: Profile News Message Board | |
| Charts:- Daily , Weekly | |
| Add CNC to Watchlist: View: Get Complete CNC Trend Analysis ➞ | |
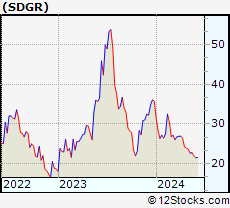 | SDGR Schrodinger, Inc. |
| Sector: Health Care | |
| SubSector: Health Information Services | |
| MarketCap: 47287 Millions | |
| Recent Price: 22.76 Smart Investing & Trading Score: 10 | |
| Day Percent Change: -0.61% Day Change: -0.14 | |
| Week Change: 0.35% Year-to-date Change: -36.4% | |
| SDGR Links: Profile News Message Board | |
| Charts:- Daily , Weekly | |
| Add SDGR to Watchlist: View: Get Complete SDGR Trend Analysis ➞ | |
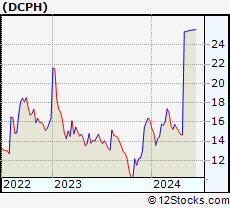 | DCPH Deciphera Pharmaceuticals, Inc. |
| Sector: Health Care | |
| SubSector: Biotechnology | |
| MarketCap: 2329.95 Millions | |
| Recent Price: 25.46 Smart Investing & Trading Score: 75 | |
| Day Percent Change: 0.04% Day Change: 0.01 | |
| Week Change: 0.33% Year-to-date Change: 57.8% | |
| DCPH Links: Profile News Message Board | |
| Charts:- Daily , Weekly | |
| Add DCPH to Watchlist: View: Get Complete DCPH Trend Analysis ➞ | |
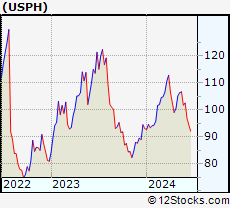 | USPH U.S. Physical Therapy, Inc. |
| Sector: Health Care | |
| SubSector: Specialized Health Services | |
| MarketCap: 793.556 Millions | |
| Recent Price: 106.72 Smart Investing & Trading Score: 63 | |
| Day Percent Change: 0.44% Day Change: 0.47 | |
| Week Change: 0.31% Year-to-date Change: 14.6% | |
| USPH Links: Profile News Message Board | |
| Charts:- Daily , Weekly | |
| Add USPH to Watchlist: View: Get Complete USPH Trend Analysis ➞ | |
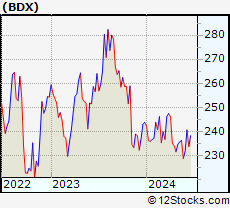 | BDX Becton, Dickinson and Company |
| Sector: Health Care | |
| SubSector: Medical Instruments & Supplies | |
| MarketCap: 62758.4 Millions | |
| Recent Price: 236.30 Smart Investing & Trading Score: 63 | |
| Day Percent Change: -0.14% Day Change: -0.32 | |
| Week Change: 0.27% Year-to-date Change: -3.1% | |
| BDX Links: Profile News Message Board | |
| Charts:- Daily , Weekly | |
| Add BDX to Watchlist: View: Get Complete BDX Trend Analysis ➞ | |
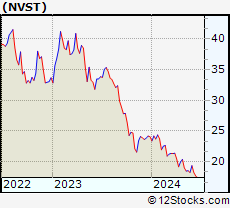 | NVST Envista Holdings Corporation |
| Sector: Health Care | |
| SubSector: Medical Instruments & Supplies | |
| MarketCap: 2075.8 Millions | |
| Recent Price: 18.53 Smart Investing & Trading Score: 10 | |
| Day Percent Change: -3.14% Day Change: -0.60 | |
| Week Change: 0.27% Year-to-date Change: -23.0% | |
| NVST Links: Profile News Message Board | |
| Charts:- Daily , Weekly | |
| Add NVST to Watchlist: View: Get Complete NVST Trend Analysis ➞ | |
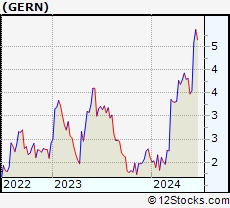 | GERN Geron Corporation |
| Sector: Health Care | |
| SubSector: Biotechnology | |
| MarketCap: 228.685 Millions | |
| Recent Price: 3.81 Smart Investing & Trading Score: 76 | |
| Day Percent Change: -2.31% Day Change: -0.09 | |
| Week Change: 0.26% Year-to-date Change: 80.6% | |
| GERN Links: Profile News Message Board | |
| Charts:- Daily , Weekly | |
| Add GERN to Watchlist: View: Get Complete GERN Trend Analysis ➞ | |
| For tabular summary view of above stock list: Summary View ➞ 0 - 25 , 25 - 50 , 50 - 75 , 75 - 100 , 100 - 125 , 125 - 150 , 150 - 175 , 175 - 200 , 200 - 225 , 225 - 250 , 250 - 275 , 275 - 300 , 300 - 325 , 325 - 350 , 350 - 375 , 375 - 400 , 400 - 425 , 425 - 450 , 450 - 475 , 475 - 500 , 500 - 525 , 525 - 550 , 550 - 575 , 575 - 600 , 600 - 625 , 625 - 650 , 650 - 675 , 675 - 700 , 700 - 725 | ||
| Click To Change The Sort Order: By Market Cap or Company Size Performance: Year-to-date, Week and Day | |
| Select Chart Type: | ||
|
Best Stocks Today 12Stocks.com |
© 2024 12Stocks.com Terms & Conditions Privacy Contact Us
All Information Provided Only For Education And Not To Be Used For Investing or Trading. See Terms & Conditions


One More Thing ... Get Best Stocks Delivered Daily!
Never Ever Miss A Move With Our Top Ten Stocks Lists
Find Best Stocks In Any Market - Bull or Bear Market
Take A Peek At Our Top Ten Stocks Lists: Daily, Weekly, Year-to-Date & Top Trends
Find Best Stocks In Any Market - Bull or Bear Market
Take A Peek At Our Top Ten Stocks Lists: Daily, Weekly, Year-to-Date & Top Trends
Healthcare Stocks With Best Up Trends [0-bearish to 100-bullish]: Nurix [100], Wave Life[100], Innate Pharma[100], Inventiva S.A[100], Harrow Health[100], Arbutus Biopharma[100], Avidity Biosciences[100], Integer [100], Quest Diagnostics[100], BeiGene [100], Zura Bio[100]
Best Healthcare Stocks Year-to-Date:
Pieris [6081.32%], Precision BioSciences[3297.26%], Inovio [2252.94%], Avenue [2216.77%], Assembly Biosciences[1671.74%], Aurora Cannabis[1449.77%], Agenus [1211.75%], NuCana [1106.9%], Adverum Biotechnologies[962.7%], Burning Rock[760.19%], Affimed N.V[738.4%] Best Healthcare Stocks This Week:
Burning Rock[946.66%], Vaxxinity [58.82%], Novavax [46.51%], Vicarious Surgical[45.62%], Harrow Health[44.48%], ProKidney [44.31%], Acutus [43.9%], Annovis Bio[40.13%], InflaRx N.V[38.14%], AC Immune[37.66%], Vaxart [36%] Best Healthcare Stocks Daily:
Vaxxinity [45.95%], Acutus [31.11%], Vicarious Surgical[27.93%], Doximity [18.07%], Orchestra BioMed[12.77%], InflaRx N.V[12.41%], Fortress Biotech[9.66%], Tenaya [9.65%], Sharecare [9.12%], AirSculpt Technologies[7.87%], Autolus [7.86%]