
 Login Sign Up


| |||||
 |  | ||||

| 12Stocks.com Market Intelligence |
Best Healthcare Stocks
 | "Discover best trending healthcare stocks with 12Stocks.com." |
| - Subu Vdaygiri, Founder, 12Stocks.com |
| In a hurry? Healthcare Stocks Lists: Performance Trends Table, Stock Charts
Sort Healthcare stocks: Daily, Weekly, Year-to-Date, Market Cap & Trends. Filter Healthcare stocks list by size:All Healthcare Large Mid-Range Small |
| 12Stocks.com Healthcare Stocks Performances & Trends Daily | |||||||||
|
|  The overall Smart Investing & Trading Score is 88 (0-bearish to 100-bullish) which puts Healthcare sector in short term bullish trend. The Smart Investing & Trading Score from previous trading session is 95 and hence a deterioration of trend.
| ||||||||
Here are the Smart Investing & Trading Scores of the most requested Healthcare stocks at 12Stocks.com (click stock name for detailed review):
|


| 12Stocks.com: Investing in Healthcare sector with Stocks | |
|
The following table helps investors and traders sort through current performance and trends (as measured by Smart Investing & Trading Score) of various
stocks in the Healthcare sector. Quick View: Move mouse or cursor over stock symbol (ticker) to view short-term Technical chart and over stock name to view long term chart. Click on  to add stock symbol to your watchlist and to add stock symbol to your watchlist and  to view watchlist. Click on any ticker or stock name for detailed market intelligence report for that stock. to view watchlist. Click on any ticker or stock name for detailed market intelligence report for that stock. |
12Stocks.com Performance of Stocks in Healthcare Sector
| Ticker | Stock Name | Watchlist | Category | Recent Price | Smart Investing & Trading Score | Change % | Weekly Change% |
| TEVA | Teva |   | Pharmaceutical | 16.29 | 68 | -0.06% | 0.25% |
| AXNX | Axonics Modulation | | Equipment | 67.55 | 58 | -0.18% | 0.22% |
| LIVN | LivaNova | | Equipment | 61.96 | 71 | -1.46% | 0.21% |
| AXDX | Accelerate Diagnostics | | Laboratories | 0.88 | 10 | -3.74% | 0.20% |
| CRMD | CorMedix | | Biotechnology | 5.18 | 46 | -0.58% | 0.19% |
| VERA | Vera | | Biotechnology | 41.39 | 35 | -1.31% | 0.17% |
| FUSN | Fusion | | Biotechnology | 21.51 | 63 | 0.23% | 0.14% |
| ITCI | Intra-Cellular Therapies | | Biotechnology | 65.00 | 10 | -2.30% | 0.06% |
| TARO | Taro | | Pharmaceutical | 42.30 | 55 | 0.24% | 0.00% |
| KRON | Kronos Bio | | Biotechnology | 1.02 | 52 | 3.89% | 0.00% |
| SVA | Sinovac Biotech | | Biotechnology | 6.47 | 17 | 0.00% | 0.00% |
| RFL | Rafael | | Biotechnology | 1.60 | 15 | 0.63% | 0.00% |
| XOMAO | XOMA | | Biotechnology | 25.10 | 51 | 0.00% | 0.00% |
| CMPX | Compass | | Biotechnology | 1.60 | 37 | 0.00% | 0.00% |
| ALGN | Align Technology | | Equipment | 271.50 | 10 | -0.75% | -0.07% |
| VYGR | Voyager | | Biotechnology | 8.43 | 66 | -2.32% | -0.12% |
| HAE | Haemonetics | | Instruments | 95.73 | 63 | 0.98% | -0.14% |
| MESO | Mesoblast | | Biotechnology | 7.35 | 83 | 4.70% | -0.14% |
| MEDP | Medpace | | Laboratories | 393.30 | 15 | 0.01% | -0.14% |
| HOLX | Hologic | | Instruments | 75.02 | 53 | 0.09% | -0.16% |
| ANGO | AngioDynamics | | Instruments | 6.04 | 58 | -5.92% | -0.17% |
| SWAV | ShockWave | | Equipment | 330.13 | 61 | -0.23% | -0.17% |
| AFMD | Affimed N.V | | Biotechnology | 5.24 | 76 | -2.42% | -0.19% |
| GSK | GlaxoSmithKline | | Pharmaceutical | 44.98 | 68 | 0.22% | -0.20% |
| ICLR | ICON Public | | Laboratories | 314.72 | 40 | -0.35% | -0.21% |
| For chart view version of above stock list: Chart View ➞ 0 - 25 , 25 - 50 , 50 - 75 , 75 - 100 , 100 - 125 , 125 - 150 , 150 - 175 , 175 - 200 , 200 - 225 , 225 - 250 , 250 - 275 , 275 - 300 , 300 - 325 , 325 - 350 , 350 - 375 , 375 - 400 , 400 - 425 , 425 - 450 , 450 - 475 , 475 - 500 , 500 - 525 , 525 - 550 , 550 - 575 , 575 - 600 , 600 - 625 , 625 - 650 , 650 - 675 , 675 - 700 , 700 - 725 | ||
 | Click To Change The Sort Order: By Market Cap or Company Size Performance: Year-to-date, Week and Day |  |
|
Get the most comprehensive stock market coverage daily at 12Stocks.com ➞ Best Stocks Today ➞ Best Stocks Weekly ➞ Best Stocks Year-to-Date ➞ Best Stocks Trends ➞  Best Stocks Today 12Stocks.com Best Nasdaq Stocks ➞ Best S&P 500 Stocks ➞ Best Tech Stocks ➞ Best Biotech Stocks ➞ |
| Detailed Overview of Healthcare Stocks |
| Healthcare Technical Overview, Leaders & Laggards, Top Healthcare ETF Funds & Detailed Healthcare Stocks List, Charts, Trends & More |
| Healthcare Sector: Technical Analysis, Trends & YTD Performance | |
| Healthcare sector is composed of stocks
from pharmaceutical, biotech, diagnostics labs, insurance providers
and healthcare services. Healthcare sector, as represented by XLV, an exchange-traded fund [ETF] that holds basket of Healthcare stocks (e.g, Merck, Amgen) is up by 7.28% and is currently underperforming the overall market by -3.29% year-to-date. Below is a quick view of Technical charts and trends: |
|
 XLV Weekly Chart |
|
| Long Term Trend: Very Good | |
| Medium Term Trend: Very Good | |
 XLV Daily Chart |
|
| Short Term Trend: Good | |
| Overall Trend Score: 88 | |
| YTD Performance: 7.28% | |
| **Trend Scores & Views Are Only For Educational Purposes And Not For Investing | |
| 12Stocks.com: Top Performing Healthcare Sector Stocks | ||||||||||||||||||||||||||||||||||||||||||||||||
 The top performing Healthcare sector stocks year to date are
Now, more recently, over last week, the top performing Healthcare sector stocks on the move are


|
||||||||||||||||||||||||||||||||||||||||||||||||
| 12Stocks.com: Investing in Healthcare Sector using Exchange Traded Funds | |
|
The following table shows list of key exchange traded funds (ETF) that
help investors track Healthcare Index. For detailed view, check out our ETF Funds section of our website. Quick View: Move mouse or cursor over ETF symbol (ticker) to view short-term Technical chart and over ETF name to view long term chart. Click on ticker or stock name for detailed view. Click on to add stock symbol to your watchlist and to view watchlist. |
12Stocks.com List of ETFs that track Healthcare Index
| Ticker | ETF Name | Watchlist | Recent Price | Smart Investing & Trading Score | Change % | Week % | Year-to-date % |
| XLV | Health Care | | 146.31 | 88 | 0.19 | 1.89 | 7.28% |
| XBI | Biotech | | 91.18 | 45 | -0.91 | 3.45 | 2.12% |
| IBB | Biotechnology | | 136.69 | 70 | -0.44 | 2.47 | 0.62% |
| BBH | Biotech | | 167.99 | 83 | -0.43 | 2.4 | 1.62% |
| VHT | Health Care | | 267.11 | 75 | 0.00 | 1.88 | 6.55% |
| IYH | Healthcare | | 61.34 | 75 | 0.08 | 1.78 | 7.15% |
| IHF | Healthcare Providers | | 53.91 | 88 | 0.50 | 1.45 | 2.67% |
| IHI | Medical Devices | | 56.69 | 70 | -0.27 | 1.54 | 5.04% |
| BIB | Biotechnology | | 56.96 | 57 | -0.99 | 4.57 | -0.16% |
| BIS | Short Biotech | | 17.59 | 30 | 1.13 | -3.93 | -2.66% |
| XHE | Health Care Equipment | | 87.45 | 88 | -0.30 | 2.45 | 3.79% |
| CURE | Healthcare Bull 3X | | 119.10 | 82 | 0.46 | 5.46 | 17.06% |
| LABU | Biotech Bull 3X | | 111.79 | 47 | -2.79 | 10 | -8.35% |
| LABD | Biotech Bear 3X | | 7.95 | 53 | 2.71 | -9.86 | -17.96% |
| PSCH | SmallCap Health Care | | 43.40 | 71 | -0.31 | 0.99 | 1.39% |
| XHS | Health Care Services | | 91.55 | 76 | -0.22 | 2.24 | 2.92% |
| PTH | DWA Healthcare Momentum | | 42.63 | 52 | -0.46 | 2.03 | 8.92% |
| BTEC | Principal Healthcare Innovators | | 36.48 | 45 | -1.25 | 0.84 | 0.41% |
| RXL | Health Care | | 102.76 | 75 | 0.12 | 3.46 | 12.42% |
| RXD | Short Health Care | | 10.56 | 10 | 0.10 | -3.36 | -11.43% |
| 12Stocks.com: Charts, Trends, Fundamental Data and Performances of Healthcare Stocks | |
|
We now take in-depth look at all Healthcare stocks including charts, multi-period performances and overall trends (as measured by Smart Investing & Trading Score). One can sort Healthcare stocks (click link to choose) by Daily, Weekly and by Year-to-Date performances. Also, one can sort by size of the company or by market capitalization. |
| Select Your Default Chart Type: | |||||
| |||||
| Click on stock symbol or name for detailed view. Click on to add stock symbol to your watchlist and to view watchlist. Quick View: Move mouse or cursor over "Daily" to quickly view daily Technical stock chart and over "Weekly" to view weekly Technical stock chart. | |||||

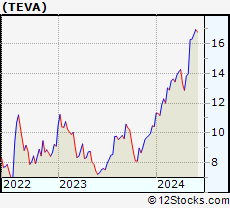 | TEVA Teva Pharmaceutical Industries Limited |
| Sector: Health Care | |
| SubSector: Drug Manufacturers - Other | |
| MarketCap: 9369.93 Millions | |
| Recent Price: 16.29 Smart Investing & Trading Score: 68 | |
| Day Percent Change: -0.06% Day Change: -0.01 | |
| Week Change: 0.25% Year-to-date Change: 56.0% | |
| TEVA Links: Profile News Message Board | |
| Charts:- Daily , Weekly | |
| Add TEVA to Watchlist: View: Get Complete TEVA Trend Analysis ➞ | |
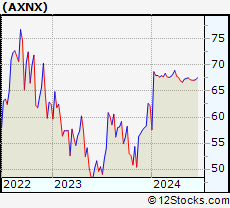 | AXNX Axonics Modulation Technologies, Inc. |
| Sector: Health Care | |
| SubSector: Medical Appliances & Equipment | |
| MarketCap: 692.48 Millions | |
| Recent Price: 67.55 Smart Investing & Trading Score: 58 | |
| Day Percent Change: -0.18% Day Change: -0.12 | |
| Week Change: 0.22% Year-to-date Change: 8.6% | |
| AXNX Links: Profile News Message Board | |
| Charts:- Daily , Weekly | |
| Add AXNX to Watchlist: View: Get Complete AXNX Trend Analysis ➞ | |
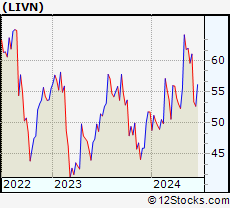 | LIVN LivaNova PLC |
| Sector: Health Care | |
| SubSector: Medical Appliances & Equipment | |
| MarketCap: 2060.5 Millions | |
| Recent Price: 61.96 Smart Investing & Trading Score: 71 | |
| Day Percent Change: -1.46% Day Change: -0.92 | |
| Week Change: 0.21% Year-to-date Change: 19.8% | |
| LIVN Links: Profile News Message Board | |
| Charts:- Daily , Weekly | |
| Add LIVN to Watchlist: View: Get Complete LIVN Trend Analysis ➞ | |
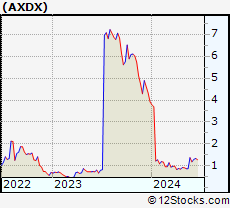 | AXDX Accelerate Diagnostics, Inc. |
| Sector: Health Care | |
| SubSector: Medical Laboratories & Research | |
| MarketCap: 286.4 Millions | |
| Recent Price: 0.88 Smart Investing & Trading Score: 10 | |
| Day Percent Change: -3.74% Day Change: -0.03 | |
| Week Change: 0.2% Year-to-date Change: -77.5% | |
| AXDX Links: Profile News Message Board | |
| Charts:- Daily , Weekly | |
| Add AXDX to Watchlist: View: Get Complete AXDX Trend Analysis ➞ | |
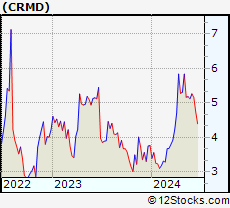 | CRMD CorMedix, Inc. |
| Sector: Health Care | |
| SubSector: Biotechnology | |
| MarketCap: 90.7785 Millions | |
| Recent Price: 5.18 Smart Investing & Trading Score: 46 | |
| Day Percent Change: -0.58% Day Change: -0.03 | |
| Week Change: 0.19% Year-to-date Change: 37.8% | |
| CRMD Links: Profile News Message Board | |
| Charts:- Daily , Weekly | |
| Add CRMD to Watchlist: View: Get Complete CRMD Trend Analysis ➞ | |
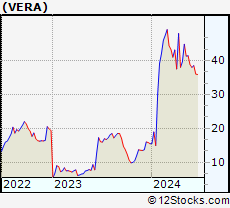 | VERA Vera Therapeutics, Inc. |
| Sector: Health Care | |
| SubSector: Biotechnology | |
| MarketCap: 746 Millions | |
| Recent Price: 41.39 Smart Investing & Trading Score: 35 | |
| Day Percent Change: -1.31% Day Change: -0.55 | |
| Week Change: 0.17% Year-to-date Change: 167.4% | |
| VERA Links: Profile News Message Board | |
| Charts:- Daily , Weekly | |
| Add VERA to Watchlist: View: Get Complete VERA Trend Analysis ➞ | |
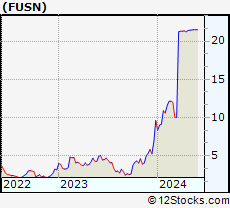 | FUSN Fusion Pharmaceuticals Inc. |
| Sector: Health Care | |
| SubSector: Biotechnology | |
| MarketCap: 52487 Millions | |
| Recent Price: 21.51 Smart Investing & Trading Score: 63 | |
| Day Percent Change: 0.23% Day Change: 0.05 | |
| Week Change: 0.14% Year-to-date Change: 124.1% | |
| FUSN Links: Profile News Message Board | |
| Charts:- Daily , Weekly | |
| Add FUSN to Watchlist: View: Get Complete FUSN Trend Analysis ➞ | |
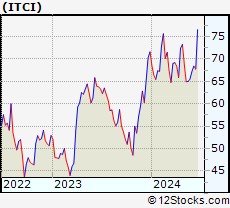 | ITCI Intra-Cellular Therapies, Inc. |
| Sector: Health Care | |
| SubSector: Biotechnology | |
| MarketCap: 991.885 Millions | |
| Recent Price: 65.00 Smart Investing & Trading Score: 10 | |
| Day Percent Change: -2.30% Day Change: -1.53 | |
| Week Change: 0.06% Year-to-date Change: -9.2% | |
| ITCI Links: Profile News Message Board | |
| Charts:- Daily , Weekly | |
| Add ITCI to Watchlist: View: Get Complete ITCI Trend Analysis ➞ | |
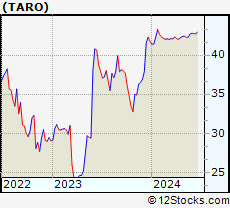 | TARO Taro Pharmaceutical Industries Ltd. |
| Sector: Health Care | |
| SubSector: Drug Manufacturers - Other | |
| MarketCap: 2379.33 Millions | |
| Recent Price: 42.30 Smart Investing & Trading Score: 55 | |
| Day Percent Change: 0.24% Day Change: 0.10 | |
| Week Change: 0% Year-to-date Change: 1.2% | |
| TARO Links: Profile News Message Board | |
| Charts:- Daily , Weekly | |
| Add TARO to Watchlist: View: Get Complete TARO Trend Analysis ➞ | |
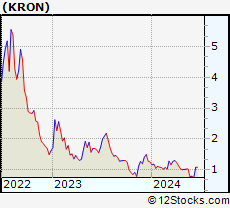 | KRON Kronos Bio, Inc. |
| Sector: Health Care | |
| SubSector: Biotechnology | |
| MarketCap: 17287 Millions | |
| Recent Price: 1.02 Smart Investing & Trading Score: 52 | |
| Day Percent Change: 3.89% Day Change: 0.04 | |
| Week Change: 0% Year-to-date Change: -18.4% | |
| KRON Links: Profile News Message Board | |
| Charts:- Daily , Weekly | |
| Add KRON to Watchlist: View: Get Complete KRON Trend Analysis ➞ | |
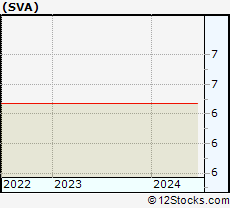 | SVA Sinovac Biotech Ltd. |
| Sector: Health Care | |
| SubSector: Biotechnology | |
| MarketCap: 336.88 Millions | |
| Recent Price: 6.47 Smart Investing & Trading Score: 17 | |
| Day Percent Change: 0.00% Day Change: 0.00 | |
| Week Change: 0% Year-to-date Change: 0.0% | |
| SVA Links: Profile News Message Board | |
| Charts:- Daily , Weekly | |
| Add SVA to Watchlist: View: Get Complete SVA Trend Analysis ➞ | |
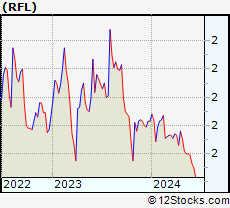 | RFL Rafael Holdings, Inc. |
| Sector: Health Care | |
| SubSector: Biotechnology | |
| MarketCap: 203.685 Millions | |
| Recent Price: 1.60 Smart Investing & Trading Score: 15 | |
| Day Percent Change: 0.63% Day Change: 0.01 | |
| Week Change: 0% Year-to-date Change: -12.6% | |
| RFL Links: Profile News Message Board | |
| Charts:- Daily , Weekly | |
| Add RFL to Watchlist: View: Get Complete RFL Trend Analysis ➞ | |
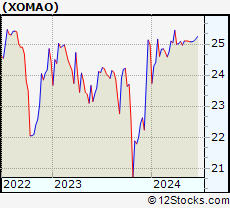 | XOMAO XOMA Corporation |
| Sector: Health Care | |
| SubSector: Biotechnology | |
| MarketCap: 217 Millions | |
| Recent Price: 25.10 Smart Investing & Trading Score: 51 | |
| Day Percent Change: 0.00% Day Change: 0.00 | |
| Week Change: 0% Year-to-date Change: 0.4% | |
| XOMAO Links: Profile News Message Board | |
| Charts:- Daily , Weekly | |
| Add XOMAO to Watchlist: View: Get Complete XOMAO Trend Analysis ➞ | |
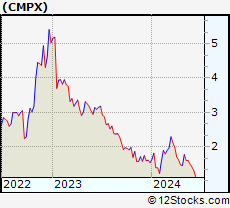 | CMPX Compass Therapeutics, Inc. |
| Sector: Health Care | |
| SubSector: Biotechnology | |
| MarketCap: 406 Millions | |
| Recent Price: 1.60 Smart Investing & Trading Score: 37 | |
| Day Percent Change: 0.00% Day Change: 0.00 | |
| Week Change: 0% Year-to-date Change: 4.2% | |
| CMPX Links: Profile News Message Board | |
| Charts:- Daily , Weekly | |
| Add CMPX to Watchlist: View: Get Complete CMPX Trend Analysis ➞ | |
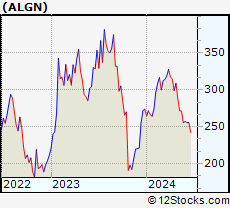 | ALGN Align Technology, Inc. |
| Sector: Health Care | |
| SubSector: Medical Appliances & Equipment | |
| MarketCap: 12802 Millions | |
| Recent Price: 271.50 Smart Investing & Trading Score: 10 | |
| Day Percent Change: -0.75% Day Change: -2.06 | |
| Week Change: -0.07% Year-to-date Change: -0.9% | |
| ALGN Links: Profile News Message Board | |
| Charts:- Daily , Weekly | |
| Add ALGN to Watchlist: View: Get Complete ALGN Trend Analysis ➞ | |
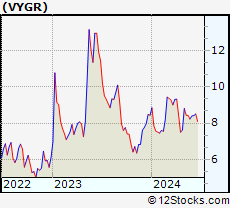 | VYGR Voyager Therapeutics, Inc. |
| Sector: Health Care | |
| SubSector: Biotechnology | |
| MarketCap: 321.085 Millions | |
| Recent Price: 8.43 Smart Investing & Trading Score: 66 | |
| Day Percent Change: -2.32% Day Change: -0.20 | |
| Week Change: -0.12% Year-to-date Change: -0.1% | |
| VYGR Links: Profile News Message Board | |
| Charts:- Daily , Weekly | |
| Add VYGR to Watchlist: View: Get Complete VYGR Trend Analysis ➞ | |
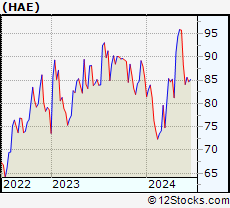 | HAE Haemonetics Corporation |
| Sector: Health Care | |
| SubSector: Medical Instruments & Supplies | |
| MarketCap: 4500.7 Millions | |
| Recent Price: 95.73 Smart Investing & Trading Score: 63 | |
| Day Percent Change: 0.98% Day Change: 0.93 | |
| Week Change: -0.14% Year-to-date Change: 12.0% | |
| HAE Links: Profile News Message Board | |
| Charts:- Daily , Weekly | |
| Add HAE to Watchlist: View: Get Complete HAE Trend Analysis ➞ | |
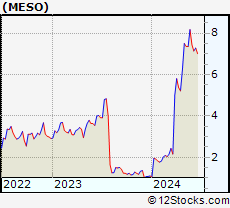 | MESO Mesoblast Limited |
| Sector: Health Care | |
| SubSector: Biotechnology | |
| MarketCap: 471.385 Millions | |
| Recent Price: 7.35 Smart Investing & Trading Score: 83 | |
| Day Percent Change: 4.70% Day Change: 0.33 | |
| Week Change: -0.14% Year-to-date Change: 568.2% | |
| MESO Links: Profile News Message Board | |
| Charts:- Daily , Weekly | |
| Add MESO to Watchlist: View: Get Complete MESO Trend Analysis ➞ | |
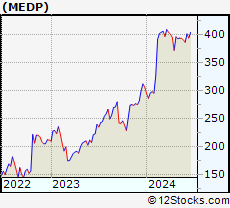 | MEDP Medpace Holdings, Inc. |
| Sector: Health Care | |
| SubSector: Medical Laboratories & Research | |
| MarketCap: 2888.7 Millions | |
| Recent Price: 393.30 Smart Investing & Trading Score: 15 | |
| Day Percent Change: 0.01% Day Change: 0.02 | |
| Week Change: -0.14% Year-to-date Change: 28.3% | |
| MEDP Links: Profile News Message Board | |
| Charts:- Daily , Weekly | |
| Add MEDP to Watchlist: View: Get Complete MEDP Trend Analysis ➞ | |
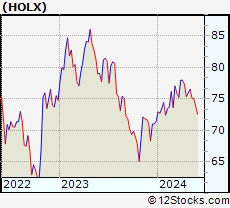 | HOLX Hologic, Inc. |
| Sector: Health Care | |
| SubSector: Medical Instruments & Supplies | |
| MarketCap: 9075.2 Millions | |
| Recent Price: 75.02 Smart Investing & Trading Score: 53 | |
| Day Percent Change: 0.09% Day Change: 0.07 | |
| Week Change: -0.16% Year-to-date Change: 5.0% | |
| HOLX Links: Profile News Message Board | |
| Charts:- Daily , Weekly | |
| Add HOLX to Watchlist: View: Get Complete HOLX Trend Analysis ➞ | |
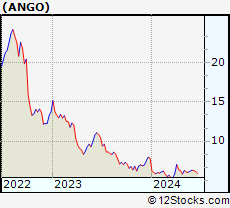 | ANGO AngioDynamics, Inc. |
| Sector: Health Care | |
| SubSector: Medical Instruments & Supplies | |
| MarketCap: 370.86 Millions | |
| Recent Price: 6.04 Smart Investing & Trading Score: 58 | |
| Day Percent Change: -5.92% Day Change: -0.38 | |
| Week Change: -0.17% Year-to-date Change: -23.0% | |
| ANGO Links: Profile News Message Board | |
| Charts:- Daily , Weekly | |
| Add ANGO to Watchlist: View: Get Complete ANGO Trend Analysis ➞ | |
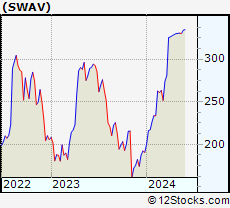 | SWAV ShockWave Medical, Inc. |
| Sector: Health Care | |
| SubSector: Medical Appliances & Equipment | |
| MarketCap: 855.58 Millions | |
| Recent Price: 330.13 Smart Investing & Trading Score: 61 | |
| Day Percent Change: -0.23% Day Change: -0.75 | |
| Week Change: -0.17% Year-to-date Change: 73.2% | |
| SWAV Links: Profile News Message Board | |
| Charts:- Daily , Weekly | |
| Add SWAV to Watchlist: View: Get Complete SWAV Trend Analysis ➞ | |
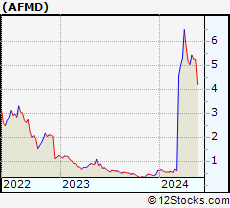 | AFMD Affimed N.V. |
| Sector: Health Care | |
| SubSector: Biotechnology | |
| MarketCap: 161.385 Millions | |
| Recent Price: 5.24 Smart Investing & Trading Score: 76 | |
| Day Percent Change: -2.42% Day Change: -0.13 | |
| Week Change: -0.19% Year-to-date Change: 738.4% | |
| AFMD Links: Profile News Message Board | |
| Charts:- Daily , Weekly | |
| Add AFMD to Watchlist: View: Get Complete AFMD Trend Analysis ➞ | |
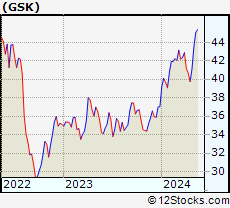 | GSK GlaxoSmithKline plc |
| Sector: Health Care | |
| SubSector: Drug Manufacturers - Major | |
| MarketCap: 89428.2 Millions | |
| Recent Price: 44.98 Smart Investing & Trading Score: 68 | |
| Day Percent Change: 0.22% Day Change: 0.10 | |
| Week Change: -0.2% Year-to-date Change: 21.4% | |
| GSK Links: Profile News Message Board | |
| Charts:- Daily , Weekly | |
| Add GSK to Watchlist: View: Get Complete GSK Trend Analysis ➞ | |
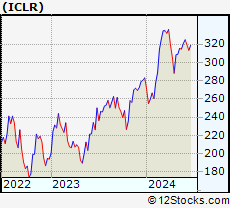 | ICLR ICON Public Limited Company |
| Sector: Health Care | |
| SubSector: Medical Laboratories & Research | |
| MarketCap: 7011 Millions | |
| Recent Price: 314.72 Smart Investing & Trading Score: 40 | |
| Day Percent Change: -0.35% Day Change: -1.11 | |
| Week Change: -0.21% Year-to-date Change: 11.2% | |
| ICLR Links: Profile News Message Board | |
| Charts:- Daily , Weekly | |
| Add ICLR to Watchlist: View: Get Complete ICLR Trend Analysis ➞ | |
| For tabular summary view of above stock list: Summary View ➞ 0 - 25 , 25 - 50 , 50 - 75 , 75 - 100 , 100 - 125 , 125 - 150 , 150 - 175 , 175 - 200 , 200 - 225 , 225 - 250 , 250 - 275 , 275 - 300 , 300 - 325 , 325 - 350 , 350 - 375 , 375 - 400 , 400 - 425 , 425 - 450 , 450 - 475 , 475 - 500 , 500 - 525 , 525 - 550 , 550 - 575 , 575 - 600 , 600 - 625 , 625 - 650 , 650 - 675 , 675 - 700 , 700 - 725 | ||
| Click To Change The Sort Order: By Market Cap or Company Size Performance: Year-to-date, Week and Day | |
| Select Chart Type: | ||
|
Best Stocks Today 12Stocks.com |
© 2024 12Stocks.com Terms & Conditions Privacy Contact Us
All Information Provided Only For Education And Not To Be Used For Investing or Trading. See Terms & Conditions


One More Thing ... Get Best Stocks Delivered Daily!
Never Ever Miss A Move With Our Top Ten Stocks Lists
Find Best Stocks In Any Market - Bull or Bear Market
Take A Peek At Our Top Ten Stocks Lists: Daily, Weekly, Year-to-Date & Top Trends
Find Best Stocks In Any Market - Bull or Bear Market
Take A Peek At Our Top Ten Stocks Lists: Daily, Weekly, Year-to-Date & Top Trends
Healthcare Stocks With Best Up Trends [0-bearish to 100-bullish]: Nurix [100], Wave Life[100], Innate Pharma[100], Inventiva S.A[100], Harrow Health[100], Arbutus Biopharma[100], Avidity Biosciences[100], Integer [100], Quest Diagnostics[100], BeiGene [100], Zura Bio[100]
Best Healthcare Stocks Year-to-Date:
Pieris [6081.32%], Precision BioSciences[3297.26%], Inovio [2252.94%], Avenue [2216.77%], Assembly Biosciences[1671.74%], Aurora Cannabis[1449.77%], Agenus [1211.75%], NuCana [1106.9%], Adverum Biotechnologies[962.7%], Burning Rock[760.19%], Affimed N.V[738.4%] Best Healthcare Stocks This Week:
Burning Rock[946.66%], Vaxxinity [58.82%], Novavax [46.51%], Vicarious Surgical[45.62%], Harrow Health[44.48%], ProKidney [44.31%], Acutus [43.9%], Annovis Bio[40.13%], InflaRx N.V[38.14%], AC Immune[37.66%], Vaxart [36%] Best Healthcare Stocks Daily:
Vaxxinity [45.95%], Acutus [31.11%], Vicarious Surgical[27.93%], Doximity [18.07%], Orchestra BioMed[12.77%], InflaRx N.V[12.41%], Fortress Biotech[9.66%], Tenaya [9.65%], Sharecare [9.12%], AirSculpt Technologies[7.87%], Autolus [7.86%]