
 Login Sign Up


| |||||
 |  | ||||

| 12Stocks.com Market Intelligence |
Best Healthcare Stocks
 | "Discover best trending healthcare stocks with 12Stocks.com." |
| - Subu Vdaygiri, Founder, 12Stocks.com |
| In a hurry? Healthcare Stocks Lists: Performance Trends Table, Stock Charts
Sort Healthcare stocks: Daily, Weekly, Year-to-Date, Market Cap & Trends. Filter Healthcare stocks list by size:All Healthcare Large Mid-Range Small |
| 12Stocks.com Healthcare Stocks Performances & Trends Daily | |||||||||
|
|  The overall Smart Investing & Trading Score is 88 (0-bearish to 100-bullish) which puts Healthcare sector in short term bullish trend. The Smart Investing & Trading Score from previous trading session is 95 and hence a deterioration of trend.
| ||||||||
Here are the Smart Investing & Trading Scores of the most requested Healthcare stocks at 12Stocks.com (click stock name for detailed review):
|


| 12Stocks.com: Investing in Healthcare sector with Stocks | |
|
The following table helps investors and traders sort through current performance and trends (as measured by Smart Investing & Trading Score) of various
stocks in the Healthcare sector. Quick View: Move mouse or cursor over stock symbol (ticker) to view short-term Technical chart and over stock name to view long term chart. Click on  to add stock symbol to your watchlist and to add stock symbol to your watchlist and  to view watchlist. Click on any ticker or stock name for detailed market intelligence report for that stock. to view watchlist. Click on any ticker or stock name for detailed market intelligence report for that stock. |
12Stocks.com Performance of Stocks in Healthcare Sector
| Ticker | Stock Name | Watchlist | Category | Recent Price | Smart Investing & Trading Score | Change % | Weekly Change% |
| FBIOP | Fortress Biotech |   | Biotechnology | 16.67 | 95 | 1.96% | 1.21% |
| INBX | Inhibrx | | Biotechnology | 34.70 | 57 | 0.61% | 1.20% |
| FMS | Fresenius | | Specialized | 21.97 | 68 | -1.88% | 1.15% |
| NCNA | NuCana | | Biotechnology | 3.57 | 53 | -2.72% | 1.13% |
| NTRA | Natera | | Laboratories | 106.46 | 90 | -1.88% | 1.11% |
| ESTA | Establishment Labs | | Equipment | 56.57 | 63 | -2.40% | 1.09% |
| SEM | Select | | Hospitals | 33.95 | 76 | -0.79% | 1.07% |
| FULC | Fulcrum | | Biotechnology | 7.55 | 25 | -3.14% | 1.07% |
| DAWN | Day One | | Biotechnology | 16.17 | 20 | 0.87% | 1.06% |
| THC | Tenet | | Hospitals | 128.47 | 76 | 0.42% | 1.05% |
| BFLY | Butterfly Network | | Medical Devices | 1.03 | 62 | 1.98% | 0.98% |
| ALVO | Alvotech | | Drug Manufacturers - Specialty & Generic | 13.50 | 42 | 0.00% | 0.97% |
| AKRO | Akero | | Biotechnology | 19.92 | 25 | -3.91% | 0.96% |
| BWAY | Brainsway | | Laboratories | 5.38 | 25 | -0.37% | 0.94% |
| GPCR | Structure | | Biotechnology | 36.15 | 35 | 0.75% | 0.92% |
| PIRS | Pieris | | Biotechnology | 11.25 | 63 | 0.67% | 0.90% |
| ROIV | Roivant Sciences | | Biotechnology | 11.23 | 32 | -1.58% | 0.90% |
| MRK | Merck | | Pharmaceutical | 131.19 | 73 | 0.24% | 0.87% |
| REGN | Regeneron | | Biotechnology | 982.29 | 83 | 1.48% | 0.87% |
| XOMA | XOMA | | Biotechnology | 25.66 | 83 | 3.09% | 0.86% |
| MTD | Mettler-Toledo | | Instruments | 1522.75 | 90 | -0.51% | 0.83% |
| STAA | STAAR Surgical | | Instruments | 42.70 | 46 | 0.19% | 0.83% |
| MLSS | Milestone Scientific | | Instruments | 0.68 | 49 | -0.66% | 0.79% |
| LAKE | Lakeland Industries | | Instruments | 17.61 | 52 | 0.34% | 0.77% |
| AMGN | Amgen | | Biotechnology | 312.47 | 76 | -0.71% | 0.75% |
| For chart view version of above stock list: Chart View ➞ 0 - 25 , 25 - 50 , 50 - 75 , 75 - 100 , 100 - 125 , 125 - 150 , 150 - 175 , 175 - 200 , 200 - 225 , 225 - 250 , 250 - 275 , 275 - 300 , 300 - 325 , 325 - 350 , 350 - 375 , 375 - 400 , 400 - 425 , 425 - 450 , 450 - 475 , 475 - 500 , 500 - 525 , 525 - 550 , 550 - 575 , 575 - 600 , 600 - 625 , 625 - 650 , 650 - 675 , 675 - 700 , 700 - 725 | ||
 | Click To Change The Sort Order: By Market Cap or Company Size Performance: Year-to-date, Week and Day |  |
|
Get the most comprehensive stock market coverage daily at 12Stocks.com ➞ Best Stocks Today ➞ Best Stocks Weekly ➞ Best Stocks Year-to-Date ➞ Best Stocks Trends ➞  Best Stocks Today 12Stocks.com Best Nasdaq Stocks ➞ Best S&P 500 Stocks ➞ Best Tech Stocks ➞ Best Biotech Stocks ➞ |
| Detailed Overview of Healthcare Stocks |
| Healthcare Technical Overview, Leaders & Laggards, Top Healthcare ETF Funds & Detailed Healthcare Stocks List, Charts, Trends & More |
| Healthcare Sector: Technical Analysis, Trends & YTD Performance | |
| Healthcare sector is composed of stocks
from pharmaceutical, biotech, diagnostics labs, insurance providers
and healthcare services. Healthcare sector, as represented by XLV, an exchange-traded fund [ETF] that holds basket of Healthcare stocks (e.g, Merck, Amgen) is up by 7.28% and is currently underperforming the overall market by -3.29% year-to-date. Below is a quick view of Technical charts and trends: |
|
 XLV Weekly Chart |
|
| Long Term Trend: Very Good | |
| Medium Term Trend: Very Good | |
 XLV Daily Chart |
|
| Short Term Trend: Good | |
| Overall Trend Score: 88 | |
| YTD Performance: 7.28% | |
| **Trend Scores & Views Are Only For Educational Purposes And Not For Investing | |
| 12Stocks.com: Top Performing Healthcare Sector Stocks | ||||||||||||||||||||||||||||||||||||||||||||||||
 The top performing Healthcare sector stocks year to date are
Now, more recently, over last week, the top performing Healthcare sector stocks on the move are


|
||||||||||||||||||||||||||||||||||||||||||||||||
| 12Stocks.com: Investing in Healthcare Sector using Exchange Traded Funds | |
|
The following table shows list of key exchange traded funds (ETF) that
help investors track Healthcare Index. For detailed view, check out our ETF Funds section of our website. Quick View: Move mouse or cursor over ETF symbol (ticker) to view short-term Technical chart and over ETF name to view long term chart. Click on ticker or stock name for detailed view. Click on to add stock symbol to your watchlist and to view watchlist. |
12Stocks.com List of ETFs that track Healthcare Index
| Ticker | ETF Name | Watchlist | Recent Price | Smart Investing & Trading Score | Change % | Week % | Year-to-date % |
| XLV | Health Care | | 146.31 | 88 | 0.19 | 1.89 | 7.28% |
| XBI | Biotech | | 91.18 | 45 | -0.91 | 3.45 | 2.12% |
| IBB | Biotechnology | | 136.69 | 70 | -0.44 | 2.47 | 0.62% |
| BBH | Biotech | | 167.99 | 83 | -0.43 | 2.4 | 1.62% |
| VHT | Health Care | | 267.11 | 75 | 0.00 | 1.88 | 6.55% |
| IYH | Healthcare | | 61.34 | 75 | 0.08 | 1.78 | 7.15% |
| IHF | Healthcare Providers | | 53.91 | 88 | 0.50 | 1.45 | 2.67% |
| IHI | Medical Devices | | 56.69 | 70 | -0.27 | 1.54 | 5.04% |
| BIB | Biotechnology | | 56.96 | 57 | -0.99 | 4.57 | -0.16% |
| BIS | Short Biotech | | 17.59 | 30 | 1.13 | -3.93 | -2.66% |
| XHE | Health Care Equipment | | 87.45 | 88 | -0.30 | 2.45 | 3.79% |
| CURE | Healthcare Bull 3X | | 119.10 | 82 | 0.46 | 5.46 | 17.06% |
| LABU | Biotech Bull 3X | | 111.79 | 47 | -2.79 | 10 | -8.35% |
| LABD | Biotech Bear 3X | | 7.95 | 53 | 2.71 | -9.86 | -17.96% |
| PSCH | SmallCap Health Care | | 43.40 | 71 | -0.31 | 0.99 | 1.39% |
| XHS | Health Care Services | | 91.55 | 76 | -0.22 | 2.24 | 2.92% |
| PTH | DWA Healthcare Momentum | | 42.63 | 52 | -0.46 | 2.03 | 8.92% |
| BTEC | Principal Healthcare Innovators | | 36.48 | 45 | -1.25 | 0.84 | 0.41% |
| RXL | Health Care | | 102.76 | 75 | 0.12 | 3.46 | 12.42% |
| RXD | Short Health Care | | 10.56 | 10 | 0.10 | -3.36 | -11.43% |
| 12Stocks.com: Charts, Trends, Fundamental Data and Performances of Healthcare Stocks | |
|
We now take in-depth look at all Healthcare stocks including charts, multi-period performances and overall trends (as measured by Smart Investing & Trading Score). One can sort Healthcare stocks (click link to choose) by Daily, Weekly and by Year-to-Date performances. Also, one can sort by size of the company or by market capitalization. |
| Select Your Default Chart Type: | |||||
| |||||
| Click on stock symbol or name for detailed view. Click on to add stock symbol to your watchlist and to view watchlist. Quick View: Move mouse or cursor over "Daily" to quickly view daily Technical stock chart and over "Weekly" to view weekly Technical stock chart. | |||||

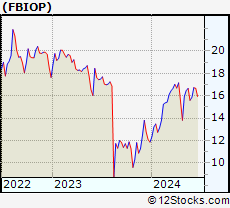 | FBIOP Fortress Biotech, Inc. |
| Sector: Health Care | |
| SubSector: Biotechnology | |
| MarketCap: 836.085 Millions | |
| Recent Price: 16.67 Smart Investing & Trading Score: 95 | |
| Day Percent Change: 1.96% Day Change: 0.32 | |
| Week Change: 1.21% Year-to-date Change: 40.4% | |
| FBIOP Links: Profile News Message Board | |
| Charts:- Daily , Weekly | |
| Add FBIOP to Watchlist: View: Get Complete FBIOP Trend Analysis ➞ | |
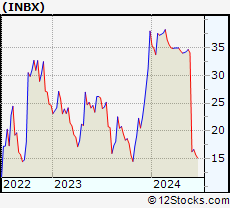 | INBX Inhibrx, Inc. |
| Sector: Health Care | |
| SubSector: Biotechnology | |
| MarketCap: 14187 Millions | |
| Recent Price: 34.70 Smart Investing & Trading Score: 57 | |
| Day Percent Change: 0.61% Day Change: 0.21 | |
| Week Change: 1.2% Year-to-date Change: -8.7% | |
| INBX Links: Profile News Message Board | |
| Charts:- Daily , Weekly | |
| Add INBX to Watchlist: View: Get Complete INBX Trend Analysis ➞ | |
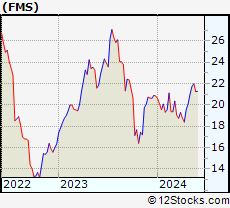 | FMS Fresenius Medical Care AG & Co. KGaA |
| Sector: Health Care | |
| SubSector: Specialized Health Services | |
| MarketCap: 17551.6 Millions | |
| Recent Price: 21.97 Smart Investing & Trading Score: 68 | |
| Day Percent Change: -1.88% Day Change: -0.42 | |
| Week Change: 1.15% Year-to-date Change: 5.5% | |
| FMS Links: Profile News Message Board | |
| Charts:- Daily , Weekly | |
| Add FMS to Watchlist: View: Get Complete FMS Trend Analysis ➞ | |
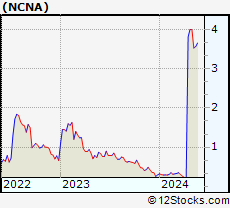 | NCNA NuCana plc |
| Sector: Health Care | |
| SubSector: Biotechnology | |
| MarketCap: 185.785 Millions | |
| Recent Price: 3.57 Smart Investing & Trading Score: 53 | |
| Day Percent Change: -2.72% Day Change: -0.10 | |
| Week Change: 1.13% Year-to-date Change: 1,106.9% | |
| NCNA Links: Profile News Message Board | |
| Charts:- Daily , Weekly | |
| Add NCNA to Watchlist: View: Get Complete NCNA Trend Analysis ➞ | |
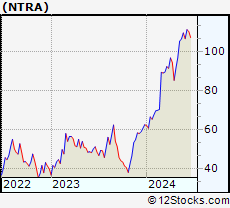 | NTRA Natera, Inc. |
| Sector: Health Care | |
| SubSector: Medical Laboratories & Research | |
| MarketCap: 2152.1 Millions | |
| Recent Price: 106.46 Smart Investing & Trading Score: 90 | |
| Day Percent Change: -1.88% Day Change: -2.04 | |
| Week Change: 1.11% Year-to-date Change: 70.0% | |
| NTRA Links: Profile News Message Board | |
| Charts:- Daily , Weekly | |
| Add NTRA to Watchlist: View: Get Complete NTRA Trend Analysis ➞ | |
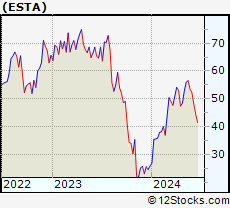 | ESTA Establishment Labs Holdings Inc. |
| Sector: Health Care | |
| SubSector: Medical Appliances & Equipment | |
| MarketCap: 301.78 Millions | |
| Recent Price: 56.57 Smart Investing & Trading Score: 63 | |
| Day Percent Change: -2.40% Day Change: -1.39 | |
| Week Change: 1.09% Year-to-date Change: 118.5% | |
| ESTA Links: Profile News Message Board | |
| Charts:- Daily , Weekly | |
| Add ESTA to Watchlist: View: Get Complete ESTA Trend Analysis ➞ | |
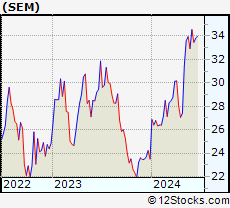 | SEM Select Medical Holdings Corporation |
| Sector: Health Care | |
| SubSector: Hospitals | |
| MarketCap: 1765.96 Millions | |
| Recent Price: 33.95 Smart Investing & Trading Score: 76 | |
| Day Percent Change: -0.79% Day Change: -0.27 | |
| Week Change: 1.07% Year-to-date Change: 44.5% | |
| SEM Links: Profile News Message Board | |
| Charts:- Daily , Weekly | |
| Add SEM to Watchlist: View: Get Complete SEM Trend Analysis ➞ | |
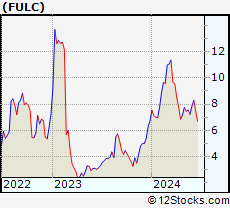 | FULC Fulcrum Therapeutics, Inc. |
| Sector: Health Care | |
| SubSector: Biotechnology | |
| MarketCap: 274.785 Millions | |
| Recent Price: 7.55 Smart Investing & Trading Score: 25 | |
| Day Percent Change: -3.14% Day Change: -0.25 | |
| Week Change: 1.07% Year-to-date Change: 11.9% | |
| FULC Links: Profile News Message Board | |
| Charts:- Daily , Weekly | |
| Add FULC to Watchlist: View: Get Complete FULC Trend Analysis ➞ | |
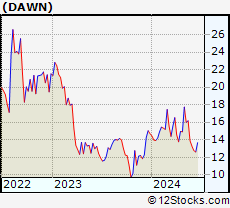 | DAWN Day One Biopharmaceuticals, Inc. |
| Sector: Health Care | |
| SubSector: Biotechnology | |
| MarketCap: 1040 Millions | |
| Recent Price: 16.17 Smart Investing & Trading Score: 20 | |
| Day Percent Change: 0.87% Day Change: 0.14 | |
| Week Change: 1.06% Year-to-date Change: 10.1% | |
| DAWN Links: Profile News Message Board | |
| Charts:- Daily , Weekly | |
| Add DAWN to Watchlist: View: Get Complete DAWN Trend Analysis ➞ | |
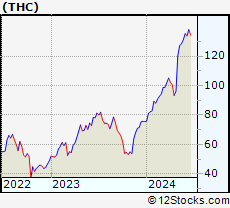 | THC Tenet Healthcare Corporation |
| Sector: Health Care | |
| SubSector: Hospitals | |
| MarketCap: 1544.46 Millions | |
| Recent Price: 128.47 Smart Investing & Trading Score: 76 | |
| Day Percent Change: 0.42% Day Change: 0.54 | |
| Week Change: 1.05% Year-to-date Change: 70.0% | |
| THC Links: Profile News Message Board | |
| Charts:- Daily , Weekly | |
| Add THC to Watchlist: View: Get Complete THC Trend Analysis ➞ | |
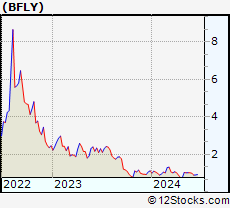 | BFLY Butterfly Network, Inc. |
| Sector: Health Care | |
| SubSector: Medical Devices | |
| MarketCap: 461 Millions | |
| Recent Price: 1.03 Smart Investing & Trading Score: 62 | |
| Day Percent Change: 1.98% Day Change: 0.02 | |
| Week Change: 0.98% Year-to-date Change: -8.9% | |
| BFLY Links: Profile News Message Board | |
| Charts:- Daily , Weekly | |
| Add BFLY to Watchlist: View: Get Complete BFLY Trend Analysis ➞ | |
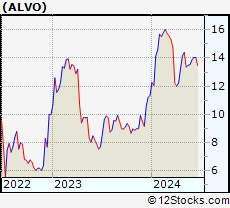 | ALVO Alvotech |
| Sector: Health Care | |
| SubSector: Drug Manufacturers - Specialty & Generic | |
| MarketCap: 2160 Millions | |
| Recent Price: 13.50 Smart Investing & Trading Score: 42 | |
| Day Percent Change: 0.00% Day Change: 0.00 | |
| Week Change: 0.97% Year-to-date Change: 18.8% | |
| ALVO Links: Profile News Message Board | |
| Charts:- Daily , Weekly | |
| Add ALVO to Watchlist: View: Get Complete ALVO Trend Analysis ➞ | |
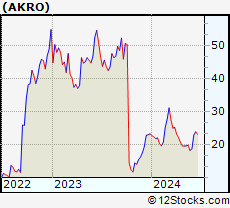 | AKRO Akero Therapeutics, Inc. |
| Sector: Health Care | |
| SubSector: Biotechnology | |
| MarketCap: 675.085 Millions | |
| Recent Price: 19.92 Smart Investing & Trading Score: 25 | |
| Day Percent Change: -3.91% Day Change: -0.81 | |
| Week Change: 0.96% Year-to-date Change: -14.7% | |
| AKRO Links: Profile News Message Board | |
| Charts:- Daily , Weekly | |
| Add AKRO to Watchlist: View: Get Complete AKRO Trend Analysis ➞ | |
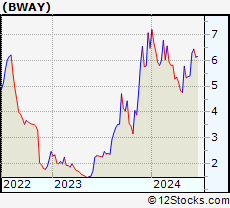 | BWAY Brainsway Ltd. |
| Sector: Health Care | |
| SubSector: Medical Laboratories & Research | |
| MarketCap: 65.03 Millions | |
| Recent Price: 5.38 Smart Investing & Trading Score: 25 | |
| Day Percent Change: -0.37% Day Change: -0.02 | |
| Week Change: 0.94% Year-to-date Change: -17.0% | |
| BWAY Links: Profile News Message Board | |
| Charts:- Daily , Weekly | |
| Add BWAY to Watchlist: View: Get Complete BWAY Trend Analysis ➞ | |
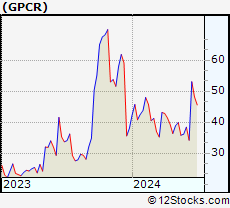 | GPCR Structure Therapeutics Inc. |
| Sector: Health Care | |
| SubSector: Biotechnology | |
| MarketCap: 1530 Millions | |
| Recent Price: 36.15 Smart Investing & Trading Score: 35 | |
| Day Percent Change: 0.75% Day Change: 0.27 | |
| Week Change: 0.92% Year-to-date Change: -5.1% | |
| GPCR Links: Profile News Message Board | |
| Charts:- Daily , Weekly | |
| Add GPCR to Watchlist: View: Get Complete GPCR Trend Analysis ➞ | |
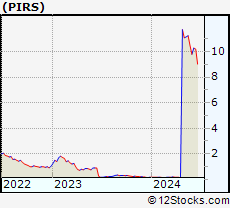 | PIRS Pieris Pharmaceuticals, Inc. |
| Sector: Health Care | |
| SubSector: Biotechnology | |
| MarketCap: 150.785 Millions | |
| Recent Price: 11.25 Smart Investing & Trading Score: 63 | |
| Day Percent Change: 0.67% Day Change: 0.07 | |
| Week Change: 0.9% Year-to-date Change: 6,081.3% | |
| PIRS Links: Profile News Message Board | |
| Charts:- Daily , Weekly | |
| Add PIRS to Watchlist: View: Get Complete PIRS Trend Analysis ➞ | |
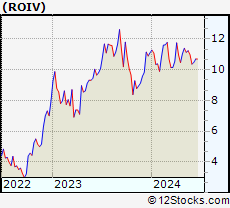 | ROIV Roivant Sciences Ltd. |
| Sector: Health Care | |
| SubSector: Biotechnology | |
| MarketCap: 7780 Millions | |
| Recent Price: 11.23 Smart Investing & Trading Score: 32 | |
| Day Percent Change: -1.58% Day Change: -0.18 | |
| Week Change: 0.9% Year-to-date Change: 1.1% | |
| ROIV Links: Profile News Message Board | |
| Charts:- Daily , Weekly | |
| Add ROIV to Watchlist: View: Get Complete ROIV Trend Analysis ➞ | |
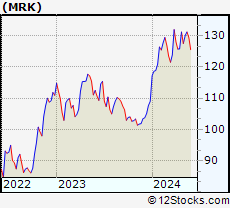 | MRK Merck & Co., Inc. |
| Sector: Health Care | |
| SubSector: Drug Manufacturers - Major | |
| MarketCap: 192657 Millions | |
| Recent Price: 131.19 Smart Investing & Trading Score: 73 | |
| Day Percent Change: 0.24% Day Change: 0.31 | |
| Week Change: 0.87% Year-to-date Change: 20.3% | |
| MRK Links: Profile News Message Board | |
| Charts:- Daily , Weekly | |
| Add MRK to Watchlist: View: Get Complete MRK Trend Analysis ➞ | |
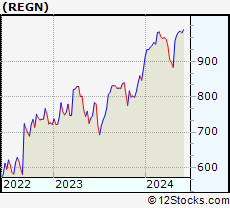 | REGN Regeneron Pharmaceuticals, Inc. |
| Sector: Health Care | |
| SubSector: Biotechnology | |
| MarketCap: 51903.7 Millions | |
| Recent Price: 982.29 Smart Investing & Trading Score: 83 | |
| Day Percent Change: 1.48% Day Change: 14.31 | |
| Week Change: 0.87% Year-to-date Change: 11.8% | |
| REGN Links: Profile News Message Board | |
| Charts:- Daily , Weekly | |
| Add REGN to Watchlist: View: Get Complete REGN Trend Analysis ➞ | |
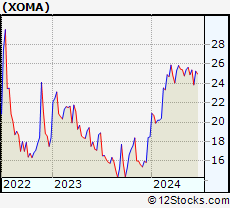 | XOMA XOMA Corporation |
| Sector: Health Care | |
| SubSector: Biotechnology | |
| MarketCap: 174.885 Millions | |
| Recent Price: 25.66 Smart Investing & Trading Score: 83 | |
| Day Percent Change: 3.09% Day Change: 0.77 | |
| Week Change: 0.86% Year-to-date Change: 38.7% | |
| XOMA Links: Profile News Message Board | |
| Charts:- Daily , Weekly | |
| Add XOMA to Watchlist: View: Get Complete XOMA Trend Analysis ➞ | |
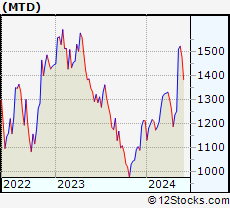 | MTD Mettler-Toledo International Inc. |
| Sector: Health Care | |
| SubSector: Medical Instruments & Supplies | |
| MarketCap: 15973.1 Millions | |
| Recent Price: 1522.75 Smart Investing & Trading Score: 90 | |
| Day Percent Change: -0.51% Day Change: -7.80 | |
| Week Change: 0.83% Year-to-date Change: 25.5% | |
| MTD Links: Profile News Message Board | |
| Charts:- Daily , Weekly | |
| Add MTD to Watchlist: View: Get Complete MTD Trend Analysis ➞ | |
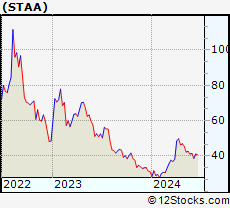 | STAA STAAR Surgical Company |
| Sector: Health Care | |
| SubSector: Medical Instruments & Supplies | |
| MarketCap: 1334.6 Millions | |
| Recent Price: 42.70 Smart Investing & Trading Score: 46 | |
| Day Percent Change: 0.19% Day Change: 0.08 | |
| Week Change: 0.83% Year-to-date Change: 36.8% | |
| STAA Links: Profile News Message Board | |
| Charts:- Daily , Weekly | |
| Add STAA to Watchlist: View: Get Complete STAA Trend Analysis ➞ | |
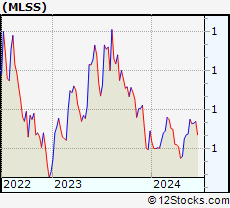 | MLSS Milestone Scientific Inc. |
| Sector: Health Care | |
| SubSector: Medical Instruments & Supplies | |
| MarketCap: 72.186 Millions | |
| Recent Price: 0.68 Smart Investing & Trading Score: 49 | |
| Day Percent Change: -0.66% Day Change: 0.00 | |
| Week Change: 0.79% Year-to-date Change: -2.1% | |
| MLSS Links: Profile News Message Board | |
| Charts:- Daily , Weekly | |
| Add MLSS to Watchlist: View: Get Complete MLSS Trend Analysis ➞ | |
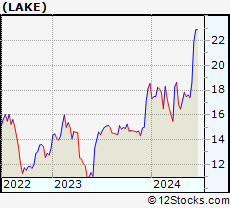 | LAKE Lakeland Industries, Inc. |
| Sector: Health Care | |
| SubSector: Medical Instruments & Supplies | |
| MarketCap: 138.16 Millions | |
| Recent Price: 17.61 Smart Investing & Trading Score: 52 | |
| Day Percent Change: 0.34% Day Change: 0.06 | |
| Week Change: 0.77% Year-to-date Change: -5.0% | |
| LAKE Links: Profile News Message Board | |
| Charts:- Daily , Weekly | |
| Add LAKE to Watchlist: View: Get Complete LAKE Trend Analysis ➞ | |
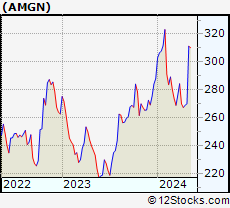 | AMGN Amgen Inc. |
| Sector: Health Care | |
| SubSector: Biotechnology | |
| MarketCap: 121030 Millions | |
| Recent Price: 312.47 Smart Investing & Trading Score: 76 | |
| Day Percent Change: -0.71% Day Change: -2.25 | |
| Week Change: 0.75% Year-to-date Change: 8.5% | |
| AMGN Links: Profile News Message Board | |
| Charts:- Daily , Weekly | |
| Add AMGN to Watchlist: View: Get Complete AMGN Trend Analysis ➞ | |
| For tabular summary view of above stock list: Summary View ➞ 0 - 25 , 25 - 50 , 50 - 75 , 75 - 100 , 100 - 125 , 125 - 150 , 150 - 175 , 175 - 200 , 200 - 225 , 225 - 250 , 250 - 275 , 275 - 300 , 300 - 325 , 325 - 350 , 350 - 375 , 375 - 400 , 400 - 425 , 425 - 450 , 450 - 475 , 475 - 500 , 500 - 525 , 525 - 550 , 550 - 575 , 575 - 600 , 600 - 625 , 625 - 650 , 650 - 675 , 675 - 700 , 700 - 725 | ||
| Click To Change The Sort Order: By Market Cap or Company Size Performance: Year-to-date, Week and Day | |
| Select Chart Type: | ||
|
Best Stocks Today 12Stocks.com |
© 2024 12Stocks.com Terms & Conditions Privacy Contact Us
All Information Provided Only For Education And Not To Be Used For Investing or Trading. See Terms & Conditions


One More Thing ... Get Best Stocks Delivered Daily!
Never Ever Miss A Move With Our Top Ten Stocks Lists
Find Best Stocks In Any Market - Bull or Bear Market
Take A Peek At Our Top Ten Stocks Lists: Daily, Weekly, Year-to-Date & Top Trends
Find Best Stocks In Any Market - Bull or Bear Market
Take A Peek At Our Top Ten Stocks Lists: Daily, Weekly, Year-to-Date & Top Trends
Healthcare Stocks With Best Up Trends [0-bearish to 100-bullish]: Nurix [100], Wave Life[100], Innate Pharma[100], Inventiva S.A[100], Harrow Health[100], Arbutus Biopharma[100], Avidity Biosciences[100], Integer [100], Quest Diagnostics[100], BeiGene [100], Zura Bio[100]
Best Healthcare Stocks Year-to-Date:
Pieris [6081.32%], Precision BioSciences[3297.26%], Inovio [2252.94%], Avenue [2216.77%], Assembly Biosciences[1671.74%], Aurora Cannabis[1449.77%], Agenus [1211.75%], NuCana [1106.9%], Adverum Biotechnologies[962.7%], Burning Rock[760.19%], Affimed N.V[738.4%] Best Healthcare Stocks This Week:
Burning Rock[946.66%], Vaxxinity [58.82%], Novavax [46.51%], Vicarious Surgical[45.62%], Harrow Health[44.48%], ProKidney [44.31%], Acutus [43.9%], Annovis Bio[40.13%], InflaRx N.V[38.14%], AC Immune[37.66%], Vaxart [36%] Best Healthcare Stocks Daily:
Vaxxinity [45.95%], Acutus [31.11%], Vicarious Surgical[27.93%], Doximity [18.07%], Orchestra BioMed[12.77%], InflaRx N.V[12.41%], Fortress Biotech[9.66%], Tenaya [9.65%], Sharecare [9.12%], AirSculpt Technologies[7.87%], Autolus [7.86%]