
 Login Sign Up


| |||||
 |  | ||||

| 12Stocks.com Market Intelligence |
Best Healthcare Stocks
 | "Discover best trending healthcare stocks with 12Stocks.com." |
| - Subu Vdaygiri, Founder, 12Stocks.com |
| In a hurry? Healthcare Stocks Lists: Performance Trends Table, Stock Charts
Sort Healthcare stocks: Daily, Weekly, Year-to-Date, Market Cap & Trends. Filter Healthcare stocks list by size:All Healthcare Large Mid-Range Small |
| 12Stocks.com Healthcare Stocks Performances & Trends Daily | |||||||||
|
|  The overall Smart Investing & Trading Score is 88 (0-bearish to 100-bullish) which puts Healthcare sector in short term bullish trend. The Smart Investing & Trading Score from previous trading session is 95 and hence a deterioration of trend.
| ||||||||
Here are the Smart Investing & Trading Scores of the most requested Healthcare stocks at 12Stocks.com (click stock name for detailed review):
|


| 12Stocks.com: Investing in Healthcare sector with Stocks | |
|
The following table helps investors and traders sort through current performance and trends (as measured by Smart Investing & Trading Score) of various
stocks in the Healthcare sector. Quick View: Move mouse or cursor over stock symbol (ticker) to view short-term Technical chart and over stock name to view long term chart. Click on  to add stock symbol to your watchlist and to add stock symbol to your watchlist and  to view watchlist. Click on any ticker or stock name for detailed market intelligence report for that stock. to view watchlist. Click on any ticker or stock name for detailed market intelligence report for that stock. |
12Stocks.com Performance of Stocks in Healthcare Sector
| Ticker | Stock Name | Watchlist | Category | Recent Price | Smart Investing & Trading Score | Change % | Weekly Change% |
| ARGX | argenx SE |   | Biotechnology | 365.81 | 15 | -2.87% | -3.61% |
| ATEC | Alphatec | | Instruments | 11.10 | 25 | -3.73% | -3.65% |
| VCNX | Vaccinex | | Biotechnology | 5.54 | 15 | 0.05% | -3.65% |
| APTO | Aptose Biosciences | | Biotechnology | 1.19 | 17 | 0.42% | -3.66% |
| STXS | Stereotaxis | | Instruments | 2.10 | 10 | 0.00% | -3.67% |
| KROS | Keros | | Biotechnology | 52.28 | 0 | -3.17% | -3.67% |
| HRMY | Harmony Biosciences | | Biotechnology | 29.03 | 10 | -0.96% | -3.68% |
| JANX | Janux | | Biotechnology | 47.10 | 23 | -0.86% | -3.72% |
| ZNTL | Zentalis | | Biotechnology | 12.07 | 52 | 0.92% | -3.75% |
| SVRA | Savara | | Biotechnology | 4.48 | 15 | -5.08% | -3.76% |
| IPSC | Century | | Biotechnology | 3.01 | 30 | -3.83% | -3.83% |
| MLYS | Mineralys | | Biotechnology | 13.00 | 33 | -1.14% | -3.85% |
| NVCT | Nuvectis Pharma | | Biotechnology | 6.15 | 10 | -5.82% | -3.91% |
| ATAI | Atai Life | | Biotechnology | 1.81 | 36 | -2.68% | -3.97% |
| YMAB | Y-mAbs | | Biotechnology | 11.60 | 10 | -2.11% | -3.97% |
| ZLAB | Zai Lab | | Biotechnology | 19.40 | 42 | -2.66% | -4.01% |
| ENTA | Enanta | | Biotechnology | 12.13 | 17 | -7.12% | -4.11% |
| PEN | Penumbra | | Instruments | 203.53 | 25 | 0.99% | -4.12% |
| CYTK | Cytokinetics | | Biotechnology | 59.53 | 18 | -0.65% | -4.14% |
| APRE | Aprea | | Biotechnology | 5.27 | 32 | -5.72% | -4.18% |
| IRTC | iRhythm Technologies | | Instruments | 94.83 | 0 | -3.92% | -4.22% |
| CRBU | Caribou Biosciences | | Biotechnology | 3.39 | 10 | -5.57% | -4.24% |
| BMRN | BioMarin | | Biotechnology | 77.56 | 10 | 0.77% | -4.28% |
| FATE | Fate | | Biotechnology | 3.90 | 27 | -5.80% | -4.41% |
| SMMT | Summit | | Biotechnology | 4.44 | 37 | -1.55% | -4.52% |
| For chart view version of above stock list: Chart View ➞ 0 - 25 , 25 - 50 , 50 - 75 , 75 - 100 , 100 - 125 , 125 - 150 , 150 - 175 , 175 - 200 , 200 - 225 , 225 - 250 , 250 - 275 , 275 - 300 , 300 - 325 , 325 - 350 , 350 - 375 , 375 - 400 , 400 - 425 , 425 - 450 , 450 - 475 , 475 - 500 , 500 - 525 , 525 - 550 , 550 - 575 , 575 - 600 , 600 - 625 , 625 - 650 , 650 - 675 , 675 - 700 , 700 - 725 | ||
 | Click To Change The Sort Order: By Market Cap or Company Size Performance: Year-to-date, Week and Day |  |
|
Get the most comprehensive stock market coverage daily at 12Stocks.com ➞ Best Stocks Today ➞ Best Stocks Weekly ➞ Best Stocks Year-to-Date ➞ Best Stocks Trends ➞  Best Stocks Today 12Stocks.com Best Nasdaq Stocks ➞ Best S&P 500 Stocks ➞ Best Tech Stocks ➞ Best Biotech Stocks ➞ |
| Detailed Overview of Healthcare Stocks |
| Healthcare Technical Overview, Leaders & Laggards, Top Healthcare ETF Funds & Detailed Healthcare Stocks List, Charts, Trends & More |
| Healthcare Sector: Technical Analysis, Trends & YTD Performance | |
| Healthcare sector is composed of stocks
from pharmaceutical, biotech, diagnostics labs, insurance providers
and healthcare services. Healthcare sector, as represented by XLV, an exchange-traded fund [ETF] that holds basket of Healthcare stocks (e.g, Merck, Amgen) is up by 7.28% and is currently underperforming the overall market by -3.29% year-to-date. Below is a quick view of Technical charts and trends: |
|
 XLV Weekly Chart |
|
| Long Term Trend: Very Good | |
| Medium Term Trend: Very Good | |
 XLV Daily Chart |
|
| Short Term Trend: Good | |
| Overall Trend Score: 88 | |
| YTD Performance: 7.28% | |
| **Trend Scores & Views Are Only For Educational Purposes And Not For Investing | |
| 12Stocks.com: Top Performing Healthcare Sector Stocks | ||||||||||||||||||||||||||||||||||||||||||||||||
 The top performing Healthcare sector stocks year to date are
Now, more recently, over last week, the top performing Healthcare sector stocks on the move are


|
||||||||||||||||||||||||||||||||||||||||||||||||
| 12Stocks.com: Investing in Healthcare Sector using Exchange Traded Funds | |
|
The following table shows list of key exchange traded funds (ETF) that
help investors track Healthcare Index. For detailed view, check out our ETF Funds section of our website. Quick View: Move mouse or cursor over ETF symbol (ticker) to view short-term Technical chart and over ETF name to view long term chart. Click on ticker or stock name for detailed view. Click on to add stock symbol to your watchlist and to view watchlist. |
12Stocks.com List of ETFs that track Healthcare Index
| Ticker | ETF Name | Watchlist | Recent Price | Smart Investing & Trading Score | Change % | Week % | Year-to-date % |
| XLV | Health Care | | 146.31 | 88 | 0.19 | 1.89 | 7.28% |
| XBI | Biotech | | 91.18 | 45 | -0.91 | 3.45 | 2.12% |
| IBB | Biotechnology | | 136.69 | 70 | -0.44 | 2.47 | 0.62% |
| BBH | Biotech | | 167.99 | 83 | -0.43 | 2.4 | 1.62% |
| VHT | Health Care | | 267.11 | 75 | 0.00 | 1.88 | 6.55% |
| IYH | Healthcare | | 61.34 | 75 | 0.08 | 1.78 | 7.15% |
| IHF | Healthcare Providers | | 53.91 | 88 | 0.50 | 1.45 | 2.67% |
| IHI | Medical Devices | | 56.69 | 70 | -0.27 | 1.54 | 5.04% |
| BIB | Biotechnology | | 56.96 | 57 | -0.99 | 4.57 | -0.16% |
| BIS | Short Biotech | | 17.59 | 30 | 1.13 | -3.93 | -2.66% |
| XHE | Health Care Equipment | | 87.45 | 88 | -0.30 | 2.45 | 3.79% |
| CURE | Healthcare Bull 3X | | 119.10 | 82 | 0.46 | 5.46 | 17.06% |
| LABU | Biotech Bull 3X | | 111.79 | 47 | -2.79 | 10 | -8.35% |
| LABD | Biotech Bear 3X | | 7.95 | 53 | 2.71 | -9.86 | -17.96% |
| PSCH | SmallCap Health Care | | 43.40 | 71 | -0.31 | 0.99 | 1.39% |
| XHS | Health Care Services | | 91.55 | 76 | -0.22 | 2.24 | 2.92% |
| PTH | DWA Healthcare Momentum | | 42.63 | 52 | -0.46 | 2.03 | 8.92% |
| BTEC | Principal Healthcare Innovators | | 36.48 | 45 | -1.25 | 0.84 | 0.41% |
| RXL | Health Care | | 102.76 | 75 | 0.12 | 3.46 | 12.42% |
| RXD | Short Health Care | | 10.56 | 10 | 0.10 | -3.36 | -11.43% |
| 12Stocks.com: Charts, Trends, Fundamental Data and Performances of Healthcare Stocks | |
|
We now take in-depth look at all Healthcare stocks including charts, multi-period performances and overall trends (as measured by Smart Investing & Trading Score). One can sort Healthcare stocks (click link to choose) by Daily, Weekly and by Year-to-Date performances. Also, one can sort by size of the company or by market capitalization. |
| Select Your Default Chart Type: | |||||
| |||||
| Click on stock symbol or name for detailed view. Click on to add stock symbol to your watchlist and to view watchlist. Quick View: Move mouse or cursor over "Daily" to quickly view daily Technical stock chart and over "Weekly" to view weekly Technical stock chart. | |||||

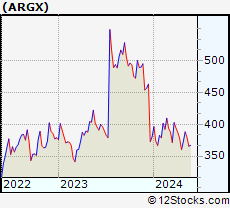 | ARGX argenx SE |
| Sector: Health Care | |
| SubSector: Biotechnology | |
| MarketCap: 5077.05 Millions | |
| Recent Price: 365.81 Smart Investing & Trading Score: 15 | |
| Day Percent Change: -2.87% Day Change: -10.79 | |
| Week Change: -3.61% Year-to-date Change: -3.8% | |
| ARGX Links: Profile News Message Board | |
| Charts:- Daily , Weekly | |
| Add ARGX to Watchlist: View: Get Complete ARGX Trend Analysis ➞ | |
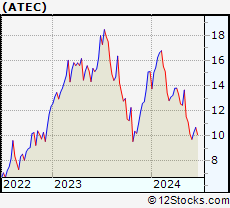 | ATEC Alphatec Holdings, Inc. |
| Sector: Health Care | |
| SubSector: Medical Instruments & Supplies | |
| MarketCap: 181.16 Millions | |
| Recent Price: 11.10 Smart Investing & Trading Score: 25 | |
| Day Percent Change: -3.73% Day Change: -0.43 | |
| Week Change: -3.65% Year-to-date Change: -26.5% | |
| ATEC Links: Profile News Message Board | |
| Charts:- Daily , Weekly | |
| Add ATEC to Watchlist: View: Get Complete ATEC Trend Analysis ➞ | |
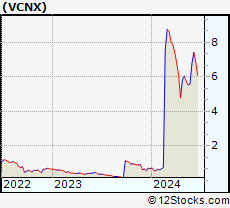 | VCNX Vaccinex, Inc. |
| Sector: Health Care | |
| SubSector: Biotechnology | |
| MarketCap: 64.9785 Millions | |
| Recent Price: 5.54 Smart Investing & Trading Score: 15 | |
| Day Percent Change: 0.05% Day Change: 0.00 | |
| Week Change: -3.65% Year-to-date Change: 733.1% | |
| VCNX Links: Profile News Message Board | |
| Charts:- Daily , Weekly | |
| Add VCNX to Watchlist: View: Get Complete VCNX Trend Analysis ➞ | |
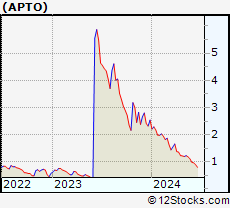 | APTO Aptose Biosciences Inc. |
| Sector: Health Care | |
| SubSector: Biotechnology | |
| MarketCap: 484.585 Millions | |
| Recent Price: 1.19 Smart Investing & Trading Score: 17 | |
| Day Percent Change: 0.42% Day Change: 0.00 | |
| Week Change: -3.66% Year-to-date Change: -53.4% | |
| APTO Links: Profile News Message Board | |
| Charts:- Daily , Weekly | |
| Add APTO to Watchlist: View: Get Complete APTO Trend Analysis ➞ | |
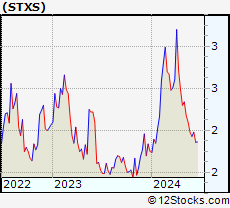 | STXS Stereotaxis, Inc. |
| Sector: Health Care | |
| SubSector: Medical Instruments & Supplies | |
| MarketCap: 232.26 Millions | |
| Recent Price: 2.10 Smart Investing & Trading Score: 10 | |
| Day Percent Change: 0.00% Day Change: 0.00 | |
| Week Change: -3.67% Year-to-date Change: 20.0% | |
| STXS Links: Profile News Message Board | |
| Charts:- Daily , Weekly | |
| Add STXS to Watchlist: View: Get Complete STXS Trend Analysis ➞ | |
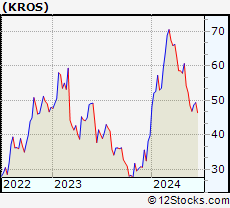 | KROS Keros Therapeutics, Inc. |
| Sector: Health Care | |
| SubSector: Biotechnology | |
| MarketCap: 17887 Millions | |
| Recent Price: 52.28 Smart Investing & Trading Score: 0 | |
| Day Percent Change: -3.17% Day Change: -1.71 | |
| Week Change: -3.67% Year-to-date Change: 31.2% | |
| KROS Links: Profile News Message Board | |
| Charts:- Daily , Weekly | |
| Add KROS to Watchlist: View: Get Complete KROS Trend Analysis ➞ | |
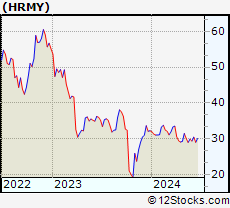 | HRMY Harmony Biosciences Holdings, Inc. |
| Sector: Health Care | |
| SubSector: Biotechnology | |
| MarketCap: 24487 Millions | |
| Recent Price: 29.03 Smart Investing & Trading Score: 10 | |
| Day Percent Change: -0.96% Day Change: -0.28 | |
| Week Change: -3.68% Year-to-date Change: -10.1% | |
| HRMY Links: Profile News Message Board | |
| Charts:- Daily , Weekly | |
| Add HRMY to Watchlist: View: Get Complete HRMY Trend Analysis ➞ | |
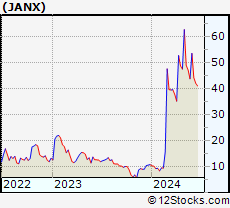 | JANX Janux Therapeutics, Inc. |
| Sector: Health Care | |
| SubSector: Biotechnology | |
| MarketCap: 496 Millions | |
| Recent Price: 47.10 Smart Investing & Trading Score: 23 | |
| Day Percent Change: -0.86% Day Change: -0.41 | |
| Week Change: -3.72% Year-to-date Change: 338.3% | |
| JANX Links: Profile News Message Board | |
| Charts:- Daily , Weekly | |
| Add JANX to Watchlist: View: Get Complete JANX Trend Analysis ➞ | |
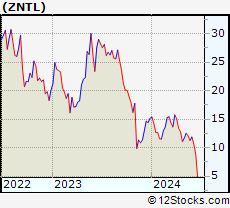 | ZNTL Zentalis Pharmaceuticals, Inc. |
| Sector: Health Care | |
| SubSector: Biotechnology | |
| MarketCap: 22187 Millions | |
| Recent Price: 12.07 Smart Investing & Trading Score: 52 | |
| Day Percent Change: 0.92% Day Change: 0.11 | |
| Week Change: -3.75% Year-to-date Change: -20.4% | |
| ZNTL Links: Profile News Message Board | |
| Charts:- Daily , Weekly | |
| Add ZNTL to Watchlist: View: Get Complete ZNTL Trend Analysis ➞ | |
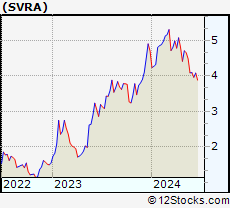 | SVRA Savara Inc. |
| Sector: Health Care | |
| SubSector: Biotechnology | |
| MarketCap: 80.3785 Millions | |
| Recent Price: 4.48 Smart Investing & Trading Score: 15 | |
| Day Percent Change: -5.08% Day Change: -0.24 | |
| Week Change: -3.76% Year-to-date Change: -4.7% | |
| SVRA Links: Profile News Message Board | |
| Charts:- Daily , Weekly | |
| Add SVRA to Watchlist: View: Get Complete SVRA Trend Analysis ➞ | |
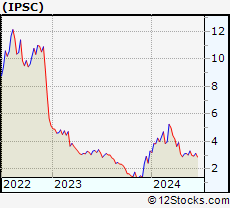 | IPSC Century Therapeutics, Inc. |
| Sector: Health Care | |
| SubSector: Biotechnology | |
| MarketCap: 187 Millions | |
| Recent Price: 3.01 Smart Investing & Trading Score: 30 | |
| Day Percent Change: -3.83% Day Change: -0.12 | |
| Week Change: -3.83% Year-to-date Change: -8.8% | |
| IPSC Links: Profile News Message Board | |
| Charts:- Daily , Weekly | |
| Add IPSC to Watchlist: View: Get Complete IPSC Trend Analysis ➞ | |
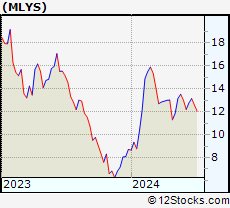 | MLYS Mineralys Therapeutics, Inc. |
| Sector: Health Care | |
| SubSector: Biotechnology | |
| MarketCap: 719 Millions | |
| Recent Price: 13.00 Smart Investing & Trading Score: 33 | |
| Day Percent Change: -1.14% Day Change: -0.15 | |
| Week Change: -3.85% Year-to-date Change: 49.1% | |
| MLYS Links: Profile News Message Board | |
| Charts:- Daily , Weekly | |
| Add MLYS to Watchlist: View: Get Complete MLYS Trend Analysis ➞ | |
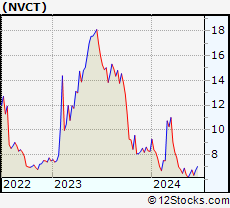 | NVCT Nuvectis Pharma, Inc. |
| Sector: Health Care | |
| SubSector: Biotechnology | |
| MarketCap: 258 Millions | |
| Recent Price: 6.15 Smart Investing & Trading Score: 10 | |
| Day Percent Change: -5.82% Day Change: -0.38 | |
| Week Change: -3.91% Year-to-date Change: -25.6% | |
| NVCT Links: Profile News Message Board | |
| Charts:- Daily , Weekly | |
| Add NVCT to Watchlist: View: Get Complete NVCT Trend Analysis ➞ | |
 | ATAI Atai Life Sciences N.V. |
| Sector: Health Care | |
| SubSector: Biotechnology | |
| MarketCap: 287 Millions | |
| Recent Price: 1.81 Smart Investing & Trading Score: 36 | |
| Day Percent Change: -2.68% Day Change: -0.05 | |
| Week Change: -3.97% Year-to-date Change: 28.7% | |
| ATAI Links: Profile News Message Board | |
| Charts:- Daily , Weekly | |
| Add ATAI to Watchlist: View: Get Complete ATAI Trend Analysis ➞ | |
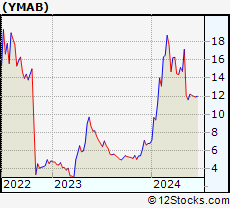 | YMAB Y-mAbs Therapeutics, Inc. |
| Sector: Health Care | |
| SubSector: Biotechnology | |
| MarketCap: 899.585 Millions | |
| Recent Price: 11.60 Smart Investing & Trading Score: 10 | |
| Day Percent Change: -2.11% Day Change: -0.25 | |
| Week Change: -3.97% Year-to-date Change: 70.1% | |
| YMAB Links: Profile News Message Board | |
| Charts:- Daily , Weekly | |
| Add YMAB to Watchlist: View: Get Complete YMAB Trend Analysis ➞ | |
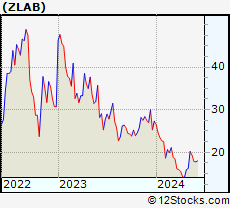 | ZLAB Zai Lab Limited |
| Sector: Health Care | |
| SubSector: Biotechnology | |
| MarketCap: 3970.35 Millions | |
| Recent Price: 19.40 Smart Investing & Trading Score: 42 | |
| Day Percent Change: -2.66% Day Change: -0.53 | |
| Week Change: -4.01% Year-to-date Change: -29.0% | |
| ZLAB Links: Profile News Message Board | |
| Charts:- Daily , Weekly | |
| Add ZLAB to Watchlist: View: Get Complete ZLAB Trend Analysis ➞ | |
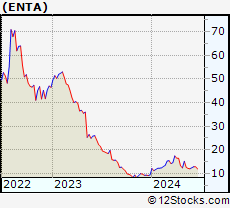 | ENTA Enanta Pharmaceuticals, Inc. |
| Sector: Health Care | |
| SubSector: Biotechnology | |
| MarketCap: 998.385 Millions | |
| Recent Price: 12.13 Smart Investing & Trading Score: 17 | |
| Day Percent Change: -7.12% Day Change: -0.93 | |
| Week Change: -4.11% Year-to-date Change: 28.9% | |
| ENTA Links: Profile News Message Board | |
| Charts:- Daily , Weekly | |
| Add ENTA to Watchlist: View: Get Complete ENTA Trend Analysis ➞ | |
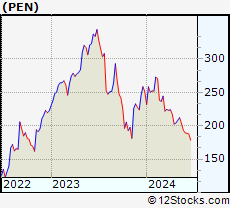 | PEN Penumbra, Inc. |
| Sector: Health Care | |
| SubSector: Medical Instruments & Supplies | |
| MarketCap: 4854.1 Millions | |
| Recent Price: 203.53 Smart Investing & Trading Score: 25 | |
| Day Percent Change: 0.99% Day Change: 2.00 | |
| Week Change: -4.12% Year-to-date Change: -19.1% | |
| PEN Links: Profile News Message Board | |
| Charts:- Daily , Weekly | |
| Add PEN to Watchlist: View: Get Complete PEN Trend Analysis ➞ | |
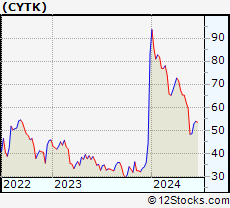 | CYTK Cytokinetics, Incorporated |
| Sector: Health Care | |
| SubSector: Biotechnology | |
| MarketCap: 654.285 Millions | |
| Recent Price: 59.53 Smart Investing & Trading Score: 18 | |
| Day Percent Change: -0.65% Day Change: -0.39 | |
| Week Change: -4.14% Year-to-date Change: -28.7% | |
| CYTK Links: Profile News Message Board | |
| Charts:- Daily , Weekly | |
| Add CYTK to Watchlist: View: Get Complete CYTK Trend Analysis ➞ | |
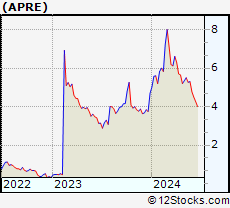 | APRE Aprea Therapeutics, Inc. |
| Sector: Health Care | |
| SubSector: Biotechnology | |
| MarketCap: 699.285 Millions | |
| Recent Price: 5.27 Smart Investing & Trading Score: 32 | |
| Day Percent Change: -5.72% Day Change: -0.32 | |
| Week Change: -4.18% Year-to-date Change: 12.1% | |
| APRE Links: Profile News Message Board | |
| Charts:- Daily , Weekly | |
| Add APRE to Watchlist: View: Get Complete APRE Trend Analysis ➞ | |
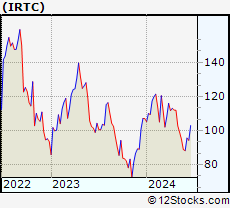 | IRTC iRhythm Technologies, Inc. |
| Sector: Health Care | |
| SubSector: Medical Instruments & Supplies | |
| MarketCap: 2167.9 Millions | |
| Recent Price: 94.83 Smart Investing & Trading Score: 0 | |
| Day Percent Change: -3.92% Day Change: -3.87 | |
| Week Change: -4.22% Year-to-date Change: -11.4% | |
| IRTC Links: Profile News Message Board | |
| Charts:- Daily , Weekly | |
| Add IRTC to Watchlist: View: Get Complete IRTC Trend Analysis ➞ | |
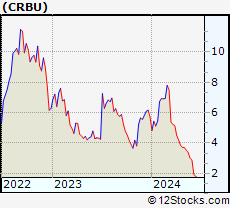 | CRBU Caribou Biosciences, Inc. |
| Sector: Health Care | |
| SubSector: Biotechnology | |
| MarketCap: 258 Millions | |
| Recent Price: 3.39 Smart Investing & Trading Score: 10 | |
| Day Percent Change: -5.57% Day Change: -0.20 | |
| Week Change: -4.24% Year-to-date Change: -40.6% | |
| CRBU Links: Profile News Message Board | |
| Charts:- Daily , Weekly | |
| Add CRBU to Watchlist: View: Get Complete CRBU Trend Analysis ➞ | |
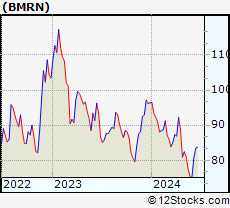 | BMRN BioMarin Pharmaceutical Inc. |
| Sector: Health Care | |
| SubSector: Biotechnology | |
| MarketCap: 14887.5 Millions | |
| Recent Price: 77.56 Smart Investing & Trading Score: 10 | |
| Day Percent Change: 0.77% Day Change: 0.59 | |
| Week Change: -4.28% Year-to-date Change: -19.6% | |
| BMRN Links: Profile News Message Board | |
| Charts:- Daily , Weekly | |
| Add BMRN to Watchlist: View: Get Complete BMRN Trend Analysis ➞ | |
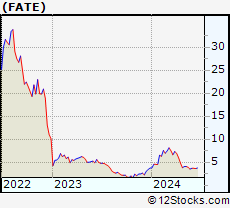 | FATE Fate Therapeutics, Inc. |
| Sector: Health Care | |
| SubSector: Biotechnology | |
| MarketCap: 2022.45 Millions | |
| Recent Price: 3.90 Smart Investing & Trading Score: 27 | |
| Day Percent Change: -5.80% Day Change: -0.24 | |
| Week Change: -4.41% Year-to-date Change: 4.3% | |
| FATE Links: Profile News Message Board | |
| Charts:- Daily , Weekly | |
| Add FATE to Watchlist: View: Get Complete FATE Trend Analysis ➞ | |
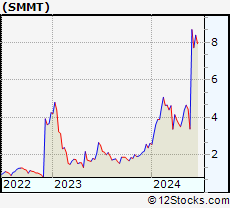 | SMMT Summit Therapeutics plc |
| Sector: Health Care | |
| SubSector: Biotechnology | |
| MarketCap: 156.985 Millions | |
| Recent Price: 4.44 Smart Investing & Trading Score: 37 | |
| Day Percent Change: -1.55% Day Change: -0.07 | |
| Week Change: -4.52% Year-to-date Change: 70.1% | |
| SMMT Links: Profile News Message Board | |
| Charts:- Daily , Weekly | |
| Add SMMT to Watchlist: View: Get Complete SMMT Trend Analysis ➞ | |
| For tabular summary view of above stock list: Summary View ➞ 0 - 25 , 25 - 50 , 50 - 75 , 75 - 100 , 100 - 125 , 125 - 150 , 150 - 175 , 175 - 200 , 200 - 225 , 225 - 250 , 250 - 275 , 275 - 300 , 300 - 325 , 325 - 350 , 350 - 375 , 375 - 400 , 400 - 425 , 425 - 450 , 450 - 475 , 475 - 500 , 500 - 525 , 525 - 550 , 550 - 575 , 575 - 600 , 600 - 625 , 625 - 650 , 650 - 675 , 675 - 700 , 700 - 725 | ||
| Click To Change The Sort Order: By Market Cap or Company Size Performance: Year-to-date, Week and Day | |
| Select Chart Type: | ||
|
Best Stocks Today 12Stocks.com |
© 2024 12Stocks.com Terms & Conditions Privacy Contact Us
All Information Provided Only For Education And Not To Be Used For Investing or Trading. See Terms & Conditions


One More Thing ... Get Best Stocks Delivered Daily!
Never Ever Miss A Move With Our Top Ten Stocks Lists
Find Best Stocks In Any Market - Bull or Bear Market
Take A Peek At Our Top Ten Stocks Lists: Daily, Weekly, Year-to-Date & Top Trends
Find Best Stocks In Any Market - Bull or Bear Market
Take A Peek At Our Top Ten Stocks Lists: Daily, Weekly, Year-to-Date & Top Trends
Healthcare Stocks With Best Up Trends [0-bearish to 100-bullish]: Nurix [100], Wave Life[100], Innate Pharma[100], Inventiva S.A[100], Harrow Health[100], Arbutus Biopharma[100], Avidity Biosciences[100], Integer [100], Quest Diagnostics[100], BeiGene [100], Zura Bio[100]
Best Healthcare Stocks Year-to-Date:
Pieris [6081.32%], Precision BioSciences[3297.26%], Inovio [2252.94%], Avenue [2216.77%], Assembly Biosciences[1671.74%], Aurora Cannabis[1449.77%], Agenus [1211.75%], NuCana [1106.9%], Adverum Biotechnologies[962.7%], Burning Rock[760.19%], Affimed N.V[738.4%] Best Healthcare Stocks This Week:
Burning Rock[946.66%], Vaxxinity [58.82%], Novavax [46.51%], Vicarious Surgical[45.62%], Harrow Health[44.48%], ProKidney [44.31%], Acutus [43.9%], Annovis Bio[40.13%], InflaRx N.V[38.14%], AC Immune[37.66%], Vaxart [36%] Best Healthcare Stocks Daily:
Vaxxinity [45.95%], Acutus [31.11%], Vicarious Surgical[27.93%], Doximity [18.07%], Orchestra BioMed[12.77%], InflaRx N.V[12.41%], Fortress Biotech[9.66%], Tenaya [9.65%], Sharecare [9.12%], AirSculpt Technologies[7.87%], Autolus [7.86%]