
 Login Sign Up


| |||||
 |  | ||||

| 12Stocks.com Market Intelligence |
12Stocks.com : Most Comprehensive Stock Education & Analysis Website
All Information Provided As-Is : Not To Be Used For Investing Decisions
All Information Provided As-Is : Not To Be Used For Investing Decisions
FANG (FAANG) Stocks & ETFs
This page discusses the trends, performances and technical charts of various stocks that make up the FANG.So what are FANG stocks in the first place? FANG is an acronym given by Jim Cramer of CNBC to a group of stocks leading the next generation technology revolution. The acronym is made up from the first letter of these four stocks (Facebook, Amazon, Netflix and Google - now called by its parent company name Alphabet).
These stocks primarily represent high growth large cap tech stocks (also, the go-to stocks of momentum traders). Since then FANG has expanded to FAANG to include Apple (some say Alibaba not Apple - take your pick).
But nowadays folks use FANG stocks to include stocks that have similar characteristics of the original four like, for instance, Nvidia.
So what are the characteristics that we look for? Answer: High growth stocks enabling next generation of technologies like Artificial Intelligence, Deep Learning (like self-driving cars), Robotics, Cloud based services, Block Chain, Crypto-currencies, etc.
So much so, recently an exchange traded fund FNG was launched to track FANG which is composed of 26 stocks - not just the original four!.
We launched this page as one place to easily keep track of the trends, performances and charts of all these stocks that make up FANG and more.
| 12Stocks.com: Investing in FAANG Stocks | |
|
The following table helps investors and traders sort through current performance and trends (as measured by market intelligence score) of various
stocks in the FANG Index. Quick View: Move mouse or cursor over stock symbol (ticker) to view short-term technical chart and over stock name to view long term chart. Click on  to add stock symbol to your watchlist and to add stock symbol to your watchlist and  to view watchlist. Click on any ticker or stock name for detailed market intelligence report for that stock. to view watchlist. Click on any ticker or stock name for detailed market intelligence report for that stock. |
12Stocks.com Performance of Stocks in FANG Index
| Ticker | Stock Name | Watchlist | Category | Recent Price | Market Intelligence Score | Change % | YTD Change% |
| GOOGL | Alphabet Inc |   | Technology | 252.45 | 90 | 1.17% | 33.58% |
| AAPL | Apple Inc | | Technology | 238.05 | 80 | -0.39% | -2.03% |
| NFLX | Netflix Inc | | Technology | 1221.26 | 80 | -0.59% | 37.73% |
| AMZN | Amazon.com Inc | | Services & Goods | 229.32 | 40 | -0.99% | 4.13% |
| BABA | Alibaba | | Services & Goods | 162.35 | 70 | -2.30% | 92.63% |
| Quick Read: Best FANG Index Stocks List By Performances & Trends: Daily, Weekly, Year-to-Date, Market Cap (Size) & Technical Trends |
12Stocks.com Performance of Stocks in Extended FANG Index
| Ticker | Stock Name | Watchlist | Category | Recent Price | Market Intelligence Score | Change % | YTD Change% |
| INTC | Intel Corp | | Technology | 31.07 | 100 | 24.78% | 53.66% |
| ETSY | Etsy Inc | | Services & Goods | 63.63 | 90 | 4.97% | 19.81% |
| MU | Micron | | Technology | 167.67 | 100 | 4.80% | 92.43% |
| ON | ON Semiconductor | | Technology | 51.74 | 80 | 3.90% | -16.16% |
| WIX | Wix.com | | Technology | 187.44 | 100 | 3.56% | -13.43% |
| SNAP | Snap Inc | | Technology | 7.99 | 80 | 3.23% | -28.91% |
| SQ | Square | | Technology | 89.50 | 70 | 2.92% | 3.17% |
| QRVO | Qorvo Inc | | Technology | 89.92 | 70 | 2.57% | 28.90% |
| TDOC | Teladoc Health | | Health Care | 8.1 | 80 | 2.53% | -20.28% |
| PTON | Peloton Interactive | | Services & Goods | 8.13 | 90 | 2.39% | -7.93% |
| DOCU | DocuSign Inc | | Technology | 86.45 | 100 | 2.28% | -4.32% |
| SHOP | Shopify Inc | | Technology | 150.91 | 90 | 2.06% | 40.34% |
| MCHP | Microchip | | Technology | 67.06 | 80 | 1.95% | 19.70% |
| ADI | Analog Devices | | Technology | 251.06 | 80 | 1.92% | 19.85% |
| ZBRA | Zebra | | Technology | 323.24 | 80 | 1.87% | -15.77% |
| NVDA | NVIDIA Corp | | Technology | 173.43 | 60 | 1.84% | 25.41% |
| ADBE | Adobe Inc | | Technology | 367.92 | 90 | 1.62% | -16.57% |
| VEEV | Veeva Systems | | Health Care | 278.89 | 50 | 1.57% | 32.44% |
| CRM | Salesforce Inc | | Technology | 245.72 | 50 | 1.45% | -25.45% |
| PANW | Palo Alto | | Technology | 205.99 | 100 | 1.41% | 13.97% |
| FTNT | Fortinet Inc | | Technology | 81.33 | 70 | 1.30% | -14.16% |
| GOOGL | Alphabet Inc | | Technology | 252.45 | 90 | 1.17% | 33.58% |
| CYBR | CyberArk Software | | Technology | 480.15 | 100 | 0.88% | 43.05% |
| APPF | Appfolio Inc | | Technology | 278.92 | 70 | 0.78% | 12.42% |
| SPOT | Spotify | | Technology | 707.19 | 70 | 0.44% | 54.48% |
| TSLA | Tesla Inc | | Services & Goods | 427.72 | 100 | 0.44% | 12.77% |
| VMW | VMware | | Technology | 35.00 | 10 | 0.32% | 0.00% |
| WORK | Slack | | Technology | 45.20 | 46 | 0.00% | NA |
| ZM | Zoom | | Technology | 86.29 | 90 | -0.01% | 5.77% |
| MSFT | Microsoft | | Technology | 509.61 | 50 | -0.08% | 22.22% |
| PYPL | PayPal | | Financials | 68.55 | 60 | -0.10% | -20.46% |
| CSCO | Cisco Systems | | Technology | 67.55 | 40 | -0.25% | 16.54% |
| ISRG | Intuitive Surgical | | Health Care | 432.14 | 0 | -0.35% | -17.54% |
| AAPL | Apple Inc | | Technology | 238.05 | 80 | -0.39% | -2.03% |
| NFLX | Netflix Inc | | Technology | 1221.26 | 80 | -0.59% | 37.73% |
| AMZN | Amazon.com Inc | | Services & Goods | 229.32 | 40 | -0.99% | 4.13% |
| BIDU | Baidu ADR | | Technology | 136.01 | 100 | -1.32% | 64.46% |
| BABA | Alibaba | | Services & Goods | 162.35 | 70 | -2.30% | 92.63% |
| DATA | Tableau Software | | Technology | 0.59 | 0 | -4.84% | 0.00% |
| NEWR | New Relic | | Technology | 50.32 | 0 | -15.80% | 0.00% |
| 12Stocks.com: Charts, Trends, Fundamental Data and Performances of FANG Stocks | |
|
We now take in-depth look at all FANG stocks including charts, multi-period performances and overall trends (as measured by market intelligence score). One can sort FANG stocks (click link to choose) by Daily, Weekly and by Year-to-Date performances. Also, one can sort by size of the company or by market capitalization. |
| Select Your Default Chart Type: | |||||
| |||||
| Click on stock symbol or name for detailed view. Click on to add stock symbol to your watchlist and to view watchlist. Quick View: Move mouse or cursor over "Daily" to quickly view daily technical stock chart and over "Weekly" to view weekly technical stock chart. | |||||


 | INTC Intel Corp |
| Sector: Technology | |
| SubSector: Semiconductors | |
| MarketCap: 107193 Millions | |
| Recent Price: 31.07 Market Intelligence Score: 100 | |
| Day Percent Change: 24.7791% Day Change: 6.17 | |
| Week Change: 25.434% Year-to-date Change: 53.7% | |
| INTC Links: Profile News Message Board | |
| Charts:- Daily , Weekly | |
| Add INTC to Watchlist: View: Get Complete INTC Trend Analysis ➞ | |
 | ETSY Etsy Inc |
| Sector: Services & Goods | |
| SubSector: Internet Retail | |
| MarketCap: 5357.81 Millions | |
| Recent Price: 63.63 Market Intelligence Score: 90 | |
| Day Percent Change: 4.96536% Day Change: 3.01 | |
| Week Change: 10.0484% Year-to-date Change: 19.8% | |
| ETSY Links: Profile News Message Board | |
| Charts:- Daily , Weekly | |
| Add ETSY to Watchlist: View: Get Complete ETSY Trend Analysis ➞ | |
 | MU Micron Technology Inc |
| Sector: Technology | |
| SubSector: Semiconductors | |
| MarketCap: 147019 Millions | |
| Recent Price: 167.67 Market Intelligence Score: 100 | |
| Day Percent Change: 4.8003% Day Change: 7.68 | |
| Week Change: 19.7643% Year-to-date Change: 92.4% | |
| MU Links: Profile News Message Board | |
| Charts:- Daily , Weekly | |
| Add MU to Watchlist: View: Get Complete MU Trend Analysis ➞ | |
 | ON ON Semiconductor Corp |
| Sector: Technology | |
| SubSector: Semiconductors | |
| MarketCap: 20082.7 Millions | |
| Recent Price: 51.74 Market Intelligence Score: 80 | |
| Day Percent Change: 3.89558% Day Change: 1.94 | |
| Week Change: 7.50052% Year-to-date Change: -16.2% | |
| ON Links: Profile News Message Board | |
| Charts:- Daily , Weekly | |
| Add ON to Watchlist: View: Get Complete ON Trend Analysis ➞ | |
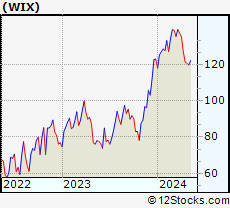 | WIX Wix.com Ltd |
| Sector: Technology | |
| SubSector: Software - Infrastructure | |
| MarketCap: 8522.8 Millions | |
| Recent Price: 187.44 Market Intelligence Score: 100 | |
| Day Percent Change: 3.56373% Day Change: 6.45 | |
| Week Change: 14.2648% Year-to-date Change: -13.4% | |
| WIX Links: Profile News Message Board | |
| Charts:- Daily , Weekly | |
| Add WIX to Watchlist: View: Get Complete WIX Trend Analysis ➞ | |
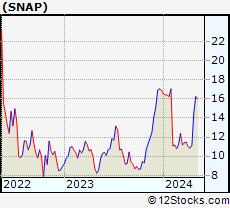 | SNAP Snap Inc |
| Sector: Technology | |
| SubSector: Internet Content & Information | |
| MarketCap: 12352.7 Millions | |
| Recent Price: 7.99 Market Intelligence Score: 80 | |
| Day Percent Change: 3.22997% Day Change: -0.11 | |
| Week Change: 9.75275% Year-to-date Change: -28.9% | |
| SNAP Links: Profile News Message Board | |
| Charts:- Daily , Weekly | |
| Add SNAP to Watchlist: View: Get Complete SNAP Trend Analysis ➞ | |
 | SQ Square, Inc. |
| Sector: Technology | |
| SubSector: Internet Software & Services | |
| MarketCap: 19323.1 Millions | |
| Recent Price: 89.50 Market Intelligence Score: 70 | |
| Day Percent Change: 2.92088% Day Change: -9999 | |
| Week Change: 8.43227% Year-to-date Change: 3.2% | |
| SQ Links: Profile News Message Board | |
| Charts:- Daily , Weekly | |
| Add SQ to Watchlist: View: Get Complete SQ Trend Analysis ➞ | |
 | QRVO Qorvo Inc |
| Sector: Technology | |
| SubSector: Semiconductors | |
| MarketCap: 8606.65 Millions | |
| Recent Price: 89.92 Market Intelligence Score: 70 | |
| Day Percent Change: 2.56644% Day Change: 2.25 | |
| Week Change: 0.818477% Year-to-date Change: 28.9% | |
| QRVO Links: Profile News Message Board | |
| Charts:- Daily , Weekly | |
| Add QRVO to Watchlist: View: Get Complete QRVO Trend Analysis ➞ | |
 | TDOC Teladoc Health Inc |
| Sector: Health Care | |
| SubSector: Health Information Services | |
| MarketCap: 1381.72 Millions | |
| Recent Price: 8.1 Market Intelligence Score: 80 | |
| Day Percent Change: 2.53% Day Change: 0.2 | |
| Week Change: 5.47% Year-to-date Change: -20.3% | |
| TDOC Links: Profile News Message Board | |
| Charts:- Daily , Weekly | |
| Add TDOC to Watchlist: View: Get Complete TDOC Trend Analysis ➞ | |
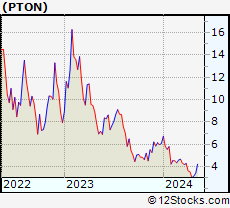 | PTON Peloton Interactive Inc |
| Sector: Services & Goods | |
| SubSector: Leisure | |
| MarketCap: 3270.26 Millions | |
| Recent Price: 8.13 Market Intelligence Score: 90 | |
| Day Percent Change: 2.39295% Day Change: -0.04 | |
| Week Change: 2.39295% Year-to-date Change: -7.9% | |
| PTON Links: Profile News Message Board | |
| Charts:- Daily , Weekly | |
| Add PTON to Watchlist: View: Get Complete PTON Trend Analysis ➞ | |
 | DOCU DocuSign Inc |
| Sector: Technology | |
| SubSector: Software - Application | |
| MarketCap: 16136.7 Millions | |
| Recent Price: 86.45 Market Intelligence Score: 100 | |
| Day Percent Change: 2.28348% Day Change: 1.93 | |
| Week Change: 9.68028% Year-to-date Change: -4.3% | |
| DOCU Links: Profile News Message Board | |
| Charts:- Daily , Weekly | |
| Add DOCU to Watchlist: View: Get Complete DOCU Trend Analysis ➞ | |
 | SHOP Shopify Inc |
| Sector: Technology | |
| SubSector: Software - Application | |
| MarketCap: 190816 Millions | |
| Recent Price: 150.91 Market Intelligence Score: 90 | |
| Day Percent Change: 2.05586% Day Change: 3.04 | |
| Week Change: 6.12518% Year-to-date Change: 40.3% | |
| SHOP Links: Profile News Message Board | |
| Charts:- Daily , Weekly | |
| Add SHOP to Watchlist: View: Get Complete SHOP Trend Analysis ➞ | |
 | MCHP Microchip Technology, Inc |
| Sector: Technology | |
| SubSector: Semiconductors | |
| MarketCap: 35575.7 Millions | |
| Recent Price: 67.06 Market Intelligence Score: 80 | |
| Day Percent Change: 1.94588% Day Change: 1.28 | |
| Week Change: 3.58356% Year-to-date Change: 19.7% | |
| MCHP Links: Profile News Message Board | |
| Charts:- Daily , Weekly | |
| Add MCHP to Watchlist: View: Get Complete MCHP Trend Analysis ➞ | |
 | ADI Analog Devices Inc |
| Sector: Technology | |
| SubSector: Semiconductors | |
| MarketCap: 121547 Millions | |
| Recent Price: 251.06 Market Intelligence Score: 80 | |
| Day Percent Change: 1.92433% Day Change: 4.74 | |
| Week Change: 1.55738% Year-to-date Change: 19.8% | |
| ADI Links: Profile News Message Board | |
| Charts:- Daily , Weekly | |
| Add ADI to Watchlist: View: Get Complete ADI Trend Analysis ➞ | |
 | ZBRA Zebra Technologies Corp |
| Sector: Technology | |
| SubSector: Communication Equipment | |
| MarketCap: 15955.2 Millions | |
| Recent Price: 323.24 Market Intelligence Score: 80 | |
| Day Percent Change: 1.86562% Day Change: 5.92 | |
| Week Change: 5.56844% Year-to-date Change: -15.8% | |
| ZBRA Links: Profile News Message Board | |
| Charts:- Daily , Weekly | |
| Add ZBRA to Watchlist: View: Get Complete ZBRA Trend Analysis ➞ | |
 | NVDA NVIDIA Corp |
| Sector: Technology | |
| SubSector: Semiconductors | |
| MarketCap: 4058590 Millions | |
| Recent Price: 173.43 Market Intelligence Score: 60 | |
| Day Percent Change: 1.84391% Day Change: 3.14 | |
| Week Change: -2.19929% Year-to-date Change: 25.4% | |
| NVDA Links: Profile News Message Board | |
| Charts:- Daily , Weekly | |
| Add NVDA to Watchlist: View: Get Complete NVDA Trend Analysis ➞ | |
 | ADBE Adobe Inc |
| Sector: Technology | |
| SubSector: Software - Application | |
| MarketCap: 148033 Millions | |
| Recent Price: 367.92 Market Intelligence Score: 90 | |
| Day Percent Change: 1.61571% Day Change: 5.85 | |
| Week Change: 5.07197% Year-to-date Change: -16.6% | |
| ADBE Links: Profile News Message Board | |
| Charts:- Daily , Weekly | |
| Add ADBE to Watchlist: View: Get Complete ADBE Trend Analysis ➞ | |
 | VEEV Veeva Systems Inc |
| Sector: Health Care | |
| SubSector: Health Information Services | |
| MarketCap: 44735.4 Millions | |
| Recent Price: 278.89 Market Intelligence Score: 50 | |
| Day Percent Change: 1.56967% Day Change: 4.31 | |
| Week Change: 1.56227% Year-to-date Change: 32.4% | |
| VEEV Links: Profile News Message Board | |
| Charts:- Daily , Weekly | |
| Add VEEV to Watchlist: View: Get Complete VEEV Trend Analysis ➞ | |
 | CRM Salesforce Inc |
| Sector: Technology | |
| SubSector: Software - Application | |
| MarketCap: 238724 Millions | |
| Recent Price: 245.72 Market Intelligence Score: 50 | |
| Day Percent Change: 1.44916% Day Change: 3.51 | |
| Week Change: 1.29859% Year-to-date Change: -25.5% | |
| CRM Links: Profile News Message Board | |
| Charts:- Daily , Weekly | |
| Add CRM to Watchlist: View: Get Complete CRM Trend Analysis ➞ | |
 | PANW Palo Alto Networks Inc |
| Sector: Technology | |
| SubSector: Software - Infrastructure | |
| MarketCap: 130074 Millions | |
| Recent Price: 205.99 Market Intelligence Score: 100 | |
| Day Percent Change: 1.41296% Day Change: 2.87 | |
| Week Change: 4.38859% Year-to-date Change: 14.0% | |
| PANW Links: Profile News Message Board | |
| Charts:- Daily , Weekly | |
| Add PANW to Watchlist: View: Get Complete PANW Trend Analysis ➞ | |
 | FTNT Fortinet Inc |
| Sector: Technology | |
| SubSector: Software - Infrastructure | |
| MarketCap: 60404.8 Millions | |
| Recent Price: 81.33 Market Intelligence Score: 70 | |
| Day Percent Change: 1.2953% Day Change: 1.04 | |
| Week Change: 2.32763% Year-to-date Change: -14.2% | |
| FTNT Links: Profile News Message Board | |
| Charts:- Daily , Weekly | |
| Add FTNT to Watchlist: View: Get Complete FTNT Trend Analysis ➞ | |
 | GOOGL Alphabet Inc |
| Sector: Technology | |
| SubSector: Internet Content & Information | |
| MarketCap: 2843010 Millions | |
| Recent Price: 252.45 Market Intelligence Score: 90 | |
| Day Percent Change: 1.1702% Day Change: 2.92 | |
| Week Change: 5.55254% Year-to-date Change: 33.6% | |
| GOOGL Links: Profile News Message Board | |
| Charts:- Daily , Weekly | |
| Add GOOGL to Watchlist: View: Get Complete GOOGL Trend Analysis ➞ | |
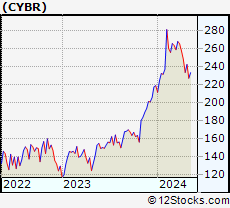 | CYBR CyberArk Software Ltd |
| Sector: Technology | |
| SubSector: Software - Infrastructure | |
| MarketCap: 23326.9 Millions | |
| Recent Price: 480.15 Market Intelligence Score: 100 | |
| Day Percent Change: 0.884565% Day Change: -3.56 | |
| Week Change: 2.59089% Year-to-date Change: 43.0% | |
| CYBR Links: Profile News Message Board | |
| Charts:- Daily , Weekly | |
| Add CYBR to Watchlist: View: Get Complete CYBR Trend Analysis ➞ | |
 | APPF Appfolio Inc |
| Sector: Technology | |
| SubSector: Software - Application | |
| MarketCap: 10211.2 Millions | |
| Recent Price: 278.92 Market Intelligence Score: 70 | |
| Day Percent Change: 0.784101% Day Change: 2.17 | |
| Week Change: 0.795027% Year-to-date Change: 12.4% | |
| APPF Links: Profile News Message Board | |
| Charts:- Daily , Weekly | |
| Add APPF to Watchlist: View: Get Complete APPF Trend Analysis ➞ | |
 | SPOT Spotify Technology S.A |
| Sector: Technology | |
| SubSector: Internet Content & Information | |
| MarketCap: 143360 Millions | |
| Recent Price: 707.19 Market Intelligence Score: 70 | |
| Day Percent Change: 0.444564% Day Change: -14.32 | |
| Week Change: -1.66444% Year-to-date Change: 54.5% | |
| SPOT Links: Profile News Message Board | |
| Charts:- Daily , Weekly | |
| Add SPOT to Watchlist: View: Get Complete SPOT Trend Analysis ➞ | |
 | TSLA Tesla Inc |
| Sector: Services & Goods | |
| SubSector: Auto Manufacturers | |
| MarketCap: 1131620 Millions | |
| Recent Price: 427.72 Market Intelligence Score: 100 | |
| Day Percent Change: 0.436763% Day Change: 1.86 | |
| Week Change: 22.9823% Year-to-date Change: 12.8% | |
| TSLA Links: Profile News Message Board | |
| Charts:- Daily , Weekly | |
| Add TSLA to Watchlist: View: Get Complete TSLA Trend Analysis ➞ | |
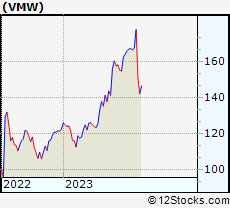 | VMW VMware, Inc. |
| Sector: Technology | |
| SubSector: Technical & System Software | |
| MarketCap: 46949.8 Millions | |
| Recent Price: 35.00 Market Intelligence Score: 10 | |
| Day Percent Change: 0.315277% Day Change: -9999 | |
| Week Change: -76.6527% Year-to-date Change: 0.0% | |
| VMW Links: Profile News Message Board | |
| Charts:- Daily , Weekly | |
| Add VMW to Watchlist: View: Get Complete VMW Trend Analysis ➞ | |
 | WORK Slack Technologies, Inc. |
| Sector: Technology | |
| SubSector: Application Software | |
| MarketCap: 13535.8 Millions | |
| Recent Price: 45.20 Market Intelligence Score: 46 | |
| Day Percent Change: 0% Day Change: -9999 | |
| Week Change: 9999% Year-to-date Change: 9,999.0% | |
| WORK Links: Profile News Message Board | |
| Charts:- Daily , Weekly | |
| Add WORK to Watchlist: View: Get Complete WORK Trend Analysis ➞ | |
 | ZM Zoom Communications Inc |
| Sector: Technology | |
| SubSector: Software - Application | |
| MarketCap: 25044.6 Millions | |
| Recent Price: 86.29 Market Intelligence Score: 90 | |
| Day Percent Change: -0.0115875% Day Change: -0.01 | |
| Week Change: 3.00824% Year-to-date Change: 5.8% | |
| ZM Links: Profile News Message Board | |
| Charts:- Daily , Weekly | |
| Add ZM to Watchlist: View: Get Complete ZM Trend Analysis ➞ | |
 | MSFT Microsoft Corporation |
| Sector: Technology | |
| SubSector: Software - Infrastructure | |
| MarketCap: 3679420 Millions | |
| Recent Price: 509.61 Market Intelligence Score: 50 | |
| Day Percent Change: -0.080389% Day Change: -0.41 | |
| Week Change: 1.84663% Year-to-date Change: 22.2% | |
| MSFT Links: Profile News Message Board | |
| Charts:- Daily , Weekly | |
| Add MSFT to Watchlist: View: Get Complete MSFT Trend Analysis ➞ | |
 | PYPL PayPal Holdings Inc |
| Sector: Financials | |
| SubSector: Credit Services | |
| MarketCap: 65214.1 Millions | |
| Recent Price: 68.55 Market Intelligence Score: 60 | |
| Day Percent Change: -0.102011% Day Change: -0.07 | |
| Week Change: 4.43327% Year-to-date Change: -20.5% | |
| PYPL Links: Profile News Message Board | |
| Charts:- Daily , Weekly | |
| Add PYPL to Watchlist: View: Get Complete PYPL Trend Analysis ➞ | |
 | CSCO Cisco Systems, Inc |
| Sector: Technology | |
| SubSector: Communication Equipment | |
| MarketCap: 264469 Millions | |
| Recent Price: 67.55 Market Intelligence Score: 40 | |
| Day Percent Change: -0.251034% Day Change: -0.17 | |
| Week Change: -0.865864% Year-to-date Change: 16.5% | |
| CSCO Links: Profile News Message Board | |
| Charts:- Daily , Weekly | |
| Add CSCO to Watchlist: View: Get Complete CSCO Trend Analysis ➞ | |
 | ISRG Intuitive Surgical Inc |
| Sector: Health Care | |
| SubSector: Medical Instruments & Supplies | |
| MarketCap: 167358 Millions | |
| Recent Price: 432.14 Market Intelligence Score: 0 | |
| Day Percent Change: -0.350505% Day Change: -1.52 | |
| Week Change: -3.96462% Year-to-date Change: -17.5% | |
| ISRG Links: Profile News Message Board | |
| Charts:- Daily , Weekly | |
| Add ISRG to Watchlist: View: Get Complete ISRG Trend Analysis ➞ | |
 | AAPL Apple Inc |
| Sector: Technology | |
| SubSector: Consumer Electronics | |
| MarketCap: 3557090 Millions | |
| Recent Price: 238.05 Market Intelligence Score: 80 | |
| Day Percent Change: -0.393322% Day Change: -0.94 | |
| Week Change: 4.96495% Year-to-date Change: -2.0% | |
| AAPL Links: Profile News Message Board | |
| Charts:- Daily , Weekly | |
| Add AAPL to Watchlist: View: Get Complete AAPL Trend Analysis ➞ | |
 | NFLX Netflix Inc |
| Sector: Technology | |
| SubSector: Entertainment | |
| MarketCap: 528532 Millions | |
| Recent Price: 1221.26 Market Intelligence Score: 80 | |
| Day Percent Change: -0.589337% Day Change: -7.24 | |
| Week Change: -2.11988% Year-to-date Change: 37.7% | |
| NFLX Links: Profile News Message Board | |
| Charts:- Daily , Weekly | |
| Add NFLX to Watchlist: View: Get Complete NFLX Trend Analysis ➞ | |
 | AMZN Amazon.com Inc |
| Sector: Services & Goods | |
| SubSector: Internet Retail | |
| MarketCap: 2477780 Millions | |
| Recent Price: 229.32 Market Intelligence Score: 40 | |
| Day Percent Change: -0.993006% Day Change: -2.3 | |
| Week Change: -0.438501% Year-to-date Change: 4.1% | |
| AMZN Links: Profile News Message Board | |
| Charts:- Daily , Weekly | |
| Add AMZN to Watchlist: View: Get Complete AMZN Trend Analysis ➞ | |
 | BIDU Baidu Inc ADR |
| Sector: Technology | |
| SubSector: Internet Content & Information | |
| MarketCap: 28539.6 Millions | |
| Recent Price: 136.01 Market Intelligence Score: 100 | |
| Day Percent Change: -1.32047% Day Change: -1.82 | |
| Week Change: 26.4033% Year-to-date Change: 64.5% | |
| BIDU Links: Profile News Message Board | |
| Charts:- Daily , Weekly | |
| Add BIDU to Watchlist: View: Get Complete BIDU Trend Analysis ➞ | |
 | BABA Alibaba Group Holding Ltd ADR |
| Sector: Services & Goods | |
| SubSector: Internet Retail | |
| MarketCap: 302968 Millions | |
| Recent Price: 162.35 Market Intelligence Score: 70 | |
| Day Percent Change: -2.29885% Day Change: -3.82 | |
| Week Change: 12.7979% Year-to-date Change: 92.6% | |
| BABA Links: Profile News Message Board | |
| Charts:- Daily , Weekly | |
| Add BABA to Watchlist: View: Get Complete BABA Trend Analysis ➞ | |
 | DATA Tableau Software, Inc. |
| Sector: Technology | |
| SubSector: Application Software | |
| MarketCap: 3906.16 Millions | |
| Recent Price: 0.59 Market Intelligence Score: 0 | |
| Day Percent Change: -4.83871% Day Change: -9999 | |
| Week Change: -98.1035% Year-to-date Change: 0.0% | |
| DATA Links: Profile News Message Board | |
| Charts:- Daily , Weekly | |
| Add DATA to Watchlist: View: Get Complete DATA Trend Analysis ➞ | |
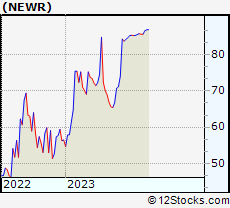 | NEWR New Relic, Inc. |
| Sector: Technology | |
| SubSector: Business Software & Services | |
| MarketCap: 2627.28 Millions | |
| Recent Price: 50.32 Market Intelligence Score: 0 | |
| Day Percent Change: -15.7965% Day Change: -9999 | |
| Week Change: -42.141% Year-to-date Change: 0.0% | |
| NEWR Links: Profile News Message Board | |
| Charts:- Daily , Weekly | |
| Add NEWR to Watchlist: View: Get Complete NEWR Trend Analysis ➞ | |
© 2025 12Stocks.com Terms & Conditions Privacy Contact Us
All Information Provided Only For Education And Not To Be Used For Investing or Trading. See Terms & Conditions


One More Thing ... Get Best Stocks Delivered Daily!
Never Ever Miss A Move With Our Top Ten Stocks Lists
Get Best Performing Stocks, Daily Market Trends & Insight
Take A Peek At Our Top Ten Stocks Lists: Daily, Weekly, Year-to-Date & Top Trends
Get Best Performing Stocks, Daily Market Trends & Insight
Take A Peek At Our Top Ten Stocks Lists: Daily, Weekly, Year-to-Date & Top Trends
Dow Stocks With Best Current Trends [0-bearish to 100-bullish]: Intel Corp[100], Ultra[100], Goldman Sachs[100], Caterpillar Inc[100], American Express[100], Exxon Mobil[100], Walmart Inc[90], JPMorgan Chase[90], Chevron Corp[80], Travelers [70] Best S&P 500 Stocks Year-to-Date Update:
Seagate [153.661%], Western Digital[123.146%], Newmont Corp[105.07%], Micron [92.4269%], NRG Energy[78.9866%], Oracle Corp[78.9527%], Lam Research[75.7983%], GE Aerospace[74.5392%], Amphenol Corp[74.2975%], CVS Health[72.3146%] Best Nasdaq 100 Stocks Weekly Update:
Splunk [38.7643%], Intel Corp[25.434%], Tesla Inc[22.9823%], Micron [19.7643%], Synopsys Inc[18.6704%], Lam Research[17.9676%], ASML Holding[17.4774%], Crowdstrike [15.6777%], Applied Materials[14.4291%], KLA Corp[13.2839%] Today's Stock Market In A Nutshell:US Small Cap [1%], US Mid Cap [0.6%], US Dollar [0.5%], US Large Cap [0.3%], Oil [0.2%], India [0.1%], Bonds [-0.2%], Europe [-0.4%], Euro [-0.5%], Gold [-0.7%], Emerging Markets [-0.8%], China [-1.7%],