
 Login Sign Up


| |||||
 |  | ||||

| 12Stocks.com Market Intelligence |
Best Energy Stocks
| In a hurry? Energy Stocks Lists: Performance Trends Table, Stock Charts
Sort Energy stocks: Daily, Weekly, Year-to-Date, Market Cap & Trends. Filter Energy stocks list by size: All Energy Large Mid-Range Small & MicroCap |
| 12Stocks.com Energy Stocks Performances & Trends Daily | |||||||||
|
|  The overall Smart Investing & Trading Score is 54 (0-bearish to 100-bullish) which puts Energy sector in short term neutral trend. The Smart Investing & Trading Score from previous trading session is 61 and hence a deterioration of trend.
| ||||||||
Here are the Smart Investing & Trading Scores of the most requested Energy stocks at 12Stocks.com (click stock name for detailed review):
|


| 12Stocks.com: Investing in Energy sector with Stocks | |
|
The following table helps investors and traders sort through current performance and trends (as measured by Smart Investing & Trading Score) of various
stocks in the Energy sector. Quick View: Move mouse or cursor over stock symbol (ticker) to view short-term Technical chart and over stock name to view long term chart. Click on  to add stock symbol to your watchlist and to add stock symbol to your watchlist and  to view watchlist. Click on any ticker or stock name for detailed market intelligence report for that stock. to view watchlist. Click on any ticker or stock name for detailed market intelligence report for that stock. |
12Stocks.com Performance of Stocks in Energy Sector
| Ticker | Stock Name | Watchlist | Category | Recent Price | Smart Investing & Trading Score | Change % | YTD Change% |
| TXO | TXO Partners |   | E&P | 19.11 | 50 | 7.27 | 6.73% |
| DO | Diamond Offshore | | Drilling | 14.66 | 100 | 6.93 | 12.17% |
| CRGY | Crescent | | E&P | 12.31 | 100 | 3.66 | -6.71% |
| VTS | Vitesse | | E&P | 24.84 | 100 | 3.13 | 12.22% |
| SUN | Sunoco LP | | Refining | 56.94 | 37 | 2.43 | -4.99% |
| VAL | Valaris | | Equipment | 73.59 | 95 | 2.35 | 7.32% |
| CLB | Core | | Equipment | 16.45 | 68 | 2.30 | -6.85% |
| GPRK | GeoPark | | Drilling & Exploration | 9.66 | 68 | 2.22 | 12.72% |
| YPF | YPF Sociedad | | Integrated | 24.46 | 100 | 1.79 | 42.29% |
| PBT | Permian Basin | | Independent | 12.38 | 59 | 1.73 | -11.32% |
| NE | Noble | | Drilling | 46.40 | 51 | 1.67 | -3.65% |
| FLNG | Flex LNG | | Equipment | 27.44 | 100 | 1.67 | -5.57% |
| NGL | NGL | | Refining | 5.95 | 52 | 1.62 | 6.73% |
| DRQ | Dril-Quip | | Equipment | 19.22 | 25 | 1.59 | -17.40% |
| HLX | Helix | | Equipment | 11.55 | 100 | 1.58 | 12.35% |
| PAGP | Plains GP | | Pipelines | 18.54 | 51 | 1.48 | 16.24% |
| BRY | Berry | | Independent | 7.79 | 33 | 1.37 | 10.74% |
| PBA | Pembina Pipeline | | Pipelines | 36.47 | 100 | 1.22 | 5.96% |
| PSX | Phillips 66 | | Refining | 146.95 | 58 | 1.20 | 10.37% |
| NGS | Natural Gas | | Equipment | 23.36 | 68 | 1.15 | 45.30% |
| ENLC | EnLink Midstream | | Pipelines | 13.31 | 58 | 1.14 | 9.46% |
| ENB | Enbridge | | Pipelines | 37.24 | 100 | 1.13 | 3.40% |
| PAA | Plains All | | Pipelines | 17.67 | 43 | 1.03 | 16.63% |
| TRP | TC | | Pipelines | 37.87 | 60 | 0.97 | -3.13% |
| USAC | USA Compression | | Equipment | 25.18 | 64 | 0.96 | 10.29% |
| For chart view version of above stock list: Chart View ➞ 0 - 25 , 25 - 50 , 50 - 75 , 75 - 100 , 100 - 125 , 125 - 150 | ||
 | Click To Change The Sort Order: By Market Cap or Company Size Performance: Year-to-date, Week and Day |  |
|
Get the most comprehensive stock market coverage daily at 12Stocks.com ➞ Best Stocks Today ➞ Best Stocks Weekly ➞ Best Stocks Year-to-Date ➞ Best Stocks Trends ➞  Best Stocks Today 12Stocks.com Best Nasdaq Stocks ➞ Best S&P 500 Stocks ➞ Best Tech Stocks ➞ Best Biotech Stocks ➞ |
| Detailed Overview of Energy Stocks |
| Energy Technical Overview, Leaders & Laggards, Top Energy ETF Funds & Detailed Energy Stocks List, Charts, Trends & More |
| Energy Sector: Technical Analysis, Trends & YTD Performance | |
| Energy sector is composed of stocks
from oil production, refining, exploration, drilling
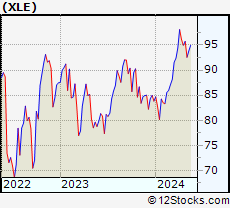
and services subsectors. Energy sector, as represented by XLE, an exchange-traded fund [ETF] that holds basket of Energy stocks (e.g, Exxon, Halliburton) is up by 11.01% and is currently outperforming the overall market by 2.96% year-to-date. Below is a quick view of Technical charts and trends: |
|
 XLE Weekly Chart |
|
| Long Term Trend: Very Good | |
| Medium Term Trend: Not Good | |
 XLE Daily Chart |
|
| Short Term Trend: Very Good | |
| Overall Trend Score: 54 | |
| YTD Performance: 11.01% | |
| **Trend Scores & Views Are Only For Educational Purposes And Not For Investing | |
| 12Stocks.com: Top Performing Energy Sector Stocks | ||||||||||||||||||||||||||||||||||||||||||||||||
 The top performing Energy sector stocks year to date are
Now, more recently, over last week, the top performing Energy sector stocks on the move are


|
||||||||||||||||||||||||||||||||||||||||||||||||
| 12Stocks.com: Investing in Energy Sector using Exchange Traded Funds | |
|
The following table shows list of key exchange traded funds (ETF) that
help investors track Energy Index. For detailed view, check out our ETF Funds section of our website. Quick View: Move mouse or cursor over ETF symbol (ticker) to view short-term Technical chart and over ETF name to view long term chart. Click on ticker or stock name for detailed view. Click on to add stock symbol to your watchlist and to view watchlist. |
12Stocks.com List of ETFs that track Energy Index
| Ticker | ETF Name | Watchlist | Recent Price | Smart Investing & Trading Score | Change % | Week % | Year-to-date % |
| XLE | Energy | | 93.07 | 54 | -0.15 | 0.54 | 11.01% |
| OIH | Oil Services | | 318.92 | 61 | -0.32 | 1.35 | 3.04% |
| USO | Oil | | 76.14 | 51 | 0.84 | 1.34 | 14.23% |
| UNG | Natural Gas | | 15.97 | 69 | -1.27 | 1.88 | 214.89% |
| BNO | Brent Oil | | 31.14 | 44 | 0.65 | 1.01 | 14.02% |
| IYE | Energy | | 48.78 | 54 | -0.04 | 0.68 | 10.56% |
| PBW | Clean Energy | | 21.46 | 42 | -1.15 | -1.29 | -27.79% |
| ERX | Energy Bull 3X | | 68.14 | 56 | -0.25 | 1.13 | 20.45% |
| ERY | Energy Bear 3X | | 22.41 | 39 | -0.11 | -1.34 | -19.75% |
| DIG | Oil & Gas | | 44.07 | 54 | -0.59 | 0.73 | 19.95% |
| DUG | Short Oil & | | 9.46 | 39 | 0.69 | -0.73 | -18.66% |
| XOP | Oil & Gas | | 151.63 | 61 | -0.48 | 0.94 | 10.76% |
| XES | Oil & Gas | | 91.92 | 76 | -0.02 | 1.84 | 8.77% |
| ICLN | Global Clean Energy | | 13.86 | 55 | -0.75 | 0.04 | -11.01% |
| PSCE | SmallCap Energy | | 54.40 | 51 | -0.96 | 0.67 | 4.52% |
| IEO | Oil&Gas Explor&Prodtn | | 104.25 | 54 | -0.11 | 0.77 | 11.87% |
| 12Stocks.com: Charts, Trends, Fundamental Data and Performances of Energy Stocks | |
|
We now take in-depth look at all Energy stocks including charts, multi-period performances and overall trends (as measured by Smart Investing & Trading Score). One can sort Energy stocks (click link to choose) by Daily, Weekly and by Year-to-Date performances. Also, one can sort by size of the company or by market capitalization. |
| Select Your Default Chart Type: | |||||
| |||||
| Click on stock symbol or name for detailed view. Click on to add stock symbol to your watchlist and to view watchlist. Quick View: Move mouse or cursor over "Daily" to quickly view daily Technical stock chart and over "Weekly" to view weekly Technical stock chart. | |||||

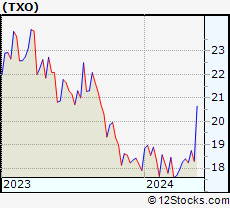 | TXO TXO Partners L.P. |
| Sector: Energy | |
| SubSector: Oil & Gas E&P | |
| MarketCap: 671 Millions | |
| Recent Price: 19.11 Smart Investing & Trading Score: 50 | |
| Day Percent Change: 7.27% Day Change: 1.30 | |
| Week Change: 4.4% Year-to-date Change: 6.7% | |
| TXO Links: Profile News Message Board | |
| Charts:- Daily , Weekly | |
| Add TXO to Watchlist: View: Get Complete TXO Trend Analysis ➞ | |
 | DO Diamond Offshore Drilling, Inc. |
| Sector: Energy | |
| SubSector: Oil & Gas Drilling | |
| MarketCap: 1340 Millions | |
| Recent Price: 14.66 Smart Investing & Trading Score: 100 | |
| Day Percent Change: 6.93% Day Change: 0.95 | |
| Week Change: 13.47% Year-to-date Change: 12.2% | |
| DO Links: Profile News Message Board | |
| Charts:- Daily , Weekly | |
| Add DO to Watchlist: View: Get Complete DO Trend Analysis ➞ | |
 | CRGY Crescent Energy Company |
| Sector: Energy | |
| SubSector: Oil & Gas E&P | |
| MarketCap: 1700 Millions | |
| Recent Price: 12.31 Smart Investing & Trading Score: 100 | |
| Day Percent Change: 3.66% Day Change: 0.44 | |
| Week Change: 17.3% Year-to-date Change: -6.7% | |
| CRGY Links: Profile News Message Board | |
| Charts:- Daily , Weekly | |
| Add CRGY to Watchlist: View: Get Complete CRGY Trend Analysis ➞ | |
 | VTS Vitesse Energy, Inc. |
| Sector: Energy | |
| SubSector: Oil & Gas E&P | |
| MarketCap: 639 Millions | |
| Recent Price: 24.84 Smart Investing & Trading Score: 100 | |
| Day Percent Change: 3.13% Day Change: 0.75 | |
| Week Change: 11.96% Year-to-date Change: 12.2% | |
| VTS Links: Profile News Message Board | |
| Charts:- Daily , Weekly | |
| Add VTS to Watchlist: View: Get Complete VTS Trend Analysis ➞ | |
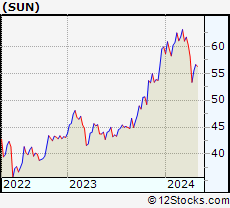 | SUN Sunoco LP |
| Sector: Energy | |
| SubSector: Oil & Gas Refining & Marketing | |
| MarketCap: 1656.34 Millions | |
| Recent Price: 56.94 Smart Investing & Trading Score: 37 | |
| Day Percent Change: 2.43% Day Change: 1.35 | |
| Week Change: 1.84% Year-to-date Change: -5.0% | |
| SUN Links: Profile News Message Board | |
| Charts:- Daily , Weekly | |
| Add SUN to Watchlist: View: Get Complete SUN Trend Analysis ➞ | |
 | VAL Valaris Limited |
| Sector: Energy | |
| SubSector: Oil & Gas Equipment & Services | |
| MarketCap: 4520 Millions | |
| Recent Price: 73.59 Smart Investing & Trading Score: 95 | |
| Day Percent Change: 2.35% Day Change: 1.69 | |
| Week Change: 7.82% Year-to-date Change: 7.3% | |
| VAL Links: Profile News Message Board | |
| Charts:- Daily , Weekly | |
| Add VAL to Watchlist: View: Get Complete VAL Trend Analysis ➞ | |
 | CLB Core Laboratories N.V. |
| Sector: Energy | |
| SubSector: Oil & Gas Equipment & Services | |
| MarketCap: 599.661 Millions | |
| Recent Price: 16.45 Smart Investing & Trading Score: 68 | |
| Day Percent Change: 2.30% Day Change: 0.37 | |
| Week Change: 3.33% Year-to-date Change: -6.9% | |
| CLB Links: Profile News Message Board | |
| Charts:- Daily , Weekly | |
| Add CLB to Watchlist: View: Get Complete CLB Trend Analysis ➞ | |
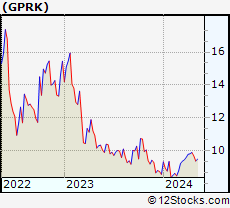 | GPRK GeoPark Limited |
| Sector: Energy | |
| SubSector: Oil & Gas Drilling & Exploration | |
| MarketCap: 397.639 Millions | |
| Recent Price: 9.66 Smart Investing & Trading Score: 68 | |
| Day Percent Change: 2.22% Day Change: 0.21 | |
| Week Change: 2.99% Year-to-date Change: 12.7% | |
| GPRK Links: Profile News Message Board | |
| Charts:- Daily , Weekly | |
| Add GPRK to Watchlist: View: Get Complete GPRK Trend Analysis ➞ | |
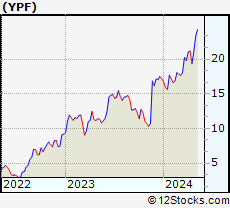 | YPF YPF Sociedad Anonima |
| Sector: Energy | |
| SubSector: Major Integrated Oil & Gas | |
| MarketCap: 2272.35 Millions | |
| Recent Price: 24.46 Smart Investing & Trading Score: 100 | |
| Day Percent Change: 1.79% Day Change: 0.43 | |
| Week Change: 4.62% Year-to-date Change: 42.3% | |
| YPF Links: Profile News Message Board | |
| Charts:- Daily , Weekly | |
| Add YPF to Watchlist: View: Get Complete YPF Trend Analysis ➞ | |
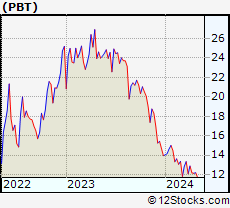 | PBT Permian Basin Royalty Trust |
| Sector: Energy | |
| SubSector: Independent Oil & Gas | |
| MarketCap: 132.693 Millions | |
| Recent Price: 12.38 Smart Investing & Trading Score: 59 | |
| Day Percent Change: 1.73% Day Change: 0.21 | |
| Week Change: 5.81% Year-to-date Change: -11.3% | |
| PBT Links: Profile News Message Board | |
| Charts:- Daily , Weekly | |
| Add PBT to Watchlist: View: Get Complete PBT Trend Analysis ➞ | |
 | NE Noble Corporation Plc |
| Sector: Energy | |
| SubSector: Oil & Gas Drilling | |
| MarketCap: 5520 Millions | |
| Recent Price: 46.40 Smart Investing & Trading Score: 51 | |
| Day Percent Change: 1.67% Day Change: 0.76 | |
| Week Change: 2.45% Year-to-date Change: -3.7% | |
| NE Links: Profile News Message Board | |
| Charts:- Daily , Weekly | |
| Add NE to Watchlist: View: Get Complete NE Trend Analysis ➞ | |
 | FLNG Flex LNG Ltd. |
| Sector: Energy | |
| SubSector: Oil & Gas Equipment & Services | |
| MarketCap: 220.261 Millions | |
| Recent Price: 27.44 Smart Investing & Trading Score: 100 | |
| Day Percent Change: 1.67% Day Change: 0.45 | |
| Week Change: 3.16% Year-to-date Change: -5.6% | |
| FLNG Links: Profile News Message Board | |
| Charts:- Daily , Weekly | |
| Add FLNG to Watchlist: View: Get Complete FLNG Trend Analysis ➞ | |
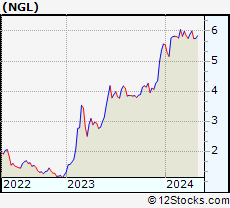 | NGL NGL Energy Partners LP |
| Sector: Energy | |
| SubSector: Oil & Gas Refining & Marketing | |
| MarketCap: 551.354 Millions | |
| Recent Price: 5.95 Smart Investing & Trading Score: 52 | |
| Day Percent Change: 1.62% Day Change: 0.10 | |
| Week Change: 0.59% Year-to-date Change: 6.7% | |
| NGL Links: Profile News Message Board | |
| Charts:- Daily , Weekly | |
| Add NGL to Watchlist: View: Get Complete NGL Trend Analysis ➞ | |
 | DRQ Dril-Quip, Inc. |
| Sector: Energy | |
| SubSector: Oil & Gas Equipment & Services | |
| MarketCap: 1211.61 Millions | |
| Recent Price: 19.22 Smart Investing & Trading Score: 25 | |
| Day Percent Change: 1.59% Day Change: 0.30 | |
| Week Change: 3.33% Year-to-date Change: -17.4% | |
| DRQ Links: Profile News Message Board | |
| Charts:- Daily , Weekly | |
| Add DRQ to Watchlist: View: Get Complete DRQ Trend Analysis ➞ | |
 | HLX Helix Energy Solutions Group, Inc. |
| Sector: Energy | |
| SubSector: Oil & Gas Equipment & Services | |
| MarketCap: 341.661 Millions | |
| Recent Price: 11.55 Smart Investing & Trading Score: 100 | |
| Day Percent Change: 1.58% Day Change: 0.18 | |
| Week Change: 5.48% Year-to-date Change: 12.4% | |
| HLX Links: Profile News Message Board | |
| Charts:- Daily , Weekly | |
| Add HLX to Watchlist: View: Get Complete HLX Trend Analysis ➞ | |
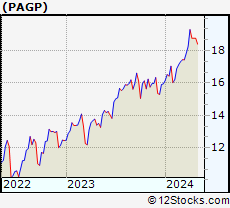 | PAGP Plains GP Holdings, L.P. |
| Sector: Energy | |
| SubSector: Oil & Gas Pipelines | |
| MarketCap: 1885.15 Millions | |
| Recent Price: 18.54 Smart Investing & Trading Score: 51 | |
| Day Percent Change: 1.48% Day Change: 0.27 | |
| Week Change: 0.76% Year-to-date Change: 16.2% | |
| PAGP Links: Profile News Message Board | |
| Charts:- Daily , Weekly | |
| Add PAGP to Watchlist: View: Get Complete PAGP Trend Analysis ➞ | |
 | BRY Berry Corporation |
| Sector: Energy | |
| SubSector: Independent Oil & Gas | |
| MarketCap: 254.793 Millions | |
| Recent Price: 7.79 Smart Investing & Trading Score: 33 | |
| Day Percent Change: 1.37% Day Change: 0.11 | |
| Week Change: -2.69% Year-to-date Change: 10.7% | |
| BRY Links: Profile News Message Board | |
| Charts:- Daily , Weekly | |
| Add BRY to Watchlist: View: Get Complete BRY Trend Analysis ➞ | |
 | PBA Pembina Pipeline Corporation |
| Sector: Energy | |
| SubSector: Oil & Gas Pipelines | |
| MarketCap: 8813.35 Millions | |
| Recent Price: 36.47 Smart Investing & Trading Score: 100 | |
| Day Percent Change: 1.22% Day Change: 0.44 | |
| Week Change: 2.7% Year-to-date Change: 6.0% | |
| PBA Links: Profile News Message Board | |
| Charts:- Daily , Weekly | |
| Add PBA to Watchlist: View: Get Complete PBA Trend Analysis ➞ | |
 | PSX Phillips 66 |
| Sector: Energy | |
| SubSector: Oil & Gas Refining & Marketing | |
| MarketCap: 25253.6 Millions | |
| Recent Price: 146.95 Smart Investing & Trading Score: 58 | |
| Day Percent Change: 1.20% Day Change: 1.74 | |
| Week Change: 2.33% Year-to-date Change: 10.4% | |
| PSX Links: Profile News Message Board | |
| Charts:- Daily , Weekly | |
| Add PSX to Watchlist: View: Get Complete PSX Trend Analysis ➞ | |
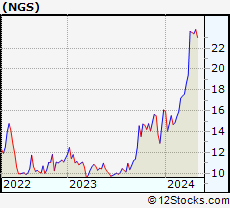 | NGS Natural Gas Services Group, Inc. |
| Sector: Energy | |
| SubSector: Oil & Gas Equipment & Services | |
| MarketCap: 803.461 Millions | |
| Recent Price: 23.36 Smart Investing & Trading Score: 68 | |
| Day Percent Change: 1.15% Day Change: 0.26 | |
| Week Change: 4.35% Year-to-date Change: 45.3% | |
| NGS Links: Profile News Message Board | |
| Charts:- Daily , Weekly | |
| Add NGS to Watchlist: View: Get Complete NGS Trend Analysis ➞ | |
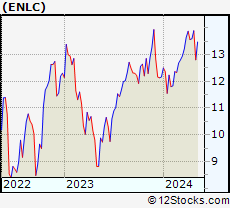 | ENLC EnLink Midstream, LLC |
| Sector: Energy | |
| SubSector: Oil & Gas Pipelines | |
| MarketCap: 719.655 Millions | |
| Recent Price: 13.31 Smart Investing & Trading Score: 58 | |
| Day Percent Change: 1.14% Day Change: 0.15 | |
| Week Change: 3.98% Year-to-date Change: 9.5% | |
| ENLC Links: Profile News Message Board | |
| Charts:- Daily , Weekly | |
| Add ENLC to Watchlist: View: Get Complete ENLC Trend Analysis ➞ | |
 | ENB Enbridge Inc. |
| Sector: Energy | |
| SubSector: Oil & Gas Pipelines | |
| MarketCap: 62578.4 Millions | |
| Recent Price: 37.24 Smart Investing & Trading Score: 100 | |
| Day Percent Change: 1.13% Day Change: 0.41 | |
| Week Change: 2.49% Year-to-date Change: 3.4% | |
| ENB Links: Profile News Message Board | |
| Charts:- Daily , Weekly | |
| Add ENB to Watchlist: View: Get Complete ENB Trend Analysis ➞ | |
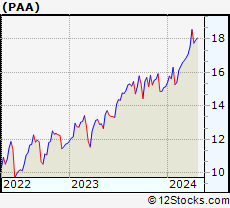 | PAA Plains All American Pipeline, L.P. |
| Sector: Energy | |
| SubSector: Oil & Gas Pipelines | |
| MarketCap: 5491.05 Millions | |
| Recent Price: 17.67 Smart Investing & Trading Score: 43 | |
| Day Percent Change: 1.03% Day Change: 0.18 | |
| Week Change: 1.03% Year-to-date Change: 16.6% | |
| PAA Links: Profile News Message Board | |
| Charts:- Daily , Weekly | |
| Add PAA to Watchlist: View: Get Complete PAA Trend Analysis ➞ | |
 | TRP TC Energy Corporation |
| Sector: Energy | |
| SubSector: Oil & Gas Pipelines | |
| MarketCap: 44071.1 Millions | |
| Recent Price: 37.87 Smart Investing & Trading Score: 60 | |
| Day Percent Change: 0.97% Day Change: 0.37 | |
| Week Change: 0.65% Year-to-date Change: -3.1% | |
| TRP Links: Profile News Message Board | |
| Charts:- Daily , Weekly | |
| Add TRP to Watchlist: View: Get Complete TRP Trend Analysis ➞ | |
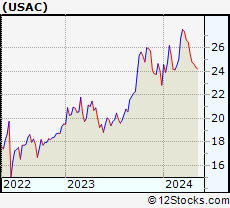 | USAC USA Compression Partners, LP |
| Sector: Energy | |
| SubSector: Oil & Gas Equipment & Services | |
| MarketCap: 597.261 Millions | |
| Recent Price: 25.18 Smart Investing & Trading Score: 64 | |
| Day Percent Change: 0.96% Day Change: 0.24 | |
| Week Change: 3.41% Year-to-date Change: 10.3% | |
| USAC Links: Profile News Message Board | |
| Charts:- Daily , Weekly | |
| Add USAC to Watchlist: View: Get Complete USAC Trend Analysis ➞ | |
| For tabular summary view of above stock list: Summary View ➞ 0 - 25 , 25 - 50 , 50 - 75 , 75 - 100 , 100 - 125 , 125 - 150 | ||
| Click To Change The Sort Order: By Market Cap or Company Size Performance: Year-to-date, Week and Day | |
| Select Chart Type: | ||
|
Best Stocks Today 12Stocks.com |
© 2024 12Stocks.com Terms & Conditions Privacy Contact Us
All Information Provided Only For Education And Not To Be Used For Investing or Trading. See Terms & Conditions


One More Thing ... Get Best Stocks Delivered Daily!
Never Ever Miss A Move With Our Top Ten Stocks Lists
Find Best Stocks In Any Market - Bull or Bear Market
Take A Peek At Our Top Ten Stocks Lists: Daily, Weekly, Year-to-Date & Top Trends
Find Best Stocks In Any Market - Bull or Bear Market
Take A Peek At Our Top Ten Stocks Lists: Daily, Weekly, Year-to-Date & Top Trends
Energy Stocks With Best Up Trends [0-bearish to 100-bullish]: Diamond Offshore[100], Crescent [100], Vitesse [100], YPF Sociedad[100], Flex LNG[100], Helix [100], Pembina Pipeline[100], Enbridge [100], Kimbell Royalty[100], Genesis [100], Black Stone[100]
Best Energy Stocks Year-to-Date:
Antero Resources[50.04%], Tidewater [48.62%], Indonesia [48.38%], Natural Gas[45.3%], YPF Sociedad[42.29%], Kodiak Gas[39.94%], NextDecade [39.83%], Precision Drilling[34.27%], Equitrans Midstream[32.51%], Atlas [32.48%], TechnipFMC [32.03%] Best Energy Stocks This Week:
Crescent [17.3%], Diamond Offshore[13.47%], Vitesse [11.96%], Valaris [7.82%], Permian Basin[5.81%], Helix [5.48%], YPF Sociedad[4.62%], TXO Partners[4.4%], Apache [4.37%], Natural Gas[4.35%], Petroleo Brasileiro[4.23%] Best Energy Stocks Daily:
TXO Partners[7.27%], Diamond Offshore[6.93%], Crescent [3.66%], Vitesse [3.13%], Sunoco LP[2.43%], Valaris [2.35%], Core [2.30%], GeoPark [2.22%], YPF Sociedad[1.79%], Permian Basin[1.73%], Noble [1.67%]