
 Login Sign Up


| |||||
 |  | ||||

| 12Stocks.com Market Intelligence |
Best MidCap Stocks
|
| In a hurry? Mid Cap Stocks Lists: Performance Trends Table, Stock Charts
Sort midcap stocks: Daily, Weekly, Year-to-Date, Market Cap & Trends. Filter midcap stocks list by sector: Show all, Tech, Finance, Energy, Staples, Retail, Industrial, Materials, Utilities and HealthCare Filter midcap stocks list by size:All MidCap Large Mid-Range Small |
| 12Stocks.com Mid Cap Stocks Performances & Trends Daily | |||||||||
|
|  The overall Smart Investing & Trading Score is 76 (0-bearish to 100-bullish) which puts Mid Cap index in short term neutral to bullish trend. The Smart Investing & Trading Score from previous trading session is 100 and a deterioration of trend continues.
| ||||||||
Here are the Smart Investing & Trading Scores of the most requested mid cap stocks at 12Stocks.com (click stock name for detailed review):
|


| 12Stocks.com: Top Performing Mid Cap Index Stocks | ||||||||||||||||||||||||||||||||||||||||||||||||
 The top performing Mid Cap Index stocks year to date are
Now, more recently, over last week, the top performing Mid Cap Index stocks on the move are


|
||||||||||||||||||||||||||||||||||||||||||||||||
| 12Stocks.com: Investing in Midcap Index with Stocks | |
|
The following table helps investors and traders sort through current performance and trends (as measured by Smart Investing & Trading Score) of various
stocks in the Midcap Index. Quick View: Move mouse or cursor over stock symbol (ticker) to view short-term technical chart and over stock name to view long term chart. Click on  to add stock symbol to your watchlist and to add stock symbol to your watchlist and  to view watchlist. Click on any ticker or stock name for detailed market intelligence report for that stock. to view watchlist. Click on any ticker or stock name for detailed market intelligence report for that stock. |
12Stocks.com Performance of Stocks in Midcap Index
| Ticker | Stock Name | Watchlist | Category | Recent Price | Smart Investing & Trading Score | Change % | Weekly Change% |
| BFAM | Bright Horizons |   | Services & Goods | 109.06 | 20 | -3.20% | -3.23% |
| PYCR | Paycor HCM | | Technology | 14.03 | 18 | 0.29% | -3.24% |
| JBHT | J.B. Hunt | | Transports | 164.80 | 25 | -2.77% | -3.39% |
| CTVA | Corteva | | Materials | 56.45 | 51 | 0.80% | -3.46% |
| CACC | Credit Acceptance | | Financials | 497.00 | 0 | -0.28% | -3.48% |
| CHDN | Churchill Downs | | Services & Goods | 133.62 | 64 | -0.97% | -3.51% |
| HUBB | Hubbell | | Technology | 392.74 | 38 | 0.36% | -3.57% |
| MIDD | Middleby | | Industrials | 133.08 | 0 | 0.33% | -3.63% |
| ACM | AECOM | | Services & Goods | 89.62 | 26 | 0.01% | -3.69% |
| XPO | XPO Logistics | | Transports | 110.20 | 15 | -1.62% | -3.69% |
| PII | Polaris | | Consumer Staples | 84.35 | 15 | 0.63% | -3.71% |
| SAM | Boston Beer | | Consumer Staples | 280.33 | 17 | -0.69% | -3.72% |
| LYFT | Lyft | | Technology | 16.62 | 46 | -1.95% | -3.74% |
| FLO | Flowers Foods | | Consumer Staples | 24.45 | 44 | -4.08% | -3.82% |
| OSK | Oshkosh | | Consumer Staples | 116.96 | 41 | 0.38% | -3.84% |
| WHR | Whirlpool | | Consumer Staples | 91.38 | 0 | -0.65% | -3.85% |
| SYF | Synchrony Financial | | Financials | 43.94 | 31 | 1.06% | -3.91% |
| TXG | 10x Genomics | | Technology | 25.01 | 10 | -2.27% | -4.08% |
| WEX | WEX | | Services & Goods | 198.21 | 0 | -2.60% | -4.09% |
| PEN | Penumbra | | Health Care | 203.53 | 25 | 0.99% | -4.12% |
| BMRN | BioMarin Pharmaceutical | | Health Care | 77.56 | 10 | 0.77% | -4.28% |
| RH | RH | | Services & Goods | 278.41 | 63 | -2.89% | -4.32% |
| CMI | Cummins | | Industrials | 285.56 | 43 | -0.80% | -4.37% |
| TAP | Molson Coors | | Consumer Staples | 56.47 | 0 | -1.71% | -4.37% |
| WTM | White Mountains | | Financials | 1764.57 | 38 | 1.63% | -4.41% |
| For chart view version of above stock list: Chart View ➞ 0 - 25 , 25 - 50 , 50 - 75 , 75 - 100 , 100 - 125 , 125 - 150 , 150 - 175 , 175 - 200 , 200 - 225 , 225 - 250 , 250 - 275 , 275 - 300 , 300 - 325 , 325 - 350 , 350 - 375 , 375 - 400 , 400 - 425 , 425 - 450 , 450 - 475 , 475 - 500 , 500 - 525 , 525 - 550 , 550 - 575 , 575 - 600 , 600 - 625 , 625 - 650 , 650 - 675 , 675 - 700 , 700 - 725 , 725 - 750 , 750 - 775 | ||
 | Click To Change The Sort Order: By Market Cap or Company Size Performance: Year-to-date, Week and Day |  |
|
Get the most comprehensive stock market coverage daily at 12Stocks.com ➞ Best Stocks Today ➞ Best Stocks Weekly ➞ Best Stocks Year-to-Date ➞ Best Stocks Trends ➞  Best Stocks Today 12Stocks.com Best Nasdaq Stocks ➞ Best S&P 500 Stocks ➞ Best Tech Stocks ➞ Best Biotech Stocks ➞ |
| Detailed Overview of Midcap Stocks |
| Midcap Technical Overview, Leaders & Laggards, Top Midcap ETF Funds & Detailed Midcap Stocks List, Charts, Trends & More |
| Midcap: Technical Analysis, Trends & YTD Performance | |
| MidCap segment as represented by
MDY, an exchange-traded fund [ETF], holds basket of about four hundred midcap stocks from across all major sectors of the US stock market. The midcap index (contains stocks like Green Mountain Coffee Roasters and Tractor Supply Company) is up by 8.73% and is currently underperforming the overall market by -1.84% year-to-date. Below is a quick view of technical charts and trends: | |
 MDY Weekly Chart |
|
| Long Term Trend: Very Good | |
| Medium Term Trend: Very Good | |
 MDY Daily Chart |
|
| Short Term Trend: Not Good | |
| Overall Trend Score: 76 | |
| YTD Performance: 8.73% | |
| **Trend Scores & Views Are Only For Educational Purposes And Not For Investing | |
| 12Stocks.com: Investing in Midcap Index using Exchange Traded Funds | |
|
The following table shows list of key exchange traded funds (ETF) that
help investors track Midcap index. The following list also includes leveraged ETF funds that track twice or thrice the daily returns of Midcap indices. Short or inverse ETF funds move in the opposite direction to the index they track and are useful during market pullbacks or during bear markets. Quick View: Move mouse or cursor over ETF symbol (ticker) to view short-term technical chart and over ETF name to view long term chart. Click on ticker or stock name for detailed view. Click on to add stock symbol to your watchlist and to view watchlist. |
12Stocks.com List of ETFs that track Midcap Index
| Ticker | ETF Name | Watchlist | Recent Price | Smart Investing & Trading Score | Change % | Week % | Year-to-date % |
| IJH | iShares Core S&P Mid-Cap | | 60.31 | 68 | -0.46 | 0.84 | 8.8% |
| MDY | SPDR S&P MidCap 400 ETF | | 551.69 | 76 | 0.11 | 0.84 | 8.73% |
| IWR | iShares Russell Mid-Cap | | 83.29 | 76 | -0.28 | 1.07 | 7.15% |
| IWP | iShares Russell Mid-Cap Growth | | 112.01 | 70 | -0.29 | 1.53 | 7.23% |
| IWS | iShares Russell Mid-Cap Value | | 124.51 | 76 | -0.34 | 0.92 | 7.07% |
| IJK | iShares S&P Mid-Cap 400 Growth | | 90.28 | 71 | -0.05 | 0.39 | 13.96% |
| IJJ | iShares S&P Mid-Cap 400 Value | | 117.71 | 76 | -0.16 | 1.26 | 3.22% |
| MVV | ProShares Ultra MidCap400 | | 66.42 | 76 | 0.02 | 1.65 | 14.74% |
| XMLV | PowerShares S&P MidCap Low Volatil ETF | | 56.93 | 76 | -0.02 | 0.42 | 7.05% |
| UMDD | ProShares UltraPro MidCap400 | | 26.83 | 76 | -0.58 | 1.98 | 20.21% |
| SMDD | ProShares UltraPro Short MidCap400 | | 10.48 | 25 | 0.73 | -1.92 | -22.18% |
| MYY | ProShares Short MidCap400 | | 20.00 | 25 | 0.60 | -0.61 | -6.78% |
| MZZ | ProShares UltraShort MidCap400 | | 10.81 | 27 | 0.49 | -1.25 | -13.98% |
| 12Stocks.com: Charts, Trends, Fundamental Data and Performances of MidCap Stocks | |
|
We now take in-depth look at all MidCap stocks including charts, multi-period performances and overall trends (as measured by Smart Investing & Trading Score). One can sort MidCap stocks (click link to choose) by Daily, Weekly and by Year-to-Date performances. Also, one can sort by size of the company or by market capitalization. |
| Select Your Default Chart Type: | |||||
| |||||
| Click on stock symbol or name for detailed view. Click on to add stock symbol to your watchlist and to view watchlist. Quick View: Move mouse or cursor over "Daily" to quickly view daily technical stock chart and over "Weekly" to view weekly technical stock chart. | |||||

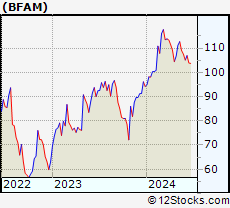 | BFAM Bright Horizons Family Solutions Inc. |
| Sector: Services & Goods | |
| SubSector: Personal Services | |
| MarketCap: 5487.65 Millions | |
| Recent Price: 109.06 Smart Investing & Trading Score: 20 | |
| Day Percent Change: -3.20% Day Change: -3.60 | |
| Week Change: -3.23% Year-to-date Change: 15.7% | |
| BFAM Links: Profile News Message Board | |
| Charts:- Daily , Weekly | |
| Add BFAM to Watchlist: View: Get Complete BFAM Trend Analysis ➞ | |
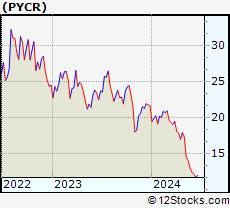 | PYCR Paycor HCM, Inc. |
| Sector: Technology | |
| SubSector: Software - Application | |
| MarketCap: 4220 Millions | |
| Recent Price: 14.03 Smart Investing & Trading Score: 18 | |
| Day Percent Change: 0.29% Day Change: 0.04 | |
| Week Change: -3.24% Year-to-date Change: -35.2% | |
| PYCR Links: Profile News Message Board | |
| Charts:- Daily , Weekly | |
| Add PYCR to Watchlist: View: Get Complete PYCR Trend Analysis ➞ | |
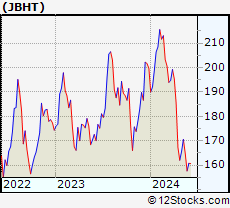 | JBHT J.B. Hunt Transport Services, Inc. |
| Sector: Transports | |
| SubSector: Trucking | |
| MarketCap: 9074 Millions | |
| Recent Price: 164.80 Smart Investing & Trading Score: 25 | |
| Day Percent Change: -2.77% Day Change: -4.69 | |
| Week Change: -3.39% Year-to-date Change: -17.5% | |
| JBHT Links: Profile News Message Board | |
| Charts:- Daily , Weekly | |
| Add JBHT to Watchlist: View: Get Complete JBHT Trend Analysis ➞ | |
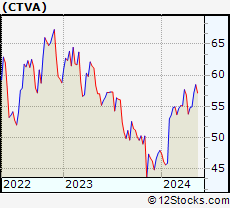 | CTVA Corteva, Inc. |
| Sector: Materials | |
| SubSector: Agricultural Chemicals | |
| MarketCap: 18894.3 Millions | |
| Recent Price: 56.45 Smart Investing & Trading Score: 51 | |
| Day Percent Change: 0.80% Day Change: 0.45 | |
| Week Change: -3.46% Year-to-date Change: 17.8% | |
| CTVA Links: Profile News Message Board | |
| Charts:- Daily , Weekly | |
| Add CTVA to Watchlist: View: Get Complete CTVA Trend Analysis ➞ | |
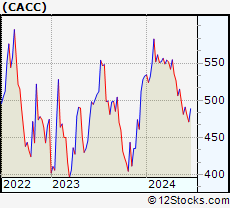 | CACC Credit Acceptance Corporation |
| Sector: Financials | |
| SubSector: Credit Services | |
| MarketCap: 5219.28 Millions | |
| Recent Price: 497.00 Smart Investing & Trading Score: 0 | |
| Day Percent Change: -0.28% Day Change: -1.41 | |
| Week Change: -3.48% Year-to-date Change: -6.7% | |
| CACC Links: Profile News Message Board | |
| Charts:- Daily , Weekly | |
| Add CACC to Watchlist: View: Get Complete CACC Trend Analysis ➞ | |
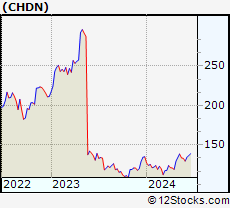 | CHDN Churchill Downs Incorporated |
| Sector: Services & Goods | |
| SubSector: Gaming Activities | |
| MarketCap: 3693.29 Millions | |
| Recent Price: 133.62 Smart Investing & Trading Score: 64 | |
| Day Percent Change: -0.97% Day Change: -1.31 | |
| Week Change: -3.51% Year-to-date Change: -1.0% | |
| CHDN Links: Profile News Message Board | |
| Charts:- Daily , Weekly | |
| Add CHDN to Watchlist: View: Get Complete CHDN Trend Analysis ➞ | |
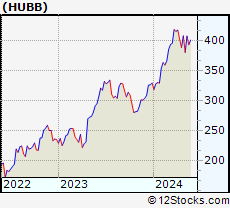 | HUBB Hubbell Incorporated |
| Sector: Technology | |
| SubSector: Diversified Electronics | |
| MarketCap: 6002.46 Millions | |
| Recent Price: 392.74 Smart Investing & Trading Score: 38 | |
| Day Percent Change: 0.36% Day Change: 1.41 | |
| Week Change: -3.57% Year-to-date Change: 19.4% | |
| HUBB Links: Profile News Message Board | |
| Charts:- Daily , Weekly | |
| Add HUBB to Watchlist: View: Get Complete HUBB Trend Analysis ➞ | |
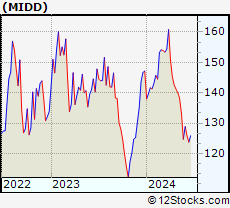 | MIDD The Middleby Corporation |
| Sector: Industrials | |
| SubSector: Diversified Machinery | |
| MarketCap: 3070.36 Millions | |
| Recent Price: 133.08 Smart Investing & Trading Score: 0 | |
| Day Percent Change: 0.33% Day Change: 0.44 | |
| Week Change: -3.63% Year-to-date Change: -9.6% | |
| MIDD Links: Profile News Message Board | |
| Charts:- Daily , Weekly | |
| Add MIDD to Watchlist: View: Get Complete MIDD Trend Analysis ➞ | |
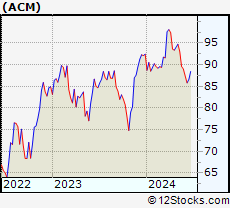 | ACM AECOM |
| Sector: Services & Goods | |
| SubSector: Technical Services | |
| MarketCap: 4781.9 Millions | |
| Recent Price: 89.62 Smart Investing & Trading Score: 26 | |
| Day Percent Change: 0.01% Day Change: 0.01 | |
| Week Change: -3.69% Year-to-date Change: -3.0% | |
| ACM Links: Profile News Message Board | |
| Charts:- Daily , Weekly | |
| Add ACM to Watchlist: View: Get Complete ACM Trend Analysis ➞ | |
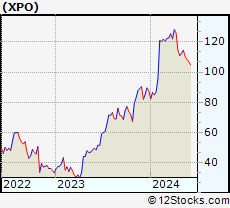 | XPO XPO Logistics, Inc. |
| Sector: Transports | |
| SubSector: Air Delivery & Freight Services | |
| MarketCap: 4049.08 Millions | |
| Recent Price: 110.20 Smart Investing & Trading Score: 15 | |
| Day Percent Change: -1.62% Day Change: -1.81 | |
| Week Change: -3.69% Year-to-date Change: 25.8% | |
| XPO Links: Profile News Message Board | |
| Charts:- Daily , Weekly | |
| Add XPO to Watchlist: View: Get Complete XPO Trend Analysis ➞ | |
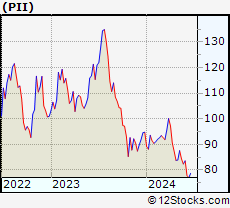 | PII Polaris Inc. |
| Sector: Consumer Staples | |
| SubSector: Recreational Vehicles | |
| MarketCap: 3589.29 Millions | |
| Recent Price: 84.35 Smart Investing & Trading Score: 15 | |
| Day Percent Change: 0.63% Day Change: 0.53 | |
| Week Change: -3.71% Year-to-date Change: -11.0% | |
| PII Links: Profile News Message Board | |
| Charts:- Daily , Weekly | |
| Add PII to Watchlist: View: Get Complete PII Trend Analysis ➞ | |
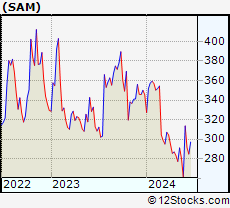 | SAM The Boston Beer Company, Inc. |
| Sector: Consumer Staples | |
| SubSector: Beverages - Brewers | |
| MarketCap: 4063.67 Millions | |
| Recent Price: 280.33 Smart Investing & Trading Score: 17 | |
| Day Percent Change: -0.69% Day Change: -1.96 | |
| Week Change: -3.72% Year-to-date Change: -18.9% | |
| SAM Links: Profile News Message Board | |
| Charts:- Daily , Weekly | |
| Add SAM to Watchlist: View: Get Complete SAM Trend Analysis ➞ | |
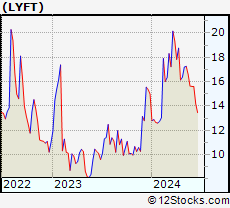 | LYFT Lyft, Inc. |
| Sector: Technology | |
| SubSector: Application Software | |
| MarketCap: 7923.22 Millions | |
| Recent Price: 16.62 Smart Investing & Trading Score: 46 | |
| Day Percent Change: -1.95% Day Change: -0.33 | |
| Week Change: -3.74% Year-to-date Change: 10.9% | |
| LYFT Links: Profile News Message Board | |
| Charts:- Daily , Weekly | |
| Add LYFT to Watchlist: View: Get Complete LYFT Trend Analysis ➞ | |
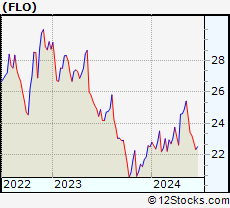 | FLO Flowers Foods, Inc. |
| Sector: Consumer Staples | |
| SubSector: Processed & Packaged Goods | |
| MarketCap: 4830.18 Millions | |
| Recent Price: 24.45 Smart Investing & Trading Score: 44 | |
| Day Percent Change: -4.08% Day Change: -1.04 | |
| Week Change: -3.82% Year-to-date Change: 8.6% | |
| FLO Links: Profile News Message Board | |
| Charts:- Daily , Weekly | |
| Add FLO to Watchlist: View: Get Complete FLO Trend Analysis ➞ | |
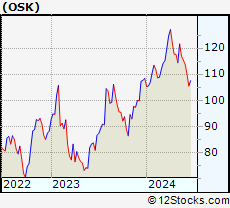 | OSK Oshkosh Corporation |
| Sector: Consumer Staples | |
| SubSector: Trucks & Other Vehicles | |
| MarketCap: 3708 Millions | |
| Recent Price: 116.96 Smart Investing & Trading Score: 41 | |
| Day Percent Change: 0.38% Day Change: 0.44 | |
| Week Change: -3.84% Year-to-date Change: 7.9% | |
| OSK Links: Profile News Message Board | |
| Charts:- Daily , Weekly | |
| Add OSK to Watchlist: View: Get Complete OSK Trend Analysis ➞ | |
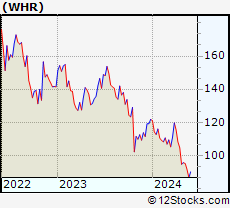 | WHR Whirlpool Corporation |
| Sector: Consumer Staples | |
| SubSector: Appliances | |
| MarketCap: 5015.08 Millions | |
| Recent Price: 91.38 Smart Investing & Trading Score: 0 | |
| Day Percent Change: -0.65% Day Change: -0.60 | |
| Week Change: -3.85% Year-to-date Change: -25.0% | |
| WHR Links: Profile News Message Board | |
| Charts:- Daily , Weekly | |
| Add WHR to Watchlist: View: Get Complete WHR Trend Analysis ➞ | |
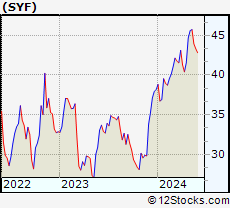 | SYF Synchrony Financial |
| Sector: Financials | |
| SubSector: Credit Services | |
| MarketCap: 9297.28 Millions | |
| Recent Price: 43.94 Smart Investing & Trading Score: 31 | |
| Day Percent Change: 1.06% Day Change: 0.46 | |
| Week Change: -3.91% Year-to-date Change: 15.1% | |
| SYF Links: Profile News Message Board | |
| Charts:- Daily , Weekly | |
| Add SYF to Watchlist: View: Get Complete SYF Trend Analysis ➞ | |
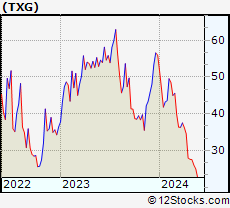 | TXG 10x Genomics, Inc. |
| Sector: Technology | |
| SubSector: Healthcare Information Services | |
| MarketCap: 5490.45 Millions | |
| Recent Price: 25.01 Smart Investing & Trading Score: 10 | |
| Day Percent Change: -2.27% Day Change: -0.58 | |
| Week Change: -4.08% Year-to-date Change: -55.3% | |
| TXG Links: Profile News Message Board | |
| Charts:- Daily , Weekly | |
| Add TXG to Watchlist: View: Get Complete TXG Trend Analysis ➞ | |
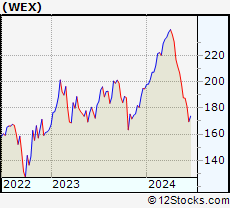 | WEX WEX Inc. |
| Sector: Services & Goods | |
| SubSector: Business Services | |
| MarketCap: 4312.22 Millions | |
| Recent Price: 198.21 Smart Investing & Trading Score: 0 | |
| Day Percent Change: -2.60% Day Change: -5.30 | |
| Week Change: -4.09% Year-to-date Change: 1.9% | |
| WEX Links: Profile News Message Board | |
| Charts:- Daily , Weekly | |
| Add WEX to Watchlist: View: Get Complete WEX Trend Analysis ➞ | |
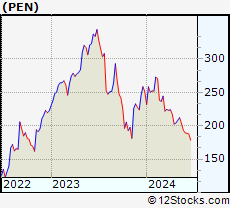 | PEN Penumbra, Inc. |
| Sector: Health Care | |
| SubSector: Medical Instruments & Supplies | |
| MarketCap: 4854.1 Millions | |
| Recent Price: 203.53 Smart Investing & Trading Score: 25 | |
| Day Percent Change: 0.99% Day Change: 2.00 | |
| Week Change: -4.12% Year-to-date Change: -19.1% | |
| PEN Links: Profile News Message Board | |
| Charts:- Daily , Weekly | |
| Add PEN to Watchlist: View: Get Complete PEN Trend Analysis ➞ | |
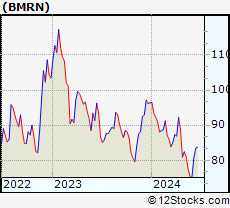 | BMRN BioMarin Pharmaceutical Inc. |
| Sector: Health Care | |
| SubSector: Biotechnology | |
| MarketCap: 14887.5 Millions | |
| Recent Price: 77.56 Smart Investing & Trading Score: 10 | |
| Day Percent Change: 0.77% Day Change: 0.59 | |
| Week Change: -4.28% Year-to-date Change: -19.6% | |
| BMRN Links: Profile News Message Board | |
| Charts:- Daily , Weekly | |
| Add BMRN to Watchlist: View: Get Complete BMRN Trend Analysis ➞ | |
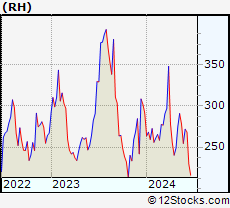 | RH RH |
| Sector: Services & Goods | |
| SubSector: Home Furnishing Stores | |
| MarketCap: 1828.25 Millions | |
| Recent Price: 278.41 Smart Investing & Trading Score: 63 | |
| Day Percent Change: -2.89% Day Change: -8.28 | |
| Week Change: -4.32% Year-to-date Change: -4.5% | |
| RH Links: Profile News Message Board | |
| Charts:- Daily , Weekly | |
| Add RH to Watchlist: View: Get Complete RH Trend Analysis ➞ | |
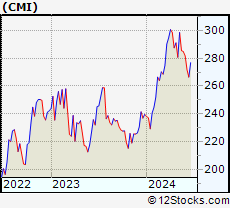 | CMI Cummins Inc. |
| Sector: Industrials | |
| SubSector: Diversified Machinery | |
| MarketCap: 19127.1 Millions | |
| Recent Price: 285.56 Smart Investing & Trading Score: 43 | |
| Day Percent Change: -0.80% Day Change: -2.29 | |
| Week Change: -4.37% Year-to-date Change: 19.2% | |
| CMI Links: Profile News Message Board | |
| Charts:- Daily , Weekly | |
| Add CMI to Watchlist: View: Get Complete CMI Trend Analysis ➞ | |
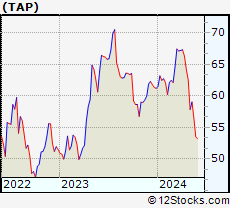 | TAP Molson Coors Beverage Company |
| Sector: Consumer Staples | |
| SubSector: Beverages - Brewers | |
| MarketCap: 8619.97 Millions | |
| Recent Price: 56.47 Smart Investing & Trading Score: 0 | |
| Day Percent Change: -1.71% Day Change: -0.98 | |
| Week Change: -4.37% Year-to-date Change: -7.7% | |
| TAP Links: Profile News Message Board | |
| Charts:- Daily , Weekly | |
| Add TAP to Watchlist: View: Get Complete TAP Trend Analysis ➞ | |
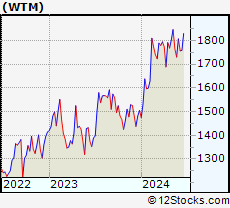 | WTM White Mountains Insurance Group, Ltd. |
| Sector: Financials | |
| SubSector: Property & Casualty Insurance | |
| MarketCap: 2502.62 Millions | |
| Recent Price: 1764.57 Smart Investing & Trading Score: 38 | |
| Day Percent Change: 1.63% Day Change: 28.25 | |
| Week Change: -4.41% Year-to-date Change: 17.3% | |
| WTM Links: Profile News Message Board | |
| Charts:- Daily , Weekly | |
| Add WTM to Watchlist: View: Get Complete WTM Trend Analysis ➞ | |
| For tabular summary view of above stock list: Summary View ➞ 0 - 25 , 25 - 50 , 50 - 75 , 75 - 100 , 100 - 125 , 125 - 150 , 150 - 175 , 175 - 200 , 200 - 225 , 225 - 250 , 250 - 275 , 275 - 300 , 300 - 325 , 325 - 350 , 350 - 375 , 375 - 400 , 400 - 425 , 425 - 450 , 450 - 475 , 475 - 500 , 500 - 525 , 525 - 550 , 550 - 575 , 575 - 600 , 600 - 625 , 625 - 650 , 650 - 675 , 675 - 700 , 700 - 725 , 725 - 750 , 750 - 775 | ||
| Click To Change The Sort Order: By Market Cap or Company Size Performance: Year-to-date, Week and Day | |
| Select Chart Type: | ||
|
Best Stocks Today 12Stocks.com |
© 2024 12Stocks.com Terms & Conditions Privacy Contact Us
All Information Provided Only For Education And Not To Be Used For Investing or Trading. See Terms & Conditions


One More Thing ... Get Best Stocks Delivered Daily!
Never Ever Miss A Move With Our Top Ten Stocks Lists
Find Best Stocks In Any Market - Bull or Bear Market
Take A Peek At Our Top Ten Stocks Lists: Daily, Weekly, Year-to-Date & Top Trends
Find Best Stocks In Any Market - Bull or Bear Market
Take A Peek At Our Top Ten Stocks Lists: Daily, Weekly, Year-to-Date & Top Trends
Midcap Stocks With Best Up Trends [0-bearish to 100-bullish]: Robinhood Markets[100], SSR Mining[100], Littelfuse [100], Tractor Supply[100], DuPont de[100], Royal Gold[100], Alcoa [100], Range Resources[100], Arch Capital[100], Evercore [100], Prosperity Bancshares[100]
Best Midcap Stocks Year-to-Date:
Vistra Energy[144.24%], AppLovin [107.29%], Constellation Energy[81.97%], CAVA [77.74%], EMCOR [75.63%], ShockWave Medical[73.24%], Maravai LifeSciences[72.82%], Celsius [70.62%], Tenet [70%], Natera [69.96%], Pure Storage[65.87%] Best Midcap Stocks This Week:
AMC Entertainment[51.2%], Petco Health[50%], NovoCure [33.52%], GameStop [27.21%], Plug Power[26.95%], Robinhood Markets[23.78%], Doximity [19.94%], Ubiquiti [16.29%], Hawaiian Electric[15.12%], MP Materials[13.14%], Victorias Secret[13.12%] Best Midcap Stocks Daily:
Doximity [18.07%], Robinhood Markets[12.23%], Affirm [8.01%], SSR Mining[6.28%], Coinbase Global[4.23%], Littelfuse [4.13%], Rivian Automotive[3.65%], DoubleVerify [3.50%], Tractor Supply[3.42%], Iridium [3.42%], Ubiquiti [3.04%]