
 Login Sign Up


| |||||
 |  | ||||

| 12Stocks.com Market Intelligence |
Best MidCap Stocks
|
| In a hurry? Mid Cap Stocks Lists: Performance Trends Table, Stock Charts
Sort midcap stocks: Daily, Weekly, Year-to-Date, Market Cap & Trends. Filter midcap stocks list by sector: Show all, Tech, Finance, Energy, Staples, Retail, Industrial, Materials, Utilities and HealthCare Filter midcap stocks list by size:All MidCap Large Mid-Range Small |
| 12Stocks.com Mid Cap Stocks Performances & Trends Daily | |||||||||
|
|  The overall Smart Investing & Trading Score is 76 (0-bearish to 100-bullish) which puts Mid Cap index in short term neutral to bullish trend. The Smart Investing & Trading Score from previous trading session is 100 and a deterioration of trend continues.
| ||||||||
Here are the Smart Investing & Trading Scores of the most requested mid cap stocks at 12Stocks.com (click stock name for detailed review):
|


| 12Stocks.com: Top Performing Mid Cap Index Stocks | ||||||||||||||||||||||||||||||||||||||||||||||||
 The top performing Mid Cap Index stocks year to date are
Now, more recently, over last week, the top performing Mid Cap Index stocks on the move are


|
||||||||||||||||||||||||||||||||||||||||||||||||
| 12Stocks.com: Investing in Midcap Index with Stocks | |
|
The following table helps investors and traders sort through current performance and trends (as measured by Smart Investing & Trading Score) of various
stocks in the Midcap Index. Quick View: Move mouse or cursor over stock symbol (ticker) to view short-term technical chart and over stock name to view long term chart. Click on  to add stock symbol to your watchlist and to add stock symbol to your watchlist and  to view watchlist. Click on any ticker or stock name for detailed market intelligence report for that stock. to view watchlist. Click on any ticker or stock name for detailed market intelligence report for that stock. |
12Stocks.com Performance of Stocks in Midcap Index
| Ticker | Stock Name | Watchlist | Category | Recent Price | Smart Investing & Trading Score | Change % | Weekly Change% |
| TPX | Tempur Sealy |   | Consumer Staples | 53.04 | 40 | 1.01% | -2.55% |
| PLNT | Planet Fitness | | Services & Goods | 63.27 | 68 | -3.26% | -2.59% |
| NDSN | Nordson | | Industrials | 271.65 | 76 | 0.40% | -2.60% |
| RPRX | Royalty Pharma | | Health Care | 27.36 | 10 | -2.58% | -2.60% |
| PWR | Quanta Services | | Industrials | 264.40 | 66 | 0.22% | -2.61% |
| LOPE | Grand Canyon | | Services & Goods | 144.87 | 76 | -0.09% | -2.63% |
| CSGP | CoStar | | Financials | 87.50 | 21 | -0.71% | -2.65% |
| AGR | Avangrid | | Utilities | 35.84 | 36 | -4.50% | -2.74% |
| BG | Bunge | | Consumer Staples | 103.09 | 65 | -1.09% | -2.77% |
| SAIA | Saia | | Transports | 399.14 | 10 | -2.13% | -2.80% |
| MKC | McCormick & | | Consumer Staples | 74.01 | 36 | -0.63% | -2.81% |
| SLM | SLM | | Financials | 21.16 | 41 | 0.43% | -2.85% |
| CRL | Charles River | | Health Care | 221.61 | 0 | -1.40% | -2.85% |
| PH | Parker-Hannifin | | Industrials | 545.11 | 26 | 1.04% | -2.85% |
| SITE | SiteOne Landscape | | Industrials | 152.02 | 0 | -0.82% | -2.86% |
| PRGO | Perrigo | | Health Care | 29.83 | 36 | -0.90% | -2.87% |
| SPB | Spectrum | | Consumer Staples | 92.06 | 68 | -1.38% | -2.89% |
| ICUI | ICU Medical | | Health Care | 103.99 | 37 | -2.15% | -2.90% |
| PCAR | PACCAR | | Consumer Staples | 106.00 | 7 | 0.07% | -2.91% |
| MAS | Masco | | Industrials | 70.16 | 15 | -0.26% | -2.97% |
| KR | Kroger Co | | Services & Goods | 54.20 | 36 | -0.44% | -3.04% |
| DLTR | Dollar Tree | | Services & Goods | 117.31 | 10 | -3.29% | -3.08% |
| GLOB | Globant S.A | | Technology | 167.75 | 10 | -5.62% | -3.11% |
| AWI | Armstrong World | | Industrials | 113.87 | 0 | -0.36% | -3.17% |
| WEN | Wendy s | | Services & Goods | 18.39 | 36 | -1.13% | -3.21% |
| For chart view version of above stock list: Chart View ➞ 0 - 25 , 25 - 50 , 50 - 75 , 75 - 100 , 100 - 125 , 125 - 150 , 150 - 175 , 175 - 200 , 200 - 225 , 225 - 250 , 250 - 275 , 275 - 300 , 300 - 325 , 325 - 350 , 350 - 375 , 375 - 400 , 400 - 425 , 425 - 450 , 450 - 475 , 475 - 500 , 500 - 525 , 525 - 550 , 550 - 575 , 575 - 600 , 600 - 625 , 625 - 650 , 650 - 675 , 675 - 700 , 700 - 725 , 725 - 750 , 750 - 775 | ||
 | Click To Change The Sort Order: By Market Cap or Company Size Performance: Year-to-date, Week and Day |  |
|
Get the most comprehensive stock market coverage daily at 12Stocks.com ➞ Best Stocks Today ➞ Best Stocks Weekly ➞ Best Stocks Year-to-Date ➞ Best Stocks Trends ➞  Best Stocks Today 12Stocks.com Best Nasdaq Stocks ➞ Best S&P 500 Stocks ➞ Best Tech Stocks ➞ Best Biotech Stocks ➞ |
| Detailed Overview of Midcap Stocks |
| Midcap Technical Overview, Leaders & Laggards, Top Midcap ETF Funds & Detailed Midcap Stocks List, Charts, Trends & More |
| Midcap: Technical Analysis, Trends & YTD Performance | |
| MidCap segment as represented by
MDY, an exchange-traded fund [ETF], holds basket of about four hundred midcap stocks from across all major sectors of the US stock market. The midcap index (contains stocks like Green Mountain Coffee Roasters and Tractor Supply Company) is up by 8.73% and is currently underperforming the overall market by -1.84% year-to-date. Below is a quick view of technical charts and trends: | |
 MDY Weekly Chart |
|
| Long Term Trend: Very Good | |
| Medium Term Trend: Very Good | |
 MDY Daily Chart |
|
| Short Term Trend: Not Good | |
| Overall Trend Score: 76 | |
| YTD Performance: 8.73% | |
| **Trend Scores & Views Are Only For Educational Purposes And Not For Investing | |
| 12Stocks.com: Investing in Midcap Index using Exchange Traded Funds | |
|
The following table shows list of key exchange traded funds (ETF) that
help investors track Midcap index. The following list also includes leveraged ETF funds that track twice or thrice the daily returns of Midcap indices. Short or inverse ETF funds move in the opposite direction to the index they track and are useful during market pullbacks or during bear markets. Quick View: Move mouse or cursor over ETF symbol (ticker) to view short-term technical chart and over ETF name to view long term chart. Click on ticker or stock name for detailed view. Click on to add stock symbol to your watchlist and to view watchlist. |
12Stocks.com List of ETFs that track Midcap Index
| Ticker | ETF Name | Watchlist | Recent Price | Smart Investing & Trading Score | Change % | Week % | Year-to-date % |
| IJH | iShares Core S&P Mid-Cap | | 60.31 | 68 | -0.46 | 0.84 | 8.8% |
| MDY | SPDR S&P MidCap 400 ETF | | 551.69 | 76 | 0.11 | 0.84 | 8.73% |
| IWR | iShares Russell Mid-Cap | | 83.29 | 76 | -0.28 | 1.07 | 7.15% |
| IWP | iShares Russell Mid-Cap Growth | | 112.01 | 70 | -0.29 | 1.53 | 7.23% |
| IWS | iShares Russell Mid-Cap Value | | 124.51 | 76 | -0.34 | 0.92 | 7.07% |
| IJK | iShares S&P Mid-Cap 400 Growth | | 90.28 | 71 | -0.05 | 0.39 | 13.96% |
| IJJ | iShares S&P Mid-Cap 400 Value | | 117.71 | 76 | -0.16 | 1.26 | 3.22% |
| MVV | ProShares Ultra MidCap400 | | 66.42 | 76 | 0.02 | 1.65 | 14.74% |
| XMLV | PowerShares S&P MidCap Low Volatil ETF | | 56.93 | 76 | -0.02 | 0.42 | 7.05% |
| UMDD | ProShares UltraPro MidCap400 | | 26.83 | 76 | -0.58 | 1.98 | 20.21% |
| SMDD | ProShares UltraPro Short MidCap400 | | 10.48 | 25 | 0.73 | -1.92 | -22.18% |
| MYY | ProShares Short MidCap400 | | 20.00 | 25 | 0.60 | -0.61 | -6.78% |
| MZZ | ProShares UltraShort MidCap400 | | 10.81 | 27 | 0.49 | -1.25 | -13.98% |
| 12Stocks.com: Charts, Trends, Fundamental Data and Performances of MidCap Stocks | |
|
We now take in-depth look at all MidCap stocks including charts, multi-period performances and overall trends (as measured by Smart Investing & Trading Score). One can sort MidCap stocks (click link to choose) by Daily, Weekly and by Year-to-Date performances. Also, one can sort by size of the company or by market capitalization. |
| Select Your Default Chart Type: | |||||
| |||||
| Click on stock symbol or name for detailed view. Click on to add stock symbol to your watchlist and to view watchlist. Quick View: Move mouse or cursor over "Daily" to quickly view daily technical stock chart and over "Weekly" to view weekly technical stock chart. | |||||

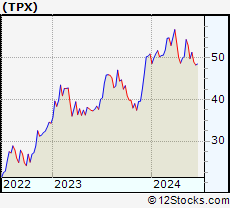 | TPX Tempur Sealy International, Inc. |
| Sector: Consumer Staples | |
| SubSector: Home Furnishings & Fixtures | |
| MarketCap: 1984.35 Millions | |
| Recent Price: 53.04 Smart Investing & Trading Score: 40 | |
| Day Percent Change: 1.01% Day Change: 0.53 | |
| Week Change: -2.55% Year-to-date Change: 4.1% | |
| TPX Links: Profile News Message Board | |
| Charts:- Daily , Weekly | |
| Add TPX to Watchlist: View: Get Complete TPX Trend Analysis ➞ | |
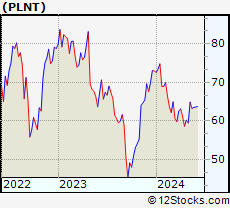 | PLNT Planet Fitness, Inc. |
| Sector: Services & Goods | |
| SubSector: Sporting Activities | |
| MarketCap: 3485.94 Millions | |
| Recent Price: 63.27 Smart Investing & Trading Score: 68 | |
| Day Percent Change: -3.26% Day Change: -2.13 | |
| Week Change: -2.59% Year-to-date Change: -13.3% | |
| PLNT Links: Profile News Message Board | |
| Charts:- Daily , Weekly | |
| Add PLNT to Watchlist: View: Get Complete PLNT Trend Analysis ➞ | |
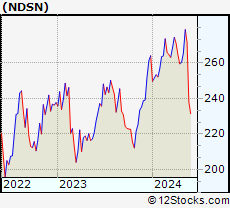 | NDSN Nordson Corporation |
| Sector: Industrials | |
| SubSector: Diversified Machinery | |
| MarketCap: 7117.56 Millions | |
| Recent Price: 271.65 Smart Investing & Trading Score: 76 | |
| Day Percent Change: 0.40% Day Change: 1.09 | |
| Week Change: -2.6% Year-to-date Change: 2.8% | |
| NDSN Links: Profile News Message Board | |
| Charts:- Daily , Weekly | |
| Add NDSN to Watchlist: View: Get Complete NDSN Trend Analysis ➞ | |
 | RPRX Royalty Pharma plc |
| Sector: Health Care | |
| SubSector: Biotechnology | |
| MarketCap: 28457 Millions | |
| Recent Price: 27.36 Smart Investing & Trading Score: 10 | |
| Day Percent Change: -2.58% Day Change: -0.73 | |
| Week Change: -2.6% Year-to-date Change: -2.6% | |
| RPRX Links: Profile News Message Board | |
| Charts:- Daily , Weekly | |
| Add RPRX to Watchlist: View: Get Complete RPRX Trend Analysis ➞ | |
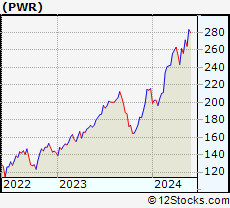 | PWR Quanta Services, Inc. |
| Sector: Industrials | |
| SubSector: General Contractors | |
| MarketCap: 3936.63 Millions | |
| Recent Price: 264.40 Smart Investing & Trading Score: 66 | |
| Day Percent Change: 0.22% Day Change: 0.58 | |
| Week Change: -2.61% Year-to-date Change: 22.5% | |
| PWR Links: Profile News Message Board | |
| Charts:- Daily , Weekly | |
| Add PWR to Watchlist: View: Get Complete PWR Trend Analysis ➞ | |
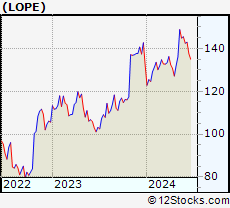 | LOPE Grand Canyon Education, Inc. |
| Sector: Services & Goods | |
| SubSector: Education & Training Services | |
| MarketCap: 3073.56 Millions | |
| Recent Price: 144.87 Smart Investing & Trading Score: 76 | |
| Day Percent Change: -0.09% Day Change: -0.13 | |
| Week Change: -2.63% Year-to-date Change: 9.7% | |
| LOPE Links: Profile News Message Board | |
| Charts:- Daily , Weekly | |
| Add LOPE to Watchlist: View: Get Complete LOPE Trend Analysis ➞ | |
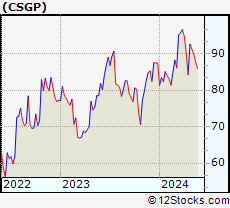 | CSGP CoStar Group, Inc. |
| Sector: Financials | |
| SubSector: Property Management | |
| MarketCap: 21454.4 Millions | |
| Recent Price: 87.50 Smart Investing & Trading Score: 21 | |
| Day Percent Change: -0.71% Day Change: -0.63 | |
| Week Change: -2.65% Year-to-date Change: 0.1% | |
| CSGP Links: Profile News Message Board | |
| Charts:- Daily , Weekly | |
| Add CSGP to Watchlist: View: Get Complete CSGP Trend Analysis ➞ | |
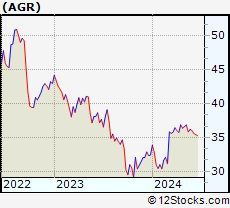 | AGR Avangrid, Inc. |
| Sector: Utilities | |
| SubSector: Gas Utilities | |
| MarketCap: 14337.3 Millions | |
| Recent Price: 35.84 Smart Investing & Trading Score: 36 | |
| Day Percent Change: -4.50% Day Change: -1.69 | |
| Week Change: -2.74% Year-to-date Change: 10.6% | |
| AGR Links: Profile News Message Board | |
| Charts:- Daily , Weekly | |
| Add AGR to Watchlist: View: Get Complete AGR Trend Analysis ➞ | |
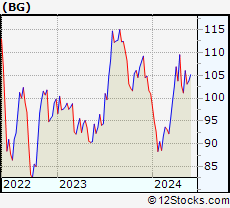 | BG Bunge Limited |
| Sector: Consumer Staples | |
| SubSector: Farm Products | |
| MarketCap: 4975.77 Millions | |
| Recent Price: 103.09 Smart Investing & Trading Score: 65 | |
| Day Percent Change: -1.09% Day Change: -1.14 | |
| Week Change: -2.77% Year-to-date Change: 2.1% | |
| BG Links: Profile News Message Board | |
| Charts:- Daily , Weekly | |
| Add BG to Watchlist: View: Get Complete BG Trend Analysis ➞ | |
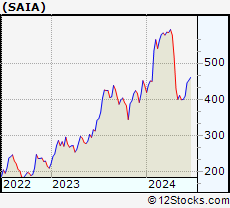 | SAIA Saia, Inc. |
| Sector: Transports | |
| SubSector: Trucking | |
| MarketCap: 1978.15 Millions | |
| Recent Price: 399.14 Smart Investing & Trading Score: 10 | |
| Day Percent Change: -2.13% Day Change: -8.67 | |
| Week Change: -2.8% Year-to-date Change: -8.9% | |
| SAIA Links: Profile News Message Board | |
| Charts:- Daily , Weekly | |
| Add SAIA to Watchlist: View: Get Complete SAIA Trend Analysis ➞ | |
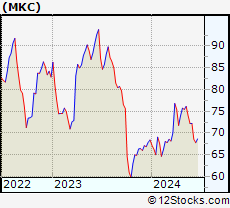 | MKC McCormick & Company, Incorporated |
| Sector: Consumer Staples | |
| SubSector: Processed & Packaged Goods | |
| MarketCap: 18522.8 Millions | |
| Recent Price: 74.01 Smart Investing & Trading Score: 36 | |
| Day Percent Change: -0.63% Day Change: -0.47 | |
| Week Change: -2.81% Year-to-date Change: 8.2% | |
| MKC Links: Profile News Message Board | |
| Charts:- Daily , Weekly | |
| Add MKC to Watchlist: View: Get Complete MKC Trend Analysis ➞ | |
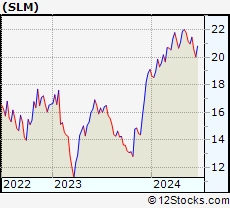 | SLM SLM Corporation |
| Sector: Financials | |
| SubSector: Credit Services | |
| MarketCap: 3099.78 Millions | |
| Recent Price: 21.16 Smart Investing & Trading Score: 41 | |
| Day Percent Change: 0.43% Day Change: 0.09 | |
| Week Change: -2.85% Year-to-date Change: 10.7% | |
| SLM Links: Profile News Message Board | |
| Charts:- Daily , Weekly | |
| Add SLM to Watchlist: View: Get Complete SLM Trend Analysis ➞ | |
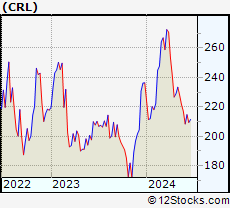 | CRL Charles River Laboratories International, Inc. |
| Sector: Health Care | |
| SubSector: Medical Laboratories & Research | |
| MarketCap: 5700.5 Millions | |
| Recent Price: 221.61 Smart Investing & Trading Score: 0 | |
| Day Percent Change: -1.40% Day Change: -3.14 | |
| Week Change: -2.85% Year-to-date Change: -6.3% | |
| CRL Links: Profile News Message Board | |
| Charts:- Daily , Weekly | |
| Add CRL to Watchlist: View: Get Complete CRL Trend Analysis ➞ | |
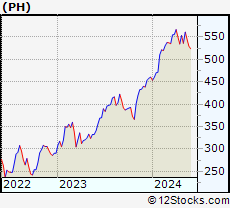 | PH Parker-Hannifin Corporation |
| Sector: Industrials | |
| SubSector: Industrial Equipment & Components | |
| MarketCap: 14888.9 Millions | |
| Recent Price: 545.11 Smart Investing & Trading Score: 26 | |
| Day Percent Change: 1.04% Day Change: 5.62 | |
| Week Change: -2.85% Year-to-date Change: 18.3% | |
| PH Links: Profile News Message Board | |
| Charts:- Daily , Weekly | |
| Add PH to Watchlist: View: Get Complete PH Trend Analysis ➞ | |
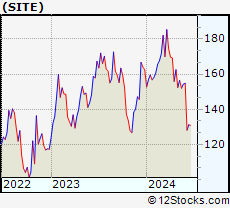 | SITE SiteOne Landscape Supply, Inc. |
| Sector: Industrials | |
| SubSector: Small Tools & Accessories | |
| MarketCap: 2733.56 Millions | |
| Recent Price: 152.02 Smart Investing & Trading Score: 0 | |
| Day Percent Change: -0.82% Day Change: -1.26 | |
| Week Change: -2.86% Year-to-date Change: -6.5% | |
| SITE Links: Profile News Message Board | |
| Charts:- Daily , Weekly | |
| Add SITE to Watchlist: View: Get Complete SITE Trend Analysis ➞ | |
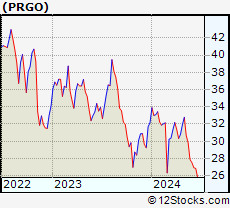 | PRGO Perrigo Company plc |
| Sector: Health Care | |
| SubSector: Drug Related Products | |
| MarketCap: 6493.93 Millions | |
| Recent Price: 29.83 Smart Investing & Trading Score: 36 | |
| Day Percent Change: -0.90% Day Change: -0.27 | |
| Week Change: -2.87% Year-to-date Change: -7.3% | |
| PRGO Links: Profile News Message Board | |
| Charts:- Daily , Weekly | |
| Add PRGO to Watchlist: View: Get Complete PRGO Trend Analysis ➞ | |
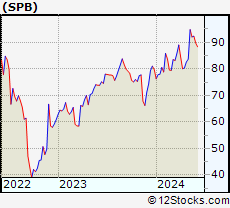 | SPB Spectrum Brands Holdings, Inc. |
| Sector: Consumer Staples | |
| SubSector: Personal Products | |
| MarketCap: 1460.85 Millions | |
| Recent Price: 92.06 Smart Investing & Trading Score: 68 | |
| Day Percent Change: -1.38% Day Change: -1.29 | |
| Week Change: -2.89% Year-to-date Change: 15.4% | |
| SPB Links: Profile News Message Board | |
| Charts:- Daily , Weekly | |
| Add SPB to Watchlist: View: Get Complete SPB Trend Analysis ➞ | |
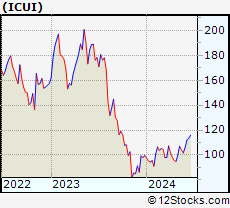 | ICUI ICU Medical, Inc. |
| Sector: Health Care | |
| SubSector: Medical Instruments & Supplies | |
| MarketCap: 3640.7 Millions | |
| Recent Price: 103.99 Smart Investing & Trading Score: 37 | |
| Day Percent Change: -2.15% Day Change: -2.28 | |
| Week Change: -2.9% Year-to-date Change: 4.3% | |
| ICUI Links: Profile News Message Board | |
| Charts:- Daily , Weekly | |
| Add ICUI to Watchlist: View: Get Complete ICUI Trend Analysis ➞ | |
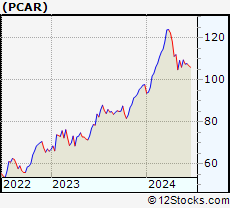 | PCAR PACCAR Inc |
| Sector: Consumer Staples | |
| SubSector: Trucks & Other Vehicles | |
| MarketCap: 19117.7 Millions | |
| Recent Price: 106.00 Smart Investing & Trading Score: 7 | |
| Day Percent Change: 0.07% Day Change: 0.07 | |
| Week Change: -2.91% Year-to-date Change: 8.6% | |
| PCAR Links: Profile News Message Board | |
| Charts:- Daily , Weekly | |
| Add PCAR to Watchlist: View: Get Complete PCAR Trend Analysis ➞ | |
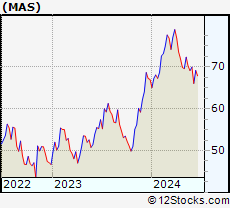 | MAS Masco Corporation |
| Sector: Industrials | |
| SubSector: General Building Materials | |
| MarketCap: 8655.63 Millions | |
| Recent Price: 70.16 Smart Investing & Trading Score: 15 | |
| Day Percent Change: -0.26% Day Change: -0.18 | |
| Week Change: -2.97% Year-to-date Change: 4.8% | |
| MAS Links: Profile News Message Board | |
| Charts:- Daily , Weekly | |
| Add MAS to Watchlist: View: Get Complete MAS Trend Analysis ➞ | |
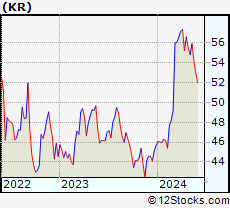 | KR The Kroger Co. |
| Sector: Services & Goods | |
| SubSector: Grocery Stores | |
| MarketCap: 26718.5 Millions | |
| Recent Price: 54.20 Smart Investing & Trading Score: 36 | |
| Day Percent Change: -0.44% Day Change: -0.24 | |
| Week Change: -3.04% Year-to-date Change: 18.6% | |
| KR Links: Profile News Message Board | |
| Charts:- Daily , Weekly | |
| Add KR to Watchlist: View: Get Complete KR Trend Analysis ➞ | |
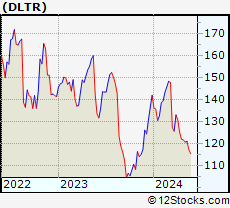 | DLTR Dollar Tree, Inc. |
| Sector: Services & Goods | |
| SubSector: Discount, Variety Stores | |
| MarketCap: 21383.2 Millions | |
| Recent Price: 117.31 Smart Investing & Trading Score: 10 | |
| Day Percent Change: -3.29% Day Change: -3.99 | |
| Week Change: -3.08% Year-to-date Change: -17.4% | |
| DLTR Links: Profile News Message Board | |
| Charts:- Daily , Weekly | |
| Add DLTR to Watchlist: View: Get Complete DLTR Trend Analysis ➞ | |
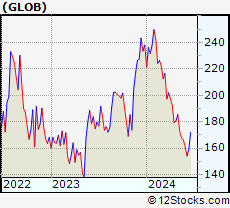 | GLOB Globant S.A. |
| Sector: Technology | |
| SubSector: Information Technology Services | |
| MarketCap: 2976.88 Millions | |
| Recent Price: 167.75 Smart Investing & Trading Score: 10 | |
| Day Percent Change: -5.62% Day Change: -9.98 | |
| Week Change: -3.11% Year-to-date Change: -29.5% | |
| GLOB Links: Profile News Message Board | |
| Charts:- Daily , Weekly | |
| Add GLOB to Watchlist: View: Get Complete GLOB Trend Analysis ➞ | |
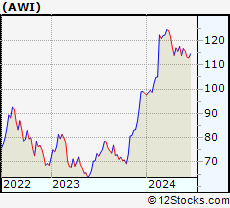 | AWI Armstrong World Industries, Inc. |
| Sector: Industrials | |
| SubSector: General Building Materials | |
| MarketCap: 3609.53 Millions | |
| Recent Price: 113.87 Smart Investing & Trading Score: 0 | |
| Day Percent Change: -0.36% Day Change: -0.41 | |
| Week Change: -3.17% Year-to-date Change: 15.8% | |
| AWI Links: Profile News Message Board | |
| Charts:- Daily , Weekly | |
| Add AWI to Watchlist: View: Get Complete AWI Trend Analysis ➞ | |
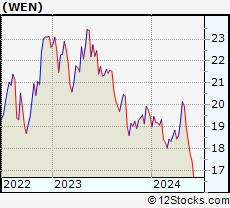 | WEN The Wendy s Company |
| Sector: Services & Goods | |
| SubSector: Restaurants | |
| MarketCap: 2814.9 Millions | |
| Recent Price: 18.39 Smart Investing & Trading Score: 36 | |
| Day Percent Change: -1.13% Day Change: -0.21 | |
| Week Change: -3.21% Year-to-date Change: -5.6% | |
| WEN Links: Profile News Message Board | |
| Charts:- Daily , Weekly | |
| Add WEN to Watchlist: View: Get Complete WEN Trend Analysis ➞ | |
| For tabular summary view of above stock list: Summary View ➞ 0 - 25 , 25 - 50 , 50 - 75 , 75 - 100 , 100 - 125 , 125 - 150 , 150 - 175 , 175 - 200 , 200 - 225 , 225 - 250 , 250 - 275 , 275 - 300 , 300 - 325 , 325 - 350 , 350 - 375 , 375 - 400 , 400 - 425 , 425 - 450 , 450 - 475 , 475 - 500 , 500 - 525 , 525 - 550 , 550 - 575 , 575 - 600 , 600 - 625 , 625 - 650 , 650 - 675 , 675 - 700 , 700 - 725 , 725 - 750 , 750 - 775 | ||
| Click To Change The Sort Order: By Market Cap or Company Size Performance: Year-to-date, Week and Day | |
| Select Chart Type: | ||
|
Best Stocks Today 12Stocks.com |
© 2024 12Stocks.com Terms & Conditions Privacy Contact Us
All Information Provided Only For Education And Not To Be Used For Investing or Trading. See Terms & Conditions


One More Thing ... Get Best Stocks Delivered Daily!
Never Ever Miss A Move With Our Top Ten Stocks Lists
Find Best Stocks In Any Market - Bull or Bear Market
Take A Peek At Our Top Ten Stocks Lists: Daily, Weekly, Year-to-Date & Top Trends
Find Best Stocks In Any Market - Bull or Bear Market
Take A Peek At Our Top Ten Stocks Lists: Daily, Weekly, Year-to-Date & Top Trends
Midcap Stocks With Best Up Trends [0-bearish to 100-bullish]: Robinhood Markets[100], SSR Mining[100], Littelfuse [100], Tractor Supply[100], DuPont de[100], Royal Gold[100], Alcoa [100], Range Resources[100], Arch Capital[100], Evercore [100], Prosperity Bancshares[100]
Best Midcap Stocks Year-to-Date:
Vistra Energy[144.24%], AppLovin [107.29%], Constellation Energy[81.97%], CAVA [77.74%], EMCOR [75.63%], ShockWave Medical[73.24%], Maravai LifeSciences[72.82%], Celsius [70.62%], Tenet [70%], Natera [69.96%], Pure Storage[65.87%] Best Midcap Stocks This Week:
AMC Entertainment[51.2%], Petco Health[50%], NovoCure [33.52%], GameStop [27.21%], Plug Power[26.95%], Robinhood Markets[23.78%], Doximity [19.94%], Ubiquiti [16.29%], Hawaiian Electric[15.12%], MP Materials[13.14%], Victorias Secret[13.12%] Best Midcap Stocks Daily:
Doximity [18.07%], Robinhood Markets[12.23%], Affirm [8.01%], SSR Mining[6.28%], Coinbase Global[4.23%], Littelfuse [4.13%], Rivian Automotive[3.65%], DoubleVerify [3.50%], Tractor Supply[3.42%], Iridium [3.42%], Ubiquiti [3.04%]