
 Login Sign Up


| |||||
 |  | ||||

| 12Stocks.com Market Intelligence |
Best MidCap Stocks
|
| In a hurry? Mid Cap Stocks Lists: Performance Trends Table, Stock Charts
Sort midcap stocks: Daily, Weekly, Year-to-Date, Market Cap & Trends. Filter midcap stocks list by sector: Show all, Tech, Finance, Energy, Staples, Retail, Industrial, Materials, Utilities and HealthCare Filter midcap stocks list by size:All MidCap Large Mid-Range Small |
| 12Stocks.com Mid Cap Stocks Performances & Trends Daily | |||||||||
|
|  The overall Smart Investing & Trading Score is 76 (0-bearish to 100-bullish) which puts Mid Cap index in short term neutral to bullish trend. The Smart Investing & Trading Score from previous trading session is 100 and a deterioration of trend continues.
| ||||||||
Here are the Smart Investing & Trading Scores of the most requested mid cap stocks at 12Stocks.com (click stock name for detailed review):
|


| 12Stocks.com: Top Performing Mid Cap Index Stocks | ||||||||||||||||||||||||||||||||||||||||||||||||
 The top performing Mid Cap Index stocks year to date are
Now, more recently, over last week, the top performing Mid Cap Index stocks on the move are


|
||||||||||||||||||||||||||||||||||||||||||||||||
| 12Stocks.com: Investing in Midcap Index with Stocks | |
|
The following table helps investors and traders sort through current performance and trends (as measured by Smart Investing & Trading Score) of various
stocks in the Midcap Index. Quick View: Move mouse or cursor over stock symbol (ticker) to view short-term technical chart and over stock name to view long term chart. Click on  to add stock symbol to your watchlist and to add stock symbol to your watchlist and  to view watchlist. Click on any ticker or stock name for detailed market intelligence report for that stock. to view watchlist. Click on any ticker or stock name for detailed market intelligence report for that stock. |
12Stocks.com Performance of Stocks in Midcap Index
| Ticker | Stock Name | Watchlist | Category | Recent Price | Smart Investing & Trading Score | Change % | Weekly Change% |
| OC | Owens Corning |   | Industrials | 176.38 | 71 | 1.53% | -0.24% |
| SEIC | SEI s | | Financials | 68.33 | 71 | -0.03% | -0.25% |
| IQV | IQVIA | | Health Care | 231.18 | 25 | -1.63% | -0.25% |
| OVV | Ovintiv | | Energy | 49.79 | 23 | 0.99% | -0.27% |
| MTG | MGIC | | Financials | 21.19 | 73 | 0.43% | -0.28% |
| VRSN | VeriSign | | Technology | 170.75 | 42 | -0.12% | -0.28% |
| LEA | Lear | | Consumer Staples | 130.68 | 17 | -0.39% | -0.30% |
| L | Loews | | Financials | 77.74 | 81 | 0.70% | -0.31% |
| LPLA | LPL Financial | | Financials | 267.77 | 55 | 0.09% | -0.32% |
| OTIS | Otis Worldwide | | Industrials | 96.79 | 76 | 0.24% | -0.32% |
| MSA | MSA Safety | | Services & Goods | 189.15 | 53 | -0.06% | -0.33% |
| SRPT | Sarepta | | Health Care | 131.38 | 58 | -1.02% | -0.33% |
| WSO | Watsco | | Services & Goods | 477.62 | 68 | 1.51% | -0.34% |
| CACI | CACI | | Technology | 426.89 | 83 | 0.12% | -0.34% |
| EXPD | Expeditors | | Transports | 117.90 | 47 | 0.22% | -0.36% |
| TRU | TransUnion | | Services & Goods | 77.72 | 63 | -1.38% | -0.36% |
| FTI | TechnipFMC | | Energy | 26.49 | 53 | 0.08% | -0.41% |
| CARR | Carrier Global | | Industrials | 65.23 | 69 | 0.35% | -0.41% |
| LYV | Live Nation | | Services & Goods | 96.59 | 65 | 0.22% | -0.44% |
| CPRT | Copart | | Services & Goods | 54.50 | 34 | -0.15% | -0.44% |
| TRIP | TripAdvisor | | Technology | 18.10 | 10 | -3.16% | -0.44% |
| CAH | Cardinal Health | | Services & Goods | 99.08 | 32 | 0.39% | -0.45% |
| LYB | LyondellBasell Industries | | Materials | 100.91 | 50 | 0.97% | -0.45% |
| BHF | Brighthouse Financial | | Financials | 45.86 | 25 | -0.78% | -0.46% |
| K | Kellogg | | Consumer Staples | 61.56 | 63 | -0.93% | -0.48% |
| For chart view version of above stock list: Chart View ➞ 0 - 25 , 25 - 50 , 50 - 75 , 75 - 100 , 100 - 125 , 125 - 150 , 150 - 175 , 175 - 200 , 200 - 225 , 225 - 250 , 250 - 275 , 275 - 300 , 300 - 325 , 325 - 350 , 350 - 375 , 375 - 400 , 400 - 425 , 425 - 450 , 450 - 475 , 475 - 500 , 500 - 525 , 525 - 550 , 550 - 575 , 575 - 600 , 600 - 625 , 625 - 650 , 650 - 675 , 675 - 700 , 700 - 725 , 725 - 750 , 750 - 775 | ||
 | Click To Change The Sort Order: By Market Cap or Company Size Performance: Year-to-date, Week and Day |  |
|
Get the most comprehensive stock market coverage daily at 12Stocks.com ➞ Best Stocks Today ➞ Best Stocks Weekly ➞ Best Stocks Year-to-Date ➞ Best Stocks Trends ➞  Best Stocks Today 12Stocks.com Best Nasdaq Stocks ➞ Best S&P 500 Stocks ➞ Best Tech Stocks ➞ Best Biotech Stocks ➞ |
| Detailed Overview of Midcap Stocks |
| Midcap Technical Overview, Leaders & Laggards, Top Midcap ETF Funds & Detailed Midcap Stocks List, Charts, Trends & More |
| Midcap: Technical Analysis, Trends & YTD Performance | |
| MidCap segment as represented by
MDY, an exchange-traded fund [ETF], holds basket of about four hundred midcap stocks from across all major sectors of the US stock market. The midcap index (contains stocks like Green Mountain Coffee Roasters and Tractor Supply Company) is up by 8.73% and is currently underperforming the overall market by -1.84% year-to-date. Below is a quick view of technical charts and trends: | |
 MDY Weekly Chart |
|
| Long Term Trend: Very Good | |
| Medium Term Trend: Very Good | |
 MDY Daily Chart |
|
| Short Term Trend: Not Good | |
| Overall Trend Score: 76 | |
| YTD Performance: 8.73% | |
| **Trend Scores & Views Are Only For Educational Purposes And Not For Investing | |
| 12Stocks.com: Investing in Midcap Index using Exchange Traded Funds | |
|
The following table shows list of key exchange traded funds (ETF) that
help investors track Midcap index. The following list also includes leveraged ETF funds that track twice or thrice the daily returns of Midcap indices. Short or inverse ETF funds move in the opposite direction to the index they track and are useful during market pullbacks or during bear markets. Quick View: Move mouse or cursor over ETF symbol (ticker) to view short-term technical chart and over ETF name to view long term chart. Click on ticker or stock name for detailed view. Click on to add stock symbol to your watchlist and to view watchlist. |
12Stocks.com List of ETFs that track Midcap Index
| Ticker | ETF Name | Watchlist | Recent Price | Smart Investing & Trading Score | Change % | Week % | Year-to-date % |
| IJH | iShares Core S&P Mid-Cap | | 60.31 | 68 | -0.46 | 0.84 | 8.8% |
| MDY | SPDR S&P MidCap 400 ETF | | 551.69 | 76 | 0.11 | 0.84 | 8.73% |
| IWR | iShares Russell Mid-Cap | | 83.29 | 76 | -0.28 | 1.07 | 7.15% |
| IWP | iShares Russell Mid-Cap Growth | | 112.01 | 70 | -0.29 | 1.53 | 7.23% |
| IWS | iShares Russell Mid-Cap Value | | 124.51 | 76 | -0.34 | 0.92 | 7.07% |
| IJK | iShares S&P Mid-Cap 400 Growth | | 90.28 | 71 | -0.05 | 0.39 | 13.96% |
| IJJ | iShares S&P Mid-Cap 400 Value | | 117.71 | 76 | -0.16 | 1.26 | 3.22% |
| MVV | ProShares Ultra MidCap400 | | 66.42 | 76 | 0.02 | 1.65 | 14.74% |
| XMLV | PowerShares S&P MidCap Low Volatil ETF | | 56.93 | 76 | -0.02 | 0.42 | 7.05% |
| UMDD | ProShares UltraPro MidCap400 | | 26.83 | 76 | -0.58 | 1.98 | 20.21% |
| SMDD | ProShares UltraPro Short MidCap400 | | 10.48 | 25 | 0.73 | -1.92 | -22.18% |
| MYY | ProShares Short MidCap400 | | 20.00 | 25 | 0.60 | -0.61 | -6.78% |
| MZZ | ProShares UltraShort MidCap400 | | 10.81 | 27 | 0.49 | -1.25 | -13.98% |
| 12Stocks.com: Charts, Trends, Fundamental Data and Performances of MidCap Stocks | |
|
We now take in-depth look at all MidCap stocks including charts, multi-period performances and overall trends (as measured by Smart Investing & Trading Score). One can sort MidCap stocks (click link to choose) by Daily, Weekly and by Year-to-Date performances. Also, one can sort by size of the company or by market capitalization. |
| Select Your Default Chart Type: | |||||
| |||||
| Click on stock symbol or name for detailed view. Click on to add stock symbol to your watchlist and to view watchlist. Quick View: Move mouse or cursor over "Daily" to quickly view daily technical stock chart and over "Weekly" to view weekly technical stock chart. | |||||

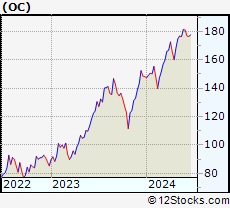 | OC Owens Corning |
| Sector: Industrials | |
| SubSector: General Building Materials | |
| MarketCap: 3686.73 Millions | |
| Recent Price: 176.38 Smart Investing & Trading Score: 71 | |
| Day Percent Change: 1.53% Day Change: 2.66 | |
| Week Change: -0.24% Year-to-date Change: 19.0% | |
| OC Links: Profile News Message Board | |
| Charts:- Daily , Weekly | |
| Add OC to Watchlist: View: Get Complete OC Trend Analysis ➞ | |
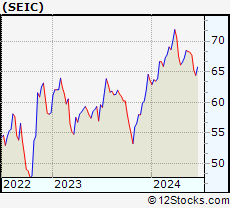 | SEIC SEI Investments Company |
| Sector: Financials | |
| SubSector: Asset Management | |
| MarketCap: 6367.03 Millions | |
| Recent Price: 68.33 Smart Investing & Trading Score: 71 | |
| Day Percent Change: -0.03% Day Change: -0.02 | |
| Week Change: -0.25% Year-to-date Change: 7.5% | |
| SEIC Links: Profile News Message Board | |
| Charts:- Daily , Weekly | |
| Add SEIC to Watchlist: View: Get Complete SEIC Trend Analysis ➞ | |
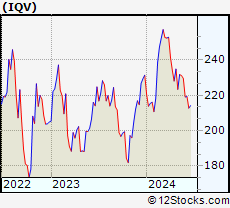 | IQV IQVIA Holdings Inc. |
| Sector: Health Care | |
| SubSector: Medical Laboratories & Research | |
| MarketCap: 19616.5 Millions | |
| Recent Price: 231.18 Smart Investing & Trading Score: 25 | |
| Day Percent Change: -1.63% Day Change: -3.82 | |
| Week Change: -0.25% Year-to-date Change: -0.1% | |
| IQV Links: Profile News Message Board | |
| Charts:- Daily , Weekly | |
| Add IQV to Watchlist: View: Get Complete IQV Trend Analysis ➞ | |
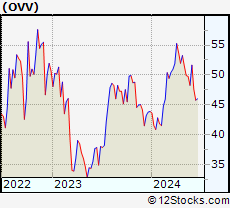 | OVV Ovintiv Inc. |
| Sector: Energy | |
| SubSector: Independent Oil & Gas | |
| MarketCap: 713.793 Millions | |
| Recent Price: 49.79 Smart Investing & Trading Score: 23 | |
| Day Percent Change: 0.99% Day Change: 0.49 | |
| Week Change: -0.27% Year-to-date Change: 13.4% | |
| OVV Links: Profile News Message Board | |
| Charts:- Daily , Weekly | |
| Add OVV to Watchlist: View: Get Complete OVV Trend Analysis ➞ | |
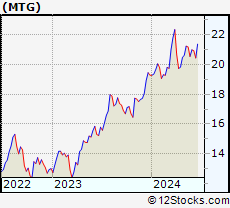 | MTG MGIC Investment Corporation |
| Sector: Financials | |
| SubSector: Property & Casualty Insurance | |
| MarketCap: 2521.62 Millions | |
| Recent Price: 21.19 Smart Investing & Trading Score: 73 | |
| Day Percent Change: 0.43% Day Change: 0.09 | |
| Week Change: -0.28% Year-to-date Change: 9.9% | |
| MTG Links: Profile News Message Board | |
| Charts:- Daily , Weekly | |
| Add MTG to Watchlist: View: Get Complete MTG Trend Analysis ➞ | |
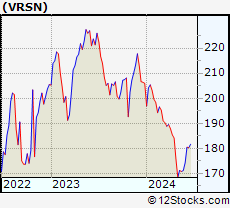 | VRSN VeriSign, Inc. |
| Sector: Technology | |
| SubSector: Internet Information Providers | |
| MarketCap: 19657 Millions | |
| Recent Price: 170.75 Smart Investing & Trading Score: 42 | |
| Day Percent Change: -0.12% Day Change: -0.21 | |
| Week Change: -0.28% Year-to-date Change: -17.1% | |
| VRSN Links: Profile News Message Board | |
| Charts:- Daily , Weekly | |
| Add VRSN to Watchlist: View: Get Complete VRSN Trend Analysis ➞ | |
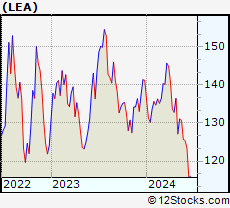 | LEA Lear Corporation |
| Sector: Consumer Staples | |
| SubSector: Auto Parts | |
| MarketCap: 5106.09 Millions | |
| Recent Price: 130.68 Smart Investing & Trading Score: 17 | |
| Day Percent Change: -0.39% Day Change: -0.51 | |
| Week Change: -0.3% Year-to-date Change: -7.5% | |
| LEA Links: Profile News Message Board | |
| Charts:- Daily , Weekly | |
| Add LEA to Watchlist: View: Get Complete LEA Trend Analysis ➞ | |
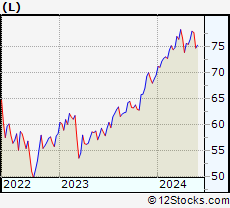 | L Loews Corporation |
| Sector: Financials | |
| SubSector: Property & Casualty Insurance | |
| MarketCap: 10768.2 Millions | |
| Recent Price: 77.74 Smart Investing & Trading Score: 81 | |
| Day Percent Change: 0.70% Day Change: 0.54 | |
| Week Change: -0.31% Year-to-date Change: 11.7% | |
| L Links: Profile News Message Board | |
| Charts:- Daily , Weekly | |
| Add L to Watchlist: View: Get Complete L Trend Analysis ➞ | |
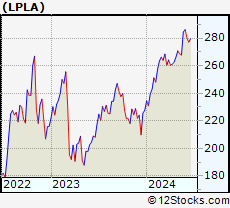 | LPLA LPL Financial Holdings Inc. |
| Sector: Financials | |
| SubSector: Investment Brokerage - National | |
| MarketCap: 4104.65 Millions | |
| Recent Price: 267.77 Smart Investing & Trading Score: 55 | |
| Day Percent Change: 0.09% Day Change: 0.23 | |
| Week Change: -0.32% Year-to-date Change: 17.6% | |
| LPLA Links: Profile News Message Board | |
| Charts:- Daily , Weekly | |
| Add LPLA to Watchlist: View: Get Complete LPLA Trend Analysis ➞ | |
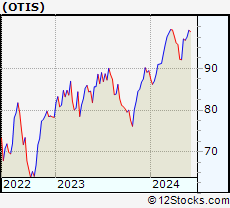 | OTIS Otis Worldwide Corporation |
| Sector: Industrials | |
| SubSector: Specialty Industrial Machinery | |
| MarketCap: 27727 Millions | |
| Recent Price: 96.79 Smart Investing & Trading Score: 76 | |
| Day Percent Change: 0.24% Day Change: 0.23 | |
| Week Change: -0.32% Year-to-date Change: 8.2% | |
| OTIS Links: Profile News Message Board | |
| Charts:- Daily , Weekly | |
| Add OTIS to Watchlist: View: Get Complete OTIS Trend Analysis ➞ | |
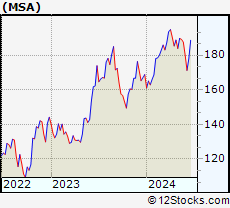 | MSA MSA Safety Incorporated |
| Sector: Services & Goods | |
| SubSector: Security & Protection Services | |
| MarketCap: 4167.83 Millions | |
| Recent Price: 189.15 Smart Investing & Trading Score: 53 | |
| Day Percent Change: -0.06% Day Change: -0.11 | |
| Week Change: -0.33% Year-to-date Change: 12.0% | |
| MSA Links: Profile News Message Board | |
| Charts:- Daily , Weekly | |
| Add MSA to Watchlist: View: Get Complete MSA Trend Analysis ➞ | |
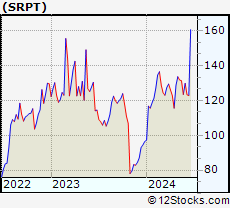 | SRPT Sarepta Therapeutics, Inc. |
| Sector: Health Care | |
| SubSector: Biotechnology | |
| MarketCap: 7388.05 Millions | |
| Recent Price: 131.38 Smart Investing & Trading Score: 58 | |
| Day Percent Change: -1.02% Day Change: -1.36 | |
| Week Change: -0.33% Year-to-date Change: 36.2% | |
| SRPT Links: Profile News Message Board | |
| Charts:- Daily , Weekly | |
| Add SRPT to Watchlist: View: Get Complete SRPT Trend Analysis ➞ | |
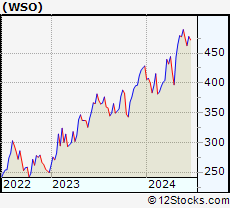 | WSO Watsco, Inc. |
| Sector: Services & Goods | |
| SubSector: Electronics Wholesale | |
| MarketCap: 6000.33 Millions | |
| Recent Price: 477.62 Smart Investing & Trading Score: 68 | |
| Day Percent Change: 1.51% Day Change: 7.10 | |
| Week Change: -0.34% Year-to-date Change: 11.5% | |
| WSO Links: Profile News Message Board | |
| Charts:- Daily , Weekly | |
| Add WSO to Watchlist: View: Get Complete WSO Trend Analysis ➞ | |
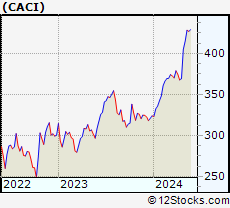 | CACI CACI International Inc |
| Sector: Technology | |
| SubSector: Information Technology Services | |
| MarketCap: 5211.58 Millions | |
| Recent Price: 426.89 Smart Investing & Trading Score: 83 | |
| Day Percent Change: 0.12% Day Change: 0.53 | |
| Week Change: -0.34% Year-to-date Change: 31.8% | |
| CACI Links: Profile News Message Board | |
| Charts:- Daily , Weekly | |
| Add CACI to Watchlist: View: Get Complete CACI Trend Analysis ➞ | |
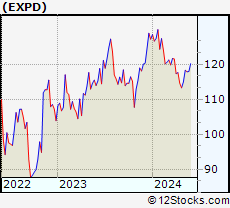 | EXPD Expeditors International of Washington, Inc. |
| Sector: Transports | |
| SubSector: Air Delivery & Freight Services | |
| MarketCap: 10129.8 Millions | |
| Recent Price: 117.90 Smart Investing & Trading Score: 47 | |
| Day Percent Change: 0.22% Day Change: 0.26 | |
| Week Change: -0.36% Year-to-date Change: -7.3% | |
| EXPD Links: Profile News Message Board | |
| Charts:- Daily , Weekly | |
| Add EXPD to Watchlist: View: Get Complete EXPD Trend Analysis ➞ | |
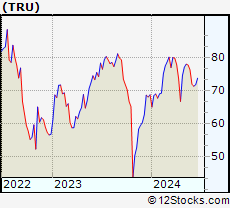 | TRU TransUnion |
| Sector: Services & Goods | |
| SubSector: Business Services | |
| MarketCap: 11457.2 Millions | |
| Recent Price: 77.72 Smart Investing & Trading Score: 63 | |
| Day Percent Change: -1.38% Day Change: -1.09 | |
| Week Change: -0.36% Year-to-date Change: 13.1% | |
| TRU Links: Profile News Message Board | |
| Charts:- Daily , Weekly | |
| Add TRU to Watchlist: View: Get Complete TRU Trend Analysis ➞ | |
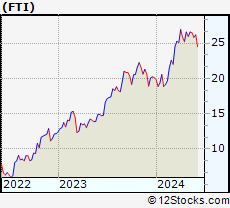 | FTI TechnipFMC plc |
| Sector: Energy | |
| SubSector: Oil & Gas Equipment & Services | |
| MarketCap: 3406.71 Millions | |
| Recent Price: 26.49 Smart Investing & Trading Score: 53 | |
| Day Percent Change: 0.08% Day Change: 0.02 | |
| Week Change: -0.41% Year-to-date Change: 31.5% | |
| FTI Links: Profile News Message Board | |
| Charts:- Daily , Weekly | |
| Add FTI to Watchlist: View: Get Complete FTI Trend Analysis ➞ | |
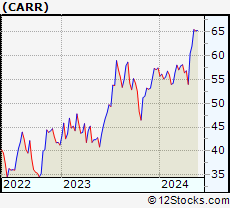 | CARR Carrier Global Corporation |
| Sector: Industrials | |
| SubSector: Building Products & Equipment | |
| MarketCap: 32547 Millions | |
| Recent Price: 65.23 Smart Investing & Trading Score: 69 | |
| Day Percent Change: 0.35% Day Change: 0.23 | |
| Week Change: -0.41% Year-to-date Change: 13.5% | |
| CARR Links: Profile News Message Board | |
| Charts:- Daily , Weekly | |
| Add CARR to Watchlist: View: Get Complete CARR Trend Analysis ➞ | |
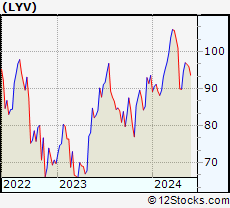 | LYV Live Nation Entertainment, Inc. |
| Sector: Services & Goods | |
| SubSector: Entertainment - Diversified | |
| MarketCap: 8457.17 Millions | |
| Recent Price: 96.59 Smart Investing & Trading Score: 65 | |
| Day Percent Change: 0.22% Day Change: 0.21 | |
| Week Change: -0.44% Year-to-date Change: 3.2% | |
| LYV Links: Profile News Message Board | |
| Charts:- Daily , Weekly | |
| Add LYV to Watchlist: View: Get Complete LYV Trend Analysis ➞ | |
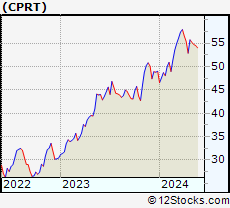 | CPRT Copart, Inc. |
| Sector: Services & Goods | |
| SubSector: Auto Dealerships | |
| MarketCap: 15462.1 Millions | |
| Recent Price: 54.50 Smart Investing & Trading Score: 34 | |
| Day Percent Change: -0.15% Day Change: -0.08 | |
| Week Change: -0.44% Year-to-date Change: 11.2% | |
| CPRT Links: Profile News Message Board | |
| Charts:- Daily , Weekly | |
| Add CPRT to Watchlist: View: Get Complete CPRT Trend Analysis ➞ | |
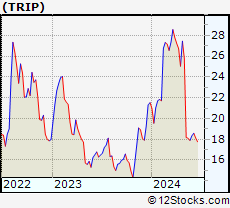 | TRIP TripAdvisor, Inc. |
| Sector: Technology | |
| SubSector: Internet Information Providers | |
| MarketCap: 2633.9 Millions | |
| Recent Price: 18.10 Smart Investing & Trading Score: 10 | |
| Day Percent Change: -3.16% Day Change: -0.59 | |
| Week Change: -0.44% Year-to-date Change: -15.9% | |
| TRIP Links: Profile News Message Board | |
| Charts:- Daily , Weekly | |
| Add TRIP to Watchlist: View: Get Complete TRIP Trend Analysis ➞ | |
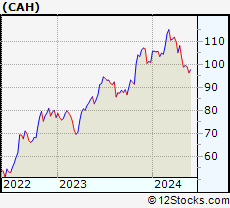 | CAH Cardinal Health, Inc. |
| Sector: Services & Goods | |
| SubSector: Drugs Wholesale | |
| MarketCap: 14509.9 Millions | |
| Recent Price: 99.08 Smart Investing & Trading Score: 32 | |
| Day Percent Change: 0.39% Day Change: 0.38 | |
| Week Change: -0.45% Year-to-date Change: -1.7% | |
| CAH Links: Profile News Message Board | |
| Charts:- Daily , Weekly | |
| Add CAH to Watchlist: View: Get Complete CAH Trend Analysis ➞ | |
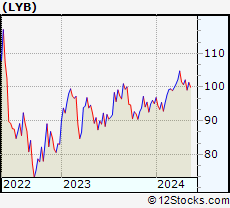 | LYB LyondellBasell Industries N.V. |
| Sector: Materials | |
| SubSector: Specialty Chemicals | |
| MarketCap: 16420.7 Millions | |
| Recent Price: 100.91 Smart Investing & Trading Score: 50 | |
| Day Percent Change: 0.97% Day Change: 0.97 | |
| Week Change: -0.45% Year-to-date Change: 6.1% | |
| LYB Links: Profile News Message Board | |
| Charts:- Daily , Weekly | |
| Add LYB to Watchlist: View: Get Complete LYB Trend Analysis ➞ | |
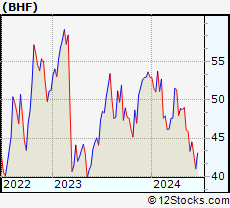 | BHF Brighthouse Financial, Inc. |
| Sector: Financials | |
| SubSector: Life Insurance | |
| MarketCap: 2045.06 Millions | |
| Recent Price: 45.86 Smart Investing & Trading Score: 25 | |
| Day Percent Change: -0.78% Day Change: -0.36 | |
| Week Change: -0.46% Year-to-date Change: -13.3% | |
| BHF Links: Profile News Message Board | |
| Charts:- Daily , Weekly | |
| Add BHF to Watchlist: View: Get Complete BHF Trend Analysis ➞ | |
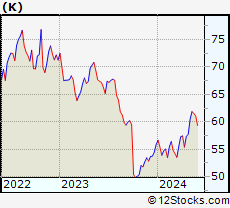 | K Kellogg Company |
| Sector: Consumer Staples | |
| SubSector: Processed & Packaged Goods | |
| MarketCap: 20264.6 Millions | |
| Recent Price: 61.56 Smart Investing & Trading Score: 63 | |
| Day Percent Change: -0.93% Day Change: -0.58 | |
| Week Change: -0.48% Year-to-date Change: 10.1% | |
| K Links: Profile News Message Board | |
| Charts:- Daily , Weekly | |
| Add K to Watchlist: View: Get Complete K Trend Analysis ➞ | |
| For tabular summary view of above stock list: Summary View ➞ 0 - 25 , 25 - 50 , 50 - 75 , 75 - 100 , 100 - 125 , 125 - 150 , 150 - 175 , 175 - 200 , 200 - 225 , 225 - 250 , 250 - 275 , 275 - 300 , 300 - 325 , 325 - 350 , 350 - 375 , 375 - 400 , 400 - 425 , 425 - 450 , 450 - 475 , 475 - 500 , 500 - 525 , 525 - 550 , 550 - 575 , 575 - 600 , 600 - 625 , 625 - 650 , 650 - 675 , 675 - 700 , 700 - 725 , 725 - 750 , 750 - 775 | ||
| Click To Change The Sort Order: By Market Cap or Company Size Performance: Year-to-date, Week and Day | |
| Select Chart Type: | ||
|
Best Stocks Today 12Stocks.com |
© 2024 12Stocks.com Terms & Conditions Privacy Contact Us
All Information Provided Only For Education And Not To Be Used For Investing or Trading. See Terms & Conditions


One More Thing ... Get Best Stocks Delivered Daily!
Never Ever Miss A Move With Our Top Ten Stocks Lists
Find Best Stocks In Any Market - Bull or Bear Market
Take A Peek At Our Top Ten Stocks Lists: Daily, Weekly, Year-to-Date & Top Trends
Find Best Stocks In Any Market - Bull or Bear Market
Take A Peek At Our Top Ten Stocks Lists: Daily, Weekly, Year-to-Date & Top Trends
Midcap Stocks With Best Up Trends [0-bearish to 100-bullish]: Robinhood Markets[100], SSR Mining[100], Littelfuse [100], Tractor Supply[100], DuPont de[100], Royal Gold[100], Alcoa [100], Range Resources[100], Arch Capital[100], Evercore [100], Prosperity Bancshares[100]
Best Midcap Stocks Year-to-Date:
Vistra Energy[144.24%], AppLovin [107.29%], Constellation Energy[81.97%], CAVA [77.74%], EMCOR [75.63%], ShockWave Medical[73.24%], Maravai LifeSciences[72.82%], Celsius [70.62%], Tenet [70%], Natera [69.96%], Pure Storage[65.87%] Best Midcap Stocks This Week:
AMC Entertainment[51.2%], Petco Health[50%], NovoCure [33.52%], GameStop [27.21%], Plug Power[26.95%], Robinhood Markets[23.78%], Doximity [19.94%], Ubiquiti [16.29%], Hawaiian Electric[15.12%], MP Materials[13.14%], Victorias Secret[13.12%] Best Midcap Stocks Daily:
Doximity [18.07%], Robinhood Markets[12.23%], Affirm [8.01%], SSR Mining[6.28%], Coinbase Global[4.23%], Littelfuse [4.13%], Rivian Automotive[3.65%], DoubleVerify [3.50%], Tractor Supply[3.42%], Iridium [3.42%], Ubiquiti [3.04%]