
 Login Sign Up


| |||||
 |  | ||||

| 12Stocks.com Market Intelligence |
Best MidCap Stocks
|
| In a hurry? Mid Cap Stocks Lists: Performance Trends Table, Stock Charts
Sort midcap stocks: Daily, Weekly, Year-to-Date, Market Cap & Trends. Filter midcap stocks list by sector: Show all, Tech, Finance, Energy, Staples, Retail, Industrial, Materials, Utilities and HealthCare Filter midcap stocks list by size:All MidCap Large Mid-Range Small |
| 12Stocks.com Mid Cap Stocks Performances & Trends Daily | |||||||||
|
|  The overall Smart Investing & Trading Score is 76 (0-bearish to 100-bullish) which puts Mid Cap index in short term neutral to bullish trend. The Smart Investing & Trading Score from previous trading session is 100 and a deterioration of trend continues.
| ||||||||
Here are the Smart Investing & Trading Scores of the most requested mid cap stocks at 12Stocks.com (click stock name for detailed review):
|


| 12Stocks.com: Top Performing Mid Cap Index Stocks | ||||||||||||||||||||||||||||||||||||||||||||||||
 The top performing Mid Cap Index stocks year to date are
Now, more recently, over last week, the top performing Mid Cap Index stocks on the move are


|
||||||||||||||||||||||||||||||||||||||||||||||||
| 12Stocks.com: Investing in Midcap Index with Stocks | |
|
The following table helps investors and traders sort through current performance and trends (as measured by Smart Investing & Trading Score) of various
stocks in the Midcap Index. Quick View: Move mouse or cursor over stock symbol (ticker) to view short-term technical chart and over stock name to view long term chart. Click on  to add stock symbol to your watchlist and to add stock symbol to your watchlist and  to view watchlist. Click on any ticker or stock name for detailed market intelligence report for that stock. to view watchlist. Click on any ticker or stock name for detailed market intelligence report for that stock. |
12Stocks.com Performance of Stocks in Midcap Index
| Ticker | Stock Name | Watchlist | Category | Recent Price | Smart Investing & Trading Score | Change % | Weekly Change% |
| NNN | National Retail |   | Financials | 42.56 | 76 | 0.40% | 0.71% |
| TXT | Textron | | Industrials | 89.17 | 77 | 1.93% | 0.70% |
| WDC | Western Digital | | Technology | 72.10 | 53 | -2.70% | 0.70% |
| MKL | Markel | | Financials | 1663.21 | 90 | 0.64% | 0.67% |
| IDA | IDACORP | | Utilities | 98.47 | 90 | -0.50% | 0.67% |
| WSC | WillScot | | Transports | 40.65 | 64 | 2.63% | 0.66% |
| ZBRA | Zebra Technologies | | Technology | 317.89 | 68 | -0.62% | 0.66% |
| LBRDK | Liberty Broadband | | Services & Goods | 53.41 | 57 | -1.17% | 0.66% |
| WY | Weyerhaeuser | | Industrials | 31.17 | 37 | 0.19% | 0.65% |
| USFD | US Foods | | Consumer Staples | 55.16 | 83 | 0.44% | 0.64% |
| ADC | Agree Realty | | Financials | 60.53 | 83 | 0.28% | 0.63% |
| RCL | Royal Caribbean | | Services & Goods | 141.92 | 73 | -0.66% | 0.62% |
| PPC | Pilgrim s | | Consumer Staples | 37.36 | 58 | -0.90% | 0.62% |
| FRT | Federal Realty | | Financials | 102.33 | 73 | 0.69% | 0.60% |
| FCN | FTI Consulting | | Services & Goods | 223.10 | 90 | 0.57% | 0.60% |
| TOST | Toast | | Technology | 26.99 | 76 | -1.96% | 0.60% |
| RPM | RPM | | Materials | 113.51 | 40 | 0.39% | 0.59% |
| STE | STERIS | | Health Care | 232.69 | 55 | 0.85% | 0.59% |
| RJF | Raymond James | | Financials | 126.42 | 66 | 0.65% | 0.57% |
| PAG | Penske Automotive | | Services & Goods | 156.25 | 51 | -2.18% | 0.55% |
| CDW | CDW | | Technology | 223.64 | 39 | -0.22% | 0.53% |
| TRMB | Trimble | | Technology | 57.09 | 10 | -0.28% | 0.51% |
| EQR | Equity Residential | | Financials | 67.13 | 76 | 0.06% | 0.49% |
| CBSH | Commerce Bancshares | | Financials | 56.96 | 86 | 1.24% | 0.49% |
| CMS | CMS Energy | | Utilities | 63.24 | 83 | 0.14% | 0.49% |
| For chart view version of above stock list: Chart View ➞ 0 - 25 , 25 - 50 , 50 - 75 , 75 - 100 , 100 - 125 , 125 - 150 , 150 - 175 , 175 - 200 , 200 - 225 , 225 - 250 , 250 - 275 , 275 - 300 , 300 - 325 , 325 - 350 , 350 - 375 , 375 - 400 , 400 - 425 , 425 - 450 , 450 - 475 , 475 - 500 , 500 - 525 , 525 - 550 , 550 - 575 , 575 - 600 , 600 - 625 , 625 - 650 , 650 - 675 , 675 - 700 , 700 - 725 , 725 - 750 , 750 - 775 | ||
 | Click To Change The Sort Order: By Market Cap or Company Size Performance: Year-to-date, Week and Day |  |
|
Get the most comprehensive stock market coverage daily at 12Stocks.com ➞ Best Stocks Today ➞ Best Stocks Weekly ➞ Best Stocks Year-to-Date ➞ Best Stocks Trends ➞  Best Stocks Today 12Stocks.com Best Nasdaq Stocks ➞ Best S&P 500 Stocks ➞ Best Tech Stocks ➞ Best Biotech Stocks ➞ |
| Detailed Overview of Midcap Stocks |
| Midcap Technical Overview, Leaders & Laggards, Top Midcap ETF Funds & Detailed Midcap Stocks List, Charts, Trends & More |
| Midcap: Technical Analysis, Trends & YTD Performance | |
| MidCap segment as represented by
MDY, an exchange-traded fund [ETF], holds basket of about four hundred midcap stocks from across all major sectors of the US stock market. The midcap index (contains stocks like Green Mountain Coffee Roasters and Tractor Supply Company) is up by 8.73% and is currently underperforming the overall market by -1.84% year-to-date. Below is a quick view of technical charts and trends: | |
 MDY Weekly Chart |
|
| Long Term Trend: Very Good | |
| Medium Term Trend: Very Good | |
 MDY Daily Chart |
|
| Short Term Trend: Not Good | |
| Overall Trend Score: 76 | |
| YTD Performance: 8.73% | |
| **Trend Scores & Views Are Only For Educational Purposes And Not For Investing | |
| 12Stocks.com: Investing in Midcap Index using Exchange Traded Funds | |
|
The following table shows list of key exchange traded funds (ETF) that
help investors track Midcap index. The following list also includes leveraged ETF funds that track twice or thrice the daily returns of Midcap indices. Short or inverse ETF funds move in the opposite direction to the index they track and are useful during market pullbacks or during bear markets. Quick View: Move mouse or cursor over ETF symbol (ticker) to view short-term technical chart and over ETF name to view long term chart. Click on ticker or stock name for detailed view. Click on to add stock symbol to your watchlist and to view watchlist. |
12Stocks.com List of ETFs that track Midcap Index
| Ticker | ETF Name | Watchlist | Recent Price | Smart Investing & Trading Score | Change % | Week % | Year-to-date % |
| IJH | iShares Core S&P Mid-Cap | | 60.31 | 68 | -0.46 | 0.84 | 8.8% |
| MDY | SPDR S&P MidCap 400 ETF | | 551.69 | 76 | 0.11 | 0.84 | 8.73% |
| IWR | iShares Russell Mid-Cap | | 83.29 | 76 | -0.28 | 1.07 | 7.15% |
| IWP | iShares Russell Mid-Cap Growth | | 112.01 | 70 | -0.29 | 1.53 | 7.23% |
| IWS | iShares Russell Mid-Cap Value | | 124.51 | 76 | -0.34 | 0.92 | 7.07% |
| IJK | iShares S&P Mid-Cap 400 Growth | | 90.28 | 71 | -0.05 | 0.39 | 13.96% |
| IJJ | iShares S&P Mid-Cap 400 Value | | 117.71 | 76 | -0.16 | 1.26 | 3.22% |
| MVV | ProShares Ultra MidCap400 | | 66.42 | 76 | 0.02 | 1.65 | 14.74% |
| XMLV | PowerShares S&P MidCap Low Volatil ETF | | 56.93 | 76 | -0.02 | 0.42 | 7.05% |
| UMDD | ProShares UltraPro MidCap400 | | 26.83 | 76 | -0.58 | 1.98 | 20.21% |
| SMDD | ProShares UltraPro Short MidCap400 | | 10.48 | 25 | 0.73 | -1.92 | -22.18% |
| MYY | ProShares Short MidCap400 | | 20.00 | 25 | 0.60 | -0.61 | -6.78% |
| MZZ | ProShares UltraShort MidCap400 | | 10.81 | 27 | 0.49 | -1.25 | -13.98% |
| 12Stocks.com: Charts, Trends, Fundamental Data and Performances of MidCap Stocks | |
|
We now take in-depth look at all MidCap stocks including charts, multi-period performances and overall trends (as measured by Smart Investing & Trading Score). One can sort MidCap stocks (click link to choose) by Daily, Weekly and by Year-to-Date performances. Also, one can sort by size of the company or by market capitalization. |
| Select Your Default Chart Type: | |||||
| |||||
| Click on stock symbol or name for detailed view. Click on to add stock symbol to your watchlist and to view watchlist. Quick View: Move mouse or cursor over "Daily" to quickly view daily technical stock chart and over "Weekly" to view weekly technical stock chart. | |||||

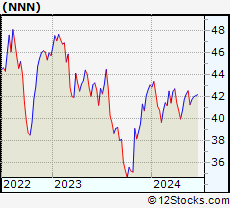 | NNN National Retail Properties, Inc. |
| Sector: Financials | |
| SubSector: REIT - Diversified | |
| MarketCap: 5459.93 Millions | |
| Recent Price: 42.56 Smart Investing & Trading Score: 76 | |
| Day Percent Change: 0.40% Day Change: 0.17 | |
| Week Change: 0.71% Year-to-date Change: -1.3% | |
| NNN Links: Profile News Message Board | |
| Charts:- Daily , Weekly | |
| Add NNN to Watchlist: View: Get Complete NNN Trend Analysis ➞ | |
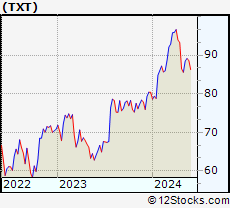 | TXT Textron Inc. |
| Sector: Industrials | |
| SubSector: Aerospace/Defense - Major Diversified | |
| MarketCap: 6123.09 Millions | |
| Recent Price: 89.17 Smart Investing & Trading Score: 77 | |
| Day Percent Change: 1.93% Day Change: 1.69 | |
| Week Change: 0.7% Year-to-date Change: 10.9% | |
| TXT Links: Profile News Message Board | |
| Charts:- Daily , Weekly | |
| Add TXT to Watchlist: View: Get Complete TXT Trend Analysis ➞ | |
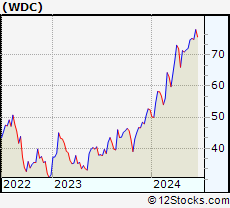 | WDC Western Digital Corporation |
| Sector: Technology | |
| SubSector: Data Storage Devices | |
| MarketCap: 10712.9 Millions | |
| Recent Price: 72.10 Smart Investing & Trading Score: 53 | |
| Day Percent Change: -2.70% Day Change: -2.00 | |
| Week Change: 0.7% Year-to-date Change: 37.7% | |
| WDC Links: Profile News Message Board | |
| Charts:- Daily , Weekly | |
| Add WDC to Watchlist: View: Get Complete WDC Trend Analysis ➞ | |
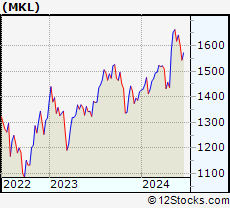 | MKL Markel Corporation |
| Sector: Financials | |
| SubSector: Property & Casualty Insurance | |
| MarketCap: 12405.9 Millions | |
| Recent Price: 1663.21 Smart Investing & Trading Score: 90 | |
| Day Percent Change: 0.64% Day Change: 10.63 | |
| Week Change: 0.67% Year-to-date Change: 17.1% | |
| MKL Links: Profile News Message Board | |
| Charts:- Daily , Weekly | |
| Add MKL to Watchlist: View: Get Complete MKL Trend Analysis ➞ | |
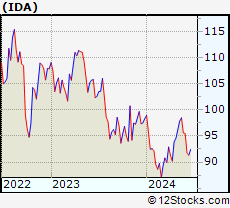 | IDA IDACORP, Inc. |
| Sector: Utilities | |
| SubSector: Electric Utilities | |
| MarketCap: 4340.14 Millions | |
| Recent Price: 98.47 Smart Investing & Trading Score: 90 | |
| Day Percent Change: -0.50% Day Change: -0.49 | |
| Week Change: 0.67% Year-to-date Change: 0.2% | |
| IDA Links: Profile News Message Board | |
| Charts:- Daily , Weekly | |
| Add IDA to Watchlist: View: Get Complete IDA Trend Analysis ➞ | |
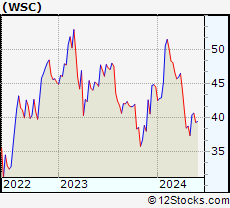 | WSC WillScot Corporation |
| Sector: Transports | |
| SubSector: Rental & Leasing Services | |
| MarketCap: 1050.44 Millions | |
| Recent Price: 40.65 Smart Investing & Trading Score: 64 | |
| Day Percent Change: 2.63% Day Change: 1.04 | |
| Week Change: 0.66% Year-to-date Change: -8.7% | |
| WSC Links: Profile News Message Board | |
| Charts:- Daily , Weekly | |
| Add WSC to Watchlist: View: Get Complete WSC Trend Analysis ➞ | |
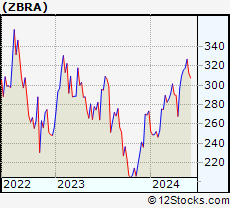 | ZBRA Zebra Technologies Corporation |
| Sector: Technology | |
| SubSector: Communication Equipment | |
| MarketCap: 11474.9 Millions | |
| Recent Price: 317.89 Smart Investing & Trading Score: 68 | |
| Day Percent Change: -0.62% Day Change: -1.97 | |
| Week Change: 0.66% Year-to-date Change: 16.3% | |
| ZBRA Links: Profile News Message Board | |
| Charts:- Daily , Weekly | |
| Add ZBRA to Watchlist: View: Get Complete ZBRA Trend Analysis ➞ | |
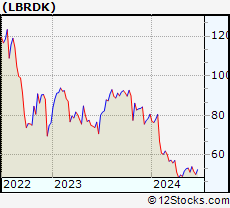 | LBRDK Liberty Broadband Corporation |
| Sector: Services & Goods | |
| SubSector: Broadcasting - TV | |
| MarketCap: 13847.3 Millions | |
| Recent Price: 53.41 Smart Investing & Trading Score: 57 | |
| Day Percent Change: -1.17% Day Change: -0.63 | |
| Week Change: 0.66% Year-to-date Change: -33.7% | |
| LBRDK Links: Profile News Message Board | |
| Charts:- Daily , Weekly | |
| Add LBRDK to Watchlist: View: Get Complete LBRDK Trend Analysis ➞ | |
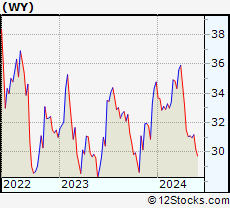 | WY Weyerhaeuser Company |
| Sector: Industrials | |
| SubSector: Lumber, Wood Production | |
| MarketCap: 13244.8 Millions | |
| Recent Price: 31.17 Smart Investing & Trading Score: 37 | |
| Day Percent Change: 0.19% Day Change: 0.06 | |
| Week Change: 0.65% Year-to-date Change: -10.4% | |
| WY Links: Profile News Message Board | |
| Charts:- Daily , Weekly | |
| Add WY to Watchlist: View: Get Complete WY Trend Analysis ➞ | |
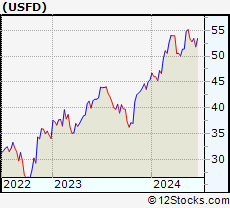 | USFD US Foods Holding Corp. |
| Sector: Consumer Staples | |
| SubSector: Food Wholesale | |
| MarketCap: 3740.99 Millions | |
| Recent Price: 55.16 Smart Investing & Trading Score: 83 | |
| Day Percent Change: 0.44% Day Change: 0.24 | |
| Week Change: 0.64% Year-to-date Change: 21.5% | |
| USFD Links: Profile News Message Board | |
| Charts:- Daily , Weekly | |
| Add USFD to Watchlist: View: Get Complete USFD Trend Analysis ➞ | |
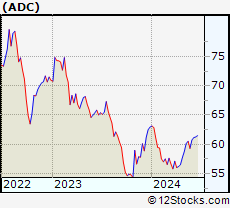 | ADC Agree Realty Corporation |
| Sector: Financials | |
| SubSector: Property Management | |
| MarketCap: 2573.82 Millions | |
| Recent Price: 60.53 Smart Investing & Trading Score: 83 | |
| Day Percent Change: 0.28% Day Change: 0.17 | |
| Week Change: 0.63% Year-to-date Change: -3.8% | |
| ADC Links: Profile News Message Board | |
| Charts:- Daily , Weekly | |
| Add ADC to Watchlist: View: Get Complete ADC Trend Analysis ➞ | |
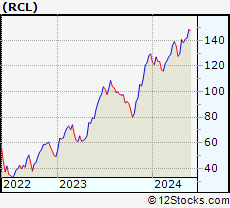 | RCL Royal Caribbean Cruises Ltd. |
| Sector: Services & Goods | |
| SubSector: Resorts & Casinos | |
| MarketCap: 7294.14 Millions | |
| Recent Price: 141.92 Smart Investing & Trading Score: 73 | |
| Day Percent Change: -0.66% Day Change: -0.94 | |
| Week Change: 0.62% Year-to-date Change: 9.6% | |
| RCL Links: Profile News Message Board | |
| Charts:- Daily , Weekly | |
| Add RCL to Watchlist: View: Get Complete RCL Trend Analysis ➞ | |
 | PPC Pilgrim s Pride Corporation |
| Sector: Consumer Staples | |
| SubSector: Food - Major Diversified | |
| MarketCap: 4737.03 Millions | |
| Recent Price: 37.36 Smart Investing & Trading Score: 58 | |
| Day Percent Change: -0.90% Day Change: -0.34 | |
| Week Change: 0.62% Year-to-date Change: 35.1% | |
| PPC Links: Profile News Message Board | |
| Charts:- Daily , Weekly | |
| Add PPC to Watchlist: View: Get Complete PPC Trend Analysis ➞ | |
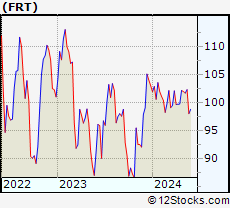 | FRT Federal Realty Investment Trust |
| Sector: Financials | |
| SubSector: REIT - Retail | |
| MarketCap: 5878.64 Millions | |
| Recent Price: 102.33 Smart Investing & Trading Score: 73 | |
| Day Percent Change: 0.69% Day Change: 0.70 | |
| Week Change: 0.6% Year-to-date Change: -0.7% | |
| FRT Links: Profile News Message Board | |
| Charts:- Daily , Weekly | |
| Add FRT to Watchlist: View: Get Complete FRT Trend Analysis ➞ | |
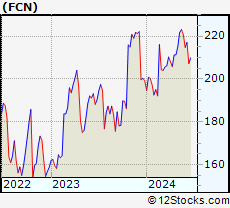 | FCN FTI Consulting, Inc. |
| Sector: Services & Goods | |
| SubSector: Management Services | |
| MarketCap: 4485.05 Millions | |
| Recent Price: 223.10 Smart Investing & Trading Score: 90 | |
| Day Percent Change: 0.57% Day Change: 1.26 | |
| Week Change: 0.6% Year-to-date Change: 12.0% | |
| FCN Links: Profile News Message Board | |
| Charts:- Daily , Weekly | |
| Add FCN to Watchlist: View: Get Complete FCN Trend Analysis ➞ | |
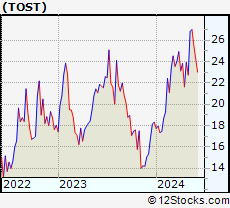 | TOST Toast, Inc. |
| Sector: Technology | |
| SubSector: Software - Infrastructure | |
| MarketCap: 11680 Millions | |
| Recent Price: 26.99 Smart Investing & Trading Score: 76 | |
| Day Percent Change: -1.96% Day Change: -0.54 | |
| Week Change: 0.6% Year-to-date Change: 47.4% | |
| TOST Links: Profile News Message Board | |
| Charts:- Daily , Weekly | |
| Add TOST to Watchlist: View: Get Complete TOST Trend Analysis ➞ | |
 | RPM RPM International Inc. |
| Sector: Materials | |
| SubSector: Specialty Chemicals | |
| MarketCap: 6814.87 Millions | |
| Recent Price: 113.51 Smart Investing & Trading Score: 40 | |
| Day Percent Change: 0.39% Day Change: 0.44 | |
| Week Change: 0.59% Year-to-date Change: 1.7% | |
| RPM Links: Profile News Message Board | |
| Charts:- Daily , Weekly | |
| Add RPM to Watchlist: View: Get Complete RPM Trend Analysis ➞ | |
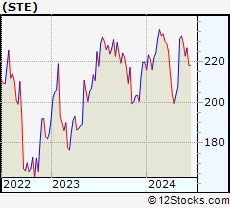 | STE STERIS plc |
| Sector: Health Care | |
| SubSector: Medical Instruments & Supplies | |
| MarketCap: 10875 Millions | |
| Recent Price: 232.69 Smart Investing & Trading Score: 55 | |
| Day Percent Change: 0.85% Day Change: 1.96 | |
| Week Change: 0.59% Year-to-date Change: 5.8% | |
| STE Links: Profile News Message Board | |
| Charts:- Daily , Weekly | |
| Add STE to Watchlist: View: Get Complete STE Trend Analysis ➞ | |
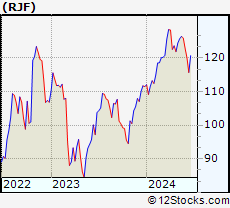 | RJF Raymond James Financial, Inc. |
| Sector: Financials | |
| SubSector: Investment Brokerage - Regional | |
| MarketCap: 9490.65 Millions | |
| Recent Price: 126.42 Smart Investing & Trading Score: 66 | |
| Day Percent Change: 0.65% Day Change: 0.82 | |
| Week Change: 0.57% Year-to-date Change: 13.4% | |
| RJF Links: Profile News Message Board | |
| Charts:- Daily , Weekly | |
| Add RJF to Watchlist: View: Get Complete RJF Trend Analysis ➞ | |
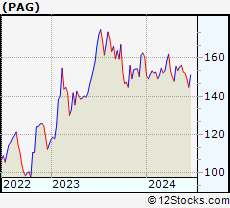 | PAG Penske Automotive Group, Inc. |
| Sector: Services & Goods | |
| SubSector: Auto Dealerships | |
| MarketCap: 2088.81 Millions | |
| Recent Price: 156.25 Smart Investing & Trading Score: 51 | |
| Day Percent Change: -2.18% Day Change: -3.49 | |
| Week Change: 0.55% Year-to-date Change: -2.7% | |
| PAG Links: Profile News Message Board | |
| Charts:- Daily , Weekly | |
| Add PAG to Watchlist: View: Get Complete PAG Trend Analysis ➞ | |
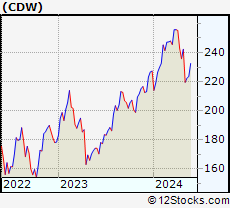 | CDW CDW Corporation |
| Sector: Technology | |
| SubSector: Information Technology Services | |
| MarketCap: 12775 Millions | |
| Recent Price: 223.64 Smart Investing & Trading Score: 39 | |
| Day Percent Change: -0.22% Day Change: -0.50 | |
| Week Change: 0.53% Year-to-date Change: -1.6% | |
| CDW Links: Profile News Message Board | |
| Charts:- Daily , Weekly | |
| Add CDW to Watchlist: View: Get Complete CDW Trend Analysis ➞ | |
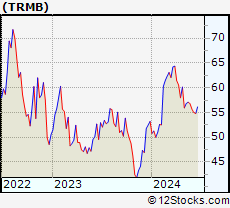 | TRMB Trimble Inc. |
| Sector: Technology | |
| SubSector: Scientific & Technical Instruments | |
| MarketCap: 7990.33 Millions | |
| Recent Price: 57.09 Smart Investing & Trading Score: 10 | |
| Day Percent Change: -0.28% Day Change: -0.16 | |
| Week Change: 0.51% Year-to-date Change: 7.3% | |
| TRMB Links: Profile News Message Board | |
| Charts:- Daily , Weekly | |
| Add TRMB to Watchlist: View: Get Complete TRMB Trend Analysis ➞ | |
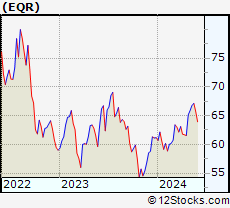 | EQR Equity Residential |
| Sector: Financials | |
| SubSector: REIT - Residential | |
| MarketCap: 22061.9 Millions | |
| Recent Price: 67.13 Smart Investing & Trading Score: 76 | |
| Day Percent Change: 0.06% Day Change: 0.04 | |
| Week Change: 0.49% Year-to-date Change: 9.8% | |
| EQR Links: Profile News Message Board | |
| Charts:- Daily , Weekly | |
| Add EQR to Watchlist: View: Get Complete EQR Trend Analysis ➞ | |
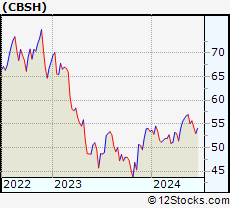 | CBSH Commerce Bancshares, Inc. |
| Sector: Financials | |
| SubSector: Regional - Midwest Banks | |
| MarketCap: 6201.5 Millions | |
| Recent Price: 56.96 Smart Investing & Trading Score: 86 | |
| Day Percent Change: 1.24% Day Change: 0.70 | |
| Week Change: 0.49% Year-to-date Change: 6.7% | |
| CBSH Links: Profile News Message Board | |
| Charts:- Daily , Weekly | |
| Add CBSH to Watchlist: View: Get Complete CBSH Trend Analysis ➞ | |
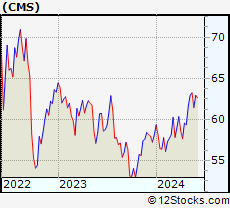 | CMS CMS Energy Corporation |
| Sector: Utilities | |
| SubSector: Electric Utilities | |
| MarketCap: 15105.8 Millions | |
| Recent Price: 63.24 Smart Investing & Trading Score: 83 | |
| Day Percent Change: 0.14% Day Change: 0.09 | |
| Week Change: 0.49% Year-to-date Change: 8.9% | |
| CMS Links: Profile News Message Board | |
| Charts:- Daily , Weekly | |
| Add CMS to Watchlist: View: Get Complete CMS Trend Analysis ➞ | |
| For tabular summary view of above stock list: Summary View ➞ 0 - 25 , 25 - 50 , 50 - 75 , 75 - 100 , 100 - 125 , 125 - 150 , 150 - 175 , 175 - 200 , 200 - 225 , 225 - 250 , 250 - 275 , 275 - 300 , 300 - 325 , 325 - 350 , 350 - 375 , 375 - 400 , 400 - 425 , 425 - 450 , 450 - 475 , 475 - 500 , 500 - 525 , 525 - 550 , 550 - 575 , 575 - 600 , 600 - 625 , 625 - 650 , 650 - 675 , 675 - 700 , 700 - 725 , 725 - 750 , 750 - 775 | ||
| Click To Change The Sort Order: By Market Cap or Company Size Performance: Year-to-date, Week and Day | |
| Select Chart Type: | ||
|
Best Stocks Today 12Stocks.com |
© 2024 12Stocks.com Terms & Conditions Privacy Contact Us
All Information Provided Only For Education And Not To Be Used For Investing or Trading. See Terms & Conditions


One More Thing ... Get Best Stocks Delivered Daily!
Never Ever Miss A Move With Our Top Ten Stocks Lists
Find Best Stocks In Any Market - Bull or Bear Market
Take A Peek At Our Top Ten Stocks Lists: Daily, Weekly, Year-to-Date & Top Trends
Find Best Stocks In Any Market - Bull or Bear Market
Take A Peek At Our Top Ten Stocks Lists: Daily, Weekly, Year-to-Date & Top Trends
Midcap Stocks With Best Up Trends [0-bearish to 100-bullish]: Robinhood Markets[100], SSR Mining[100], Littelfuse [100], Tractor Supply[100], DuPont de[100], Royal Gold[100], Alcoa [100], Range Resources[100], Arch Capital[100], Evercore [100], Prosperity Bancshares[100]
Best Midcap Stocks Year-to-Date:
Vistra Energy[144.24%], AppLovin [107.29%], Constellation Energy[81.97%], CAVA [77.74%], EMCOR [75.63%], ShockWave Medical[73.24%], Maravai LifeSciences[72.82%], Celsius [70.62%], Tenet [70%], Natera [69.96%], Pure Storage[65.87%] Best Midcap Stocks This Week:
AMC Entertainment[51.2%], Petco Health[50%], NovoCure [33.52%], GameStop [27.21%], Plug Power[26.95%], Robinhood Markets[23.78%], Doximity [19.94%], Ubiquiti [16.29%], Hawaiian Electric[15.12%], MP Materials[13.14%], Victorias Secret[13.12%] Best Midcap Stocks Daily:
Doximity [18.07%], Robinhood Markets[12.23%], Affirm [8.01%], SSR Mining[6.28%], Coinbase Global[4.23%], Littelfuse [4.13%], Rivian Automotive[3.65%], DoubleVerify [3.50%], Tractor Supply[3.42%], Iridium [3.42%], Ubiquiti [3.04%]