
 Login Sign Up


| |||||
 |  | ||||

| 12Stocks.com Market Intelligence |
Best MidCap Stocks
|
| In a hurry? Mid Cap Stocks Lists: Performance Trends Table, Stock Charts
Sort midcap stocks: Daily, Weekly, Year-to-Date, Market Cap & Trends. Filter midcap stocks list by sector: Show all, Tech, Finance, Energy, Staples, Retail, Industrial, Materials, Utilities and HealthCare Filter midcap stocks list by size:All MidCap Large Mid-Range Small |
| 12Stocks.com Mid Cap Stocks Performances & Trends Daily | |||||||||
|
|  The overall Smart Investing & Trading Score is 76 (0-bearish to 100-bullish) which puts Mid Cap index in short term neutral to bullish trend. The Smart Investing & Trading Score from previous trading session is 100 and a deterioration of trend continues.
| ||||||||
Here are the Smart Investing & Trading Scores of the most requested mid cap stocks at 12Stocks.com (click stock name for detailed review):
|


| 12Stocks.com: Top Performing Mid Cap Index Stocks | ||||||||||||||||||||||||||||||||||||||||||||||||
 The top performing Mid Cap Index stocks year to date are
Now, more recently, over last week, the top performing Mid Cap Index stocks on the move are


|
||||||||||||||||||||||||||||||||||||||||||||||||
| 12Stocks.com: Investing in Midcap Index with Stocks | |
|
The following table helps investors and traders sort through current performance and trends (as measured by Smart Investing & Trading Score) of various
stocks in the Midcap Index. Quick View: Move mouse or cursor over stock symbol (ticker) to view short-term technical chart and over stock name to view long term chart. Click on  to add stock symbol to your watchlist and to add stock symbol to your watchlist and  to view watchlist. Click on any ticker or stock name for detailed market intelligence report for that stock. to view watchlist. Click on any ticker or stock name for detailed market intelligence report for that stock. |
12Stocks.com Performance of Stocks in Midcap Index
| Ticker | Stock Name | Watchlist | Category | Recent Price | Smart Investing & Trading Score | Change % | Weekly Change% |
| SON | Sonoco Products |   | Consumer Staples | 60.28 | 83 | 0.43% | 2.22% |
| REG | Regency Centers | | Financials | 60.89 | 74 | 1.28% | 2.22% |
| RMD | ResMed | | Health Care | 218.57 | 71 | -0.64% | 2.22% |
| CPNG | Coupang | | Services & Goods | 23.00 | 69 | 0.57% | 2.22% |
| FDS | FactSet Research | | Technology | 448.88 | 59 | 0.75% | 2.21% |
| WELL | Welltower | | Financials | 101.29 | 90 | 0.34% | 2.21% |
| VICI | VICI Properties | | Financials | 30.38 | 88 | 0.33% | 2.20% |
| KEY | KeyCorp | | Financials | 15.40 | 95 | 0.46% | 2.12% |
| ARE | Alexandria Real | | Financials | 124.17 | 63 | 0.09% | 2.12% |
| VNO | Vornado Realty | | Financials | 24.73 | 10 | -0.28% | 2.11% |
| PRU | Prudential Financial | | Financials | 121.31 | 95 | 1.15% | 2.09% |
| PKG | Packaging | | Consumer Staples | 183.13 | 90 | 0.40% | 2.08% |
| BYD | Boyd Gaming | | Services & Goods | 55.01 | 50 | -0.11% | 2.06% |
| ASH | Ashland Global | | Materials | 100.06 | 100 | 1.46% | 2.06% |
| JEF | Jefferies Financial | | Financials | 47.32 | 83 | 0.08% | 2.05% |
| IPG | Interpublic | | Services & Goods | 31.78 | 88 | 0.47% | 2.02% |
| HOG | Harley-Davidson | | Consumer Staples | 35.39 | 27 | -0.06% | 2.02% |
| LNG | Cheniere Energy | | Energy | 160.16 | 93 | 1.41% | 1.97% |
| BJ | BJ s | | Services & Goods | 79.76 | 93 | -0.04% | 1.96% |
| AMH | American Homes | | Financials | 36.77 | 87 | 0.88% | 1.94% |
| PRI | Primerica | | Financials | 228.08 | 59 | 1.67% | 1.93% |
| INVH | Invitation Homes | | Financials | 35.45 | 88 | 0.68% | 1.93% |
| NI | NiSource | | Utilities | 29.23 | 88 | 0.27% | 1.92% |
| MASI | Masimo | | Health Care | 124.10 | 37 | 2.89% | 1.92% |
| HRL | Hormel Foods | | Consumer Staples | 36.31 | 95 | 0.61% | 1.91% |
| For chart view version of above stock list: Chart View ➞ 0 - 25 , 25 - 50 , 50 - 75 , 75 - 100 , 100 - 125 , 125 - 150 , 150 - 175 , 175 - 200 , 200 - 225 , 225 - 250 , 250 - 275 , 275 - 300 , 300 - 325 , 325 - 350 , 350 - 375 , 375 - 400 , 400 - 425 , 425 - 450 , 450 - 475 , 475 - 500 , 500 - 525 , 525 - 550 , 550 - 575 , 575 - 600 , 600 - 625 , 625 - 650 , 650 - 675 , 675 - 700 , 700 - 725 , 725 - 750 , 750 - 775 | ||
 | Click To Change The Sort Order: By Market Cap or Company Size Performance: Year-to-date, Week and Day |  |
|
Get the most comprehensive stock market coverage daily at 12Stocks.com ➞ Best Stocks Today ➞ Best Stocks Weekly ➞ Best Stocks Year-to-Date ➞ Best Stocks Trends ➞  Best Stocks Today 12Stocks.com Best Nasdaq Stocks ➞ Best S&P 500 Stocks ➞ Best Tech Stocks ➞ Best Biotech Stocks ➞ |
| Detailed Overview of Midcap Stocks |
| Midcap Technical Overview, Leaders & Laggards, Top Midcap ETF Funds & Detailed Midcap Stocks List, Charts, Trends & More |
| Midcap: Technical Analysis, Trends & YTD Performance | |
| MidCap segment as represented by
MDY, an exchange-traded fund [ETF], holds basket of about four hundred midcap stocks from across all major sectors of the US stock market. The midcap index (contains stocks like Green Mountain Coffee Roasters and Tractor Supply Company) is up by 8.73% and is currently underperforming the overall market by -1.84% year-to-date. Below is a quick view of technical charts and trends: | |
 MDY Weekly Chart |
|
| Long Term Trend: Very Good | |
| Medium Term Trend: Very Good | |
 MDY Daily Chart |
|
| Short Term Trend: Not Good | |
| Overall Trend Score: 76 | |
| YTD Performance: 8.73% | |
| **Trend Scores & Views Are Only For Educational Purposes And Not For Investing | |
| 12Stocks.com: Investing in Midcap Index using Exchange Traded Funds | |
|
The following table shows list of key exchange traded funds (ETF) that
help investors track Midcap index. The following list also includes leveraged ETF funds that track twice or thrice the daily returns of Midcap indices. Short or inverse ETF funds move in the opposite direction to the index they track and are useful during market pullbacks or during bear markets. Quick View: Move mouse or cursor over ETF symbol (ticker) to view short-term technical chart and over ETF name to view long term chart. Click on ticker or stock name for detailed view. Click on to add stock symbol to your watchlist and to view watchlist. |
12Stocks.com List of ETFs that track Midcap Index
| Ticker | ETF Name | Watchlist | Recent Price | Smart Investing & Trading Score | Change % | Week % | Year-to-date % |
| IJH | iShares Core S&P Mid-Cap | | 60.31 | 68 | -0.46 | 0.84 | 8.8% |
| MDY | SPDR S&P MidCap 400 ETF | | 551.69 | 76 | 0.11 | 0.84 | 8.73% |
| IWR | iShares Russell Mid-Cap | | 83.29 | 76 | -0.28 | 1.07 | 7.15% |
| IWP | iShares Russell Mid-Cap Growth | | 112.01 | 70 | -0.29 | 1.53 | 7.23% |
| IWS | iShares Russell Mid-Cap Value | | 124.51 | 76 | -0.34 | 0.92 | 7.07% |
| IJK | iShares S&P Mid-Cap 400 Growth | | 90.28 | 71 | -0.05 | 0.39 | 13.96% |
| IJJ | iShares S&P Mid-Cap 400 Value | | 117.71 | 76 | -0.16 | 1.26 | 3.22% |
| MVV | ProShares Ultra MidCap400 | | 66.42 | 76 | 0.02 | 1.65 | 14.74% |
| XMLV | PowerShares S&P MidCap Low Volatil ETF | | 56.93 | 76 | -0.02 | 0.42 | 7.05% |
| UMDD | ProShares UltraPro MidCap400 | | 26.83 | 76 | -0.58 | 1.98 | 20.21% |
| SMDD | ProShares UltraPro Short MidCap400 | | 10.48 | 25 | 0.73 | -1.92 | -22.18% |
| MYY | ProShares Short MidCap400 | | 20.00 | 25 | 0.60 | -0.61 | -6.78% |
| MZZ | ProShares UltraShort MidCap400 | | 10.81 | 27 | 0.49 | -1.25 | -13.98% |
| 12Stocks.com: Charts, Trends, Fundamental Data and Performances of MidCap Stocks | |
|
We now take in-depth look at all MidCap stocks including charts, multi-period performances and overall trends (as measured by Smart Investing & Trading Score). One can sort MidCap stocks (click link to choose) by Daily, Weekly and by Year-to-Date performances. Also, one can sort by size of the company or by market capitalization. |
| Select Your Default Chart Type: | |||||
| |||||
| Click on stock symbol or name for detailed view. Click on to add stock symbol to your watchlist and to view watchlist. Quick View: Move mouse or cursor over "Daily" to quickly view daily technical stock chart and over "Weekly" to view weekly technical stock chart. | |||||

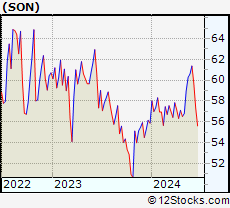 | SON Sonoco Products Company |
| Sector: Consumer Staples | |
| SubSector: Packaging & Containers | |
| MarketCap: 4564.33 Millions | |
| Recent Price: 60.28 Smart Investing & Trading Score: 83 | |
| Day Percent Change: 0.43% Day Change: 0.26 | |
| Week Change: 2.22% Year-to-date Change: 7.9% | |
| SON Links: Profile News Message Board | |
| Charts:- Daily , Weekly | |
| Add SON to Watchlist: View: Get Complete SON Trend Analysis ➞ | |
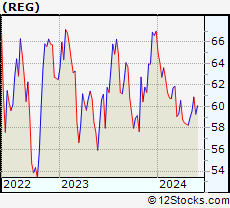 | REG Regency Centers Corporation |
| Sector: Financials | |
| SubSector: REIT - Retail | |
| MarketCap: 6345.84 Millions | |
| Recent Price: 60.89 Smart Investing & Trading Score: 74 | |
| Day Percent Change: 1.28% Day Change: 0.77 | |
| Week Change: 2.22% Year-to-date Change: -9.1% | |
| REG Links: Profile News Message Board | |
| Charts:- Daily , Weekly | |
| Add REG to Watchlist: View: Get Complete REG Trend Analysis ➞ | |
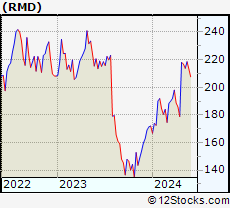 | RMD ResMed Inc. |
| Sector: Health Care | |
| SubSector: Medical Instruments & Supplies | |
| MarketCap: 18660.2 Millions | |
| Recent Price: 218.57 Smart Investing & Trading Score: 71 | |
| Day Percent Change: -0.64% Day Change: -1.40 | |
| Week Change: 2.22% Year-to-date Change: 27.1% | |
| RMD Links: Profile News Message Board | |
| Charts:- Daily , Weekly | |
| Add RMD to Watchlist: View: Get Complete RMD Trend Analysis ➞ | |
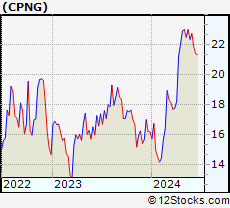 | CPNG Coupang, Inc. |
| Sector: Services & Goods | |
| SubSector: Internet Retail | |
| MarketCap: 30840 Millions | |
| Recent Price: 23.00 Smart Investing & Trading Score: 69 | |
| Day Percent Change: 0.57% Day Change: 0.13 | |
| Week Change: 2.22% Year-to-date Change: 42.0% | |
| CPNG Links: Profile News Message Board | |
| Charts:- Daily , Weekly | |
| Add CPNG to Watchlist: View: Get Complete CPNG Trend Analysis ➞ | |
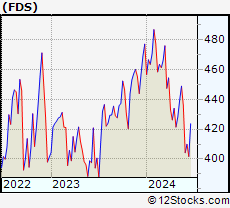 | FDS FactSet Research Systems Inc. |
| Sector: Technology | |
| SubSector: Information & Delivery Services | |
| MarketCap: 9024.37 Millions | |
| Recent Price: 448.88 Smart Investing & Trading Score: 59 | |
| Day Percent Change: 0.75% Day Change: 3.36 | |
| Week Change: 2.21% Year-to-date Change: -5.9% | |
| FDS Links: Profile News Message Board | |
| Charts:- Daily , Weekly | |
| Add FDS to Watchlist: View: Get Complete FDS Trend Analysis ➞ | |
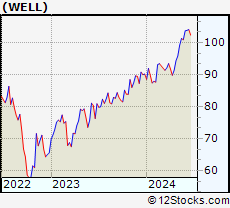 | WELL Welltower Inc. |
| Sector: Financials | |
| SubSector: REIT - Healthcare Facilities | |
| MarketCap: 21398.8 Millions | |
| Recent Price: 101.29 Smart Investing & Trading Score: 90 | |
| Day Percent Change: 0.34% Day Change: 0.34 | |
| Week Change: 2.21% Year-to-date Change: 12.3% | |
| WELL Links: Profile News Message Board | |
| Charts:- Daily , Weekly | |
| Add WELL to Watchlist: View: Get Complete WELL Trend Analysis ➞ | |
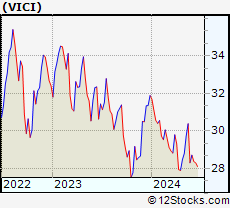 | VICI VICI Properties Inc. |
| Sector: Financials | |
| SubSector: REIT - Diversified | |
| MarketCap: 7327.03 Millions | |
| Recent Price: 30.38 Smart Investing & Trading Score: 88 | |
| Day Percent Change: 0.33% Day Change: 0.10 | |
| Week Change: 2.2% Year-to-date Change: -4.7% | |
| VICI Links: Profile News Message Board | |
| Charts:- Daily , Weekly | |
| Add VICI to Watchlist: View: Get Complete VICI Trend Analysis ➞ | |
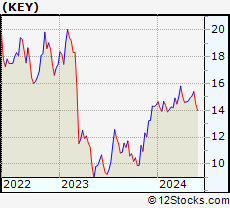 | KEY KeyCorp |
| Sector: Financials | |
| SubSector: Regional - Midwest Banks | |
| MarketCap: 10045 Millions | |
| Recent Price: 15.40 Smart Investing & Trading Score: 95 | |
| Day Percent Change: 0.46% Day Change: 0.07 | |
| Week Change: 2.12% Year-to-date Change: 6.9% | |
| KEY Links: Profile News Message Board | |
| Charts:- Daily , Weekly | |
| Add KEY to Watchlist: View: Get Complete KEY Trend Analysis ➞ | |
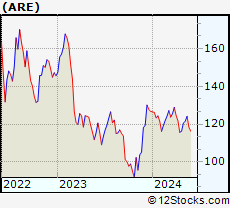 | ARE Alexandria Real Estate Equities, Inc. |
| Sector: Financials | |
| SubSector: REIT - Office | |
| MarketCap: 16793.6 Millions | |
| Recent Price: 124.17 Smart Investing & Trading Score: 63 | |
| Day Percent Change: 0.09% Day Change: 0.11 | |
| Week Change: 2.12% Year-to-date Change: -2.1% | |
| ARE Links: Profile News Message Board | |
| Charts:- Daily , Weekly | |
| Add ARE to Watchlist: View: Get Complete ARE Trend Analysis ➞ | |
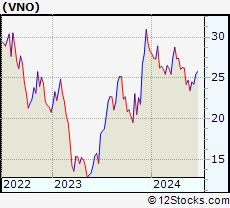 | VNO Vornado Realty Trust |
| Sector: Financials | |
| SubSector: REIT - Diversified | |
| MarketCap: 6300.63 Millions | |
| Recent Price: 24.73 Smart Investing & Trading Score: 10 | |
| Day Percent Change: -0.28% Day Change: -0.07 | |
| Week Change: 2.11% Year-to-date Change: -12.5% | |
| VNO Links: Profile News Message Board | |
| Charts:- Daily , Weekly | |
| Add VNO to Watchlist: View: Get Complete VNO Trend Analysis ➞ | |
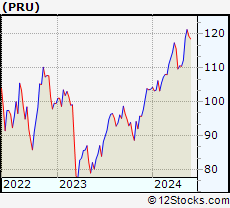 | PRU Prudential Financial, Inc. |
| Sector: Financials | |
| SubSector: Life Insurance | |
| MarketCap: 21001.6 Millions | |
| Recent Price: 121.31 Smart Investing & Trading Score: 95 | |
| Day Percent Change: 1.15% Day Change: 1.38 | |
| Week Change: 2.09% Year-to-date Change: 17.0% | |
| PRU Links: Profile News Message Board | |
| Charts:- Daily , Weekly | |
| Add PRU to Watchlist: View: Get Complete PRU Trend Analysis ➞ | |
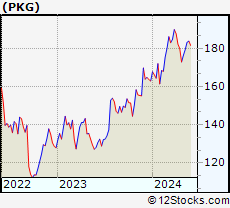 | PKG Packaging Corporation of America |
| Sector: Consumer Staples | |
| SubSector: Packaging & Containers | |
| MarketCap: 8963 Millions | |
| Recent Price: 183.13 Smart Investing & Trading Score: 90 | |
| Day Percent Change: 0.40% Day Change: 0.73 | |
| Week Change: 2.08% Year-to-date Change: 12.4% | |
| PKG Links: Profile News Message Board | |
| Charts:- Daily , Weekly | |
| Add PKG to Watchlist: View: Get Complete PKG Trend Analysis ➞ | |
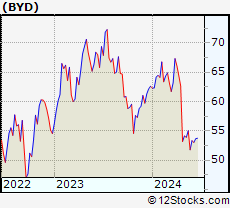 | BYD Boyd Gaming Corporation |
| Sector: Services & Goods | |
| SubSector: Resorts & Casinos | |
| MarketCap: 1652.54 Millions | |
| Recent Price: 55.01 Smart Investing & Trading Score: 50 | |
| Day Percent Change: -0.11% Day Change: -0.06 | |
| Week Change: 2.06% Year-to-date Change: -12.1% | |
| BYD Links: Profile News Message Board | |
| Charts:- Daily , Weekly | |
| Add BYD to Watchlist: View: Get Complete BYD Trend Analysis ➞ | |
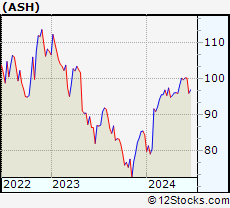 | ASH Ashland Global Holdings Inc. |
| Sector: Materials | |
| SubSector: Chemicals - Major Diversified | |
| MarketCap: 2764.16 Millions | |
| Recent Price: 100.06 Smart Investing & Trading Score: 100 | |
| Day Percent Change: 1.46% Day Change: 1.44 | |
| Week Change: 2.06% Year-to-date Change: 18.7% | |
| ASH Links: Profile News Message Board | |
| Charts:- Daily , Weekly | |
| Add ASH to Watchlist: View: Get Complete ASH Trend Analysis ➞ | |
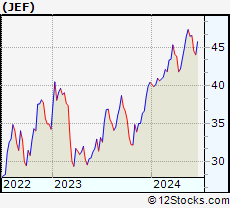 | JEF Jefferies Financial Group Inc. |
| Sector: Financials | |
| SubSector: Investment Brokerage - Regional | |
| MarketCap: 3987.15 Millions | |
| Recent Price: 47.32 Smart Investing & Trading Score: 83 | |
| Day Percent Change: 0.08% Day Change: 0.04 | |
| Week Change: 2.05% Year-to-date Change: 17.1% | |
| JEF Links: Profile News Message Board | |
| Charts:- Daily , Weekly | |
| Add JEF to Watchlist: View: Get Complete JEF Trend Analysis ➞ | |
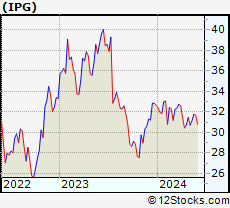 | IPG The Interpublic Group of Companies, Inc. |
| Sector: Services & Goods | |
| SubSector: Advertising Agencies | |
| MarketCap: 5730.55 Millions | |
| Recent Price: 31.78 Smart Investing & Trading Score: 88 | |
| Day Percent Change: 0.47% Day Change: 0.15 | |
| Week Change: 2.02% Year-to-date Change: -2.6% | |
| IPG Links: Profile News Message Board | |
| Charts:- Daily , Weekly | |
| Add IPG to Watchlist: View: Get Complete IPG Trend Analysis ➞ | |
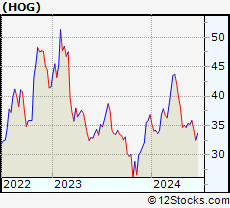 | HOG Harley-Davidson, Inc. |
| Sector: Consumer Staples | |
| SubSector: Recreational Vehicles | |
| MarketCap: 2808.49 Millions | |
| Recent Price: 35.39 Smart Investing & Trading Score: 27 | |
| Day Percent Change: -0.06% Day Change: -0.02 | |
| Week Change: 2.02% Year-to-date Change: -3.9% | |
| HOG Links: Profile News Message Board | |
| Charts:- Daily , Weekly | |
| Add HOG to Watchlist: View: Get Complete HOG Trend Analysis ➞ | |
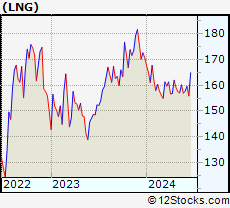 | LNG Cheniere Energy, Inc. |
| Sector: Energy | |
| SubSector: Oil & Gas Pipelines | |
| MarketCap: 9905.15 Millions | |
| Recent Price: 160.16 Smart Investing & Trading Score: 93 | |
| Day Percent Change: 1.41% Day Change: 2.22 | |
| Week Change: 1.97% Year-to-date Change: -6.2% | |
| LNG Links: Profile News Message Board | |
| Charts:- Daily , Weekly | |
| Add LNG to Watchlist: View: Get Complete LNG Trend Analysis ➞ | |
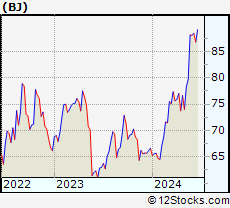 | BJ BJ s Wholesale Club Holdings, Inc. |
| Sector: Services & Goods | |
| SubSector: Discount, Variety Stores | |
| MarketCap: 3346.02 Millions | |
| Recent Price: 79.76 Smart Investing & Trading Score: 93 | |
| Day Percent Change: -0.04% Day Change: -0.03 | |
| Week Change: 1.96% Year-to-date Change: 19.7% | |
| BJ Links: Profile News Message Board | |
| Charts:- Daily , Weekly | |
| Add BJ to Watchlist: View: Get Complete BJ Trend Analysis ➞ | |
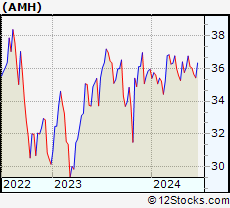 | AMH American Homes 4 Rent |
| Sector: Financials | |
| SubSector: REIT - Residential | |
| MarketCap: 6135.31 Millions | |
| Recent Price: 36.77 Smart Investing & Trading Score: 87 | |
| Day Percent Change: 0.88% Day Change: 0.32 | |
| Week Change: 1.94% Year-to-date Change: 2.3% | |
| AMH Links: Profile News Message Board | |
| Charts:- Daily , Weekly | |
| Add AMH to Watchlist: View: Get Complete AMH Trend Analysis ➞ | |
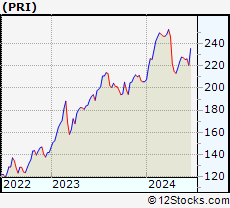 | PRI Primerica, Inc. |
| Sector: Financials | |
| SubSector: Life Insurance | |
| MarketCap: 2782.06 Millions | |
| Recent Price: 228.08 Smart Investing & Trading Score: 59 | |
| Day Percent Change: 1.67% Day Change: 3.75 | |
| Week Change: 1.93% Year-to-date Change: 10.9% | |
| PRI Links: Profile News Message Board | |
| Charts:- Daily , Weekly | |
| Add PRI to Watchlist: View: Get Complete PRI Trend Analysis ➞ | |
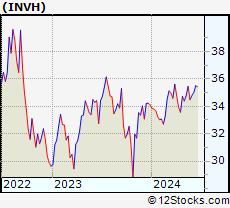 | INVH Invitation Homes Inc. |
| Sector: Financials | |
| SubSector: Real Estate Development | |
| MarketCap: 9782.89 Millions | |
| Recent Price: 35.45 Smart Investing & Trading Score: 88 | |
| Day Percent Change: 0.68% Day Change: 0.24 | |
| Week Change: 1.93% Year-to-date Change: 3.9% | |
| INVH Links: Profile News Message Board | |
| Charts:- Daily , Weekly | |
| Add INVH to Watchlist: View: Get Complete INVH Trend Analysis ➞ | |
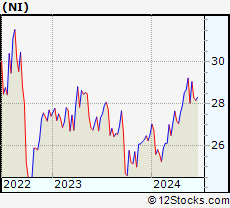 | NI NiSource Inc. |
| Sector: Utilities | |
| SubSector: Diversified Utilities | |
| MarketCap: 9056.8 Millions | |
| Recent Price: 29.23 Smart Investing & Trading Score: 88 | |
| Day Percent Change: 0.27% Day Change: 0.08 | |
| Week Change: 1.92% Year-to-date Change: 10.1% | |
| NI Links: Profile News Message Board | |
| Charts:- Daily , Weekly | |
| Add NI to Watchlist: View: Get Complete NI Trend Analysis ➞ | |
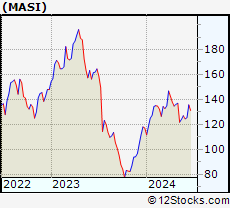 | MASI Masimo Corporation |
| Sector: Health Care | |
| SubSector: Medical Instruments & Supplies | |
| MarketCap: 8493.2 Millions | |
| Recent Price: 124.10 Smart Investing & Trading Score: 37 | |
| Day Percent Change: 2.89% Day Change: 3.49 | |
| Week Change: 1.92% Year-to-date Change: 5.9% | |
| MASI Links: Profile News Message Board | |
| Charts:- Daily , Weekly | |
| Add MASI to Watchlist: View: Get Complete MASI Trend Analysis ➞ | |
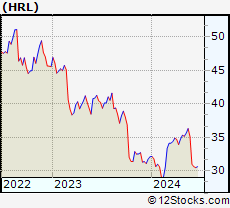 | HRL Hormel Foods Corporation |
| Sector: Consumer Staples | |
| SubSector: Meat Products | |
| MarketCap: 25590.2 Millions | |
| Recent Price: 36.31 Smart Investing & Trading Score: 95 | |
| Day Percent Change: 0.61% Day Change: 0.22 | |
| Week Change: 1.91% Year-to-date Change: 13.1% | |
| HRL Links: Profile News Message Board | |
| Charts:- Daily , Weekly | |
| Add HRL to Watchlist: View: Get Complete HRL Trend Analysis ➞ | |
| For tabular summary view of above stock list: Summary View ➞ 0 - 25 , 25 - 50 , 50 - 75 , 75 - 100 , 100 - 125 , 125 - 150 , 150 - 175 , 175 - 200 , 200 - 225 , 225 - 250 , 250 - 275 , 275 - 300 , 300 - 325 , 325 - 350 , 350 - 375 , 375 - 400 , 400 - 425 , 425 - 450 , 450 - 475 , 475 - 500 , 500 - 525 , 525 - 550 , 550 - 575 , 575 - 600 , 600 - 625 , 625 - 650 , 650 - 675 , 675 - 700 , 700 - 725 , 725 - 750 , 750 - 775 | ||
| Click To Change The Sort Order: By Market Cap or Company Size Performance: Year-to-date, Week and Day | |
| Select Chart Type: | ||
|
Best Stocks Today 12Stocks.com |
© 2024 12Stocks.com Terms & Conditions Privacy Contact Us
All Information Provided Only For Education And Not To Be Used For Investing or Trading. See Terms & Conditions


One More Thing ... Get Best Stocks Delivered Daily!
Never Ever Miss A Move With Our Top Ten Stocks Lists
Find Best Stocks In Any Market - Bull or Bear Market
Take A Peek At Our Top Ten Stocks Lists: Daily, Weekly, Year-to-Date & Top Trends
Find Best Stocks In Any Market - Bull or Bear Market
Take A Peek At Our Top Ten Stocks Lists: Daily, Weekly, Year-to-Date & Top Trends
Midcap Stocks With Best Up Trends [0-bearish to 100-bullish]: Robinhood Markets[100], SSR Mining[100], Littelfuse [100], Tractor Supply[100], DuPont de[100], Royal Gold[100], Alcoa [100], Range Resources[100], Arch Capital[100], Evercore [100], Prosperity Bancshares[100]
Best Midcap Stocks Year-to-Date:
Vistra Energy[144.24%], AppLovin [107.29%], Constellation Energy[81.97%], CAVA [77.74%], EMCOR [75.63%], ShockWave Medical[73.24%], Maravai LifeSciences[72.82%], Celsius [70.62%], Tenet [70%], Natera [69.96%], Pure Storage[65.87%] Best Midcap Stocks This Week:
AMC Entertainment[51.2%], Petco Health[50%], NovoCure [33.52%], GameStop [27.21%], Plug Power[26.95%], Robinhood Markets[23.78%], Doximity [19.94%], Ubiquiti [16.29%], Hawaiian Electric[15.12%], MP Materials[13.14%], Victorias Secret[13.12%] Best Midcap Stocks Daily:
Doximity [18.07%], Robinhood Markets[12.23%], Affirm [8.01%], SSR Mining[6.28%], Coinbase Global[4.23%], Littelfuse [4.13%], Rivian Automotive[3.65%], DoubleVerify [3.50%], Tractor Supply[3.42%], Iridium [3.42%], Ubiquiti [3.04%]