
 Login Sign Up


| |||||
 |  | ||||

| 12Stocks.com Market Intelligence |
Best MidCap Stocks
|
| In a hurry? Mid Cap Stocks Lists: Performance Trends Table, Stock Charts
Sort midcap stocks: Daily, Weekly, Year-to-Date, Market Cap & Trends. Filter midcap stocks list by sector: Show all, Tech, Finance, Energy, Staples, Retail, Industrial, Materials, Utilities and HealthCare Filter midcap stocks list by size:All MidCap Large Mid-Range Small |
| 12Stocks.com Mid Cap Stocks Performances & Trends Daily | |||||||||
|
|  The overall Smart Investing & Trading Score is 93 (0-bearish to 100-bullish) which puts Mid Cap index in short term bullish trend. The Smart Investing & Trading Score from previous trading session is 88 and hence an improvement of trend.
| ||||||||
Here are the Smart Investing & Trading Scores of the most requested mid cap stocks at 12Stocks.com (click stock name for detailed review):
|


| 12Stocks.com: Top Performing Mid Cap Index Stocks | ||||||||||||||||||||||||||||||||||||||||||||||||
 The top performing Mid Cap Index stocks year to date are
Now, more recently, over last week, the top performing Mid Cap Index stocks on the move are


|
||||||||||||||||||||||||||||||||||||||||||||||||
| 12Stocks.com: Investing in Midcap Index with Stocks | |
|
The following table helps investors and traders sort through current performance and trends (as measured by Smart Investing & Trading Score) of various
stocks in the Midcap Index. Quick View: Move mouse or cursor over stock symbol (ticker) to view short-term technical chart and over stock name to view long term chart. Click on  to add stock symbol to your watchlist and to add stock symbol to your watchlist and  to view watchlist. Click on any ticker or stock name for detailed market intelligence report for that stock. to view watchlist. Click on any ticker or stock name for detailed market intelligence report for that stock. |
12Stocks.com Performance of Stocks in Midcap Index
| Ticker | Stock Name | Watchlist | Category | Recent Price | Smart Investing & Trading Score | Change % | Weekly Change% |
| ELAN | Elanco Animal |   | Health Care | 17.00 | 100 | 0.62% | 25.61% |
| PTON | Peloton Interactive | | Consumer Staples | 4.16 | 69 | 5.46% | 21.31% |
| GMED | Globus Medical | | Health Care | 61.92 | 100 | 0.32% | 19.20% |
| CRUS | Cirrus Logic | | Technology | 102.94 | 100 | 0.69% | 16.35% |
| LPX | Louisiana-Pacific | | Services & Goods | 86.41 | 100 | -1.96% | 16.30% |
| RNG | RingCentral | | Technology | 35.20 | 95 | 2.39% | 15.45% |
| GL | Globe Life | | Financials | 88.61 | 59 | -0.98% | 14.26% |
| WOOF | Petco Health | | Services & Goods | 1.76 | 69 | 4.44% | 13.87% |
| VST | Vistra Energy | | Utilities | 91.59 | 100 | 2.68% | 12.40% |
| YETI | YETI | | Consumer Staples | 38.86 | 64 | 11.63% | 12.28% |
| SPB | Spectrum | | Consumer Staples | 93.87 | 100 | 11.06% | 12.19% |
| PLNT | Planet Fitness | | Services & Goods | 66.62 | 100 | 7.71% | 11.91% |
| CROX | Crocs | | Consumer Staples | 138.81 | 100 | 2.50% | 11.69% |
| W | Wayfair | | Services & Goods | 70.76 | 100 | 3.74% | 11.28% |
| IFF | Flavors | | Materials | 96.12 | 100 | -1.14% | 10.94% |
| TPL | Texas Pacific | | Financials | 621.77 | 64 | 10.34% | 10.71% |
| CELH | Celsius | | Consumer Staples | 83.66 | 100 | 14.62% | 10.12% |
| NVCR | NovoCure | | Health Care | 16.18 | 95 | 0.94% | 9.47% |
| PENN | Penn National | | Services & Goods | 16.56 | 60 | 5.72% | 9.45% |
| FRPT | Freshpet | | Consumer Staples | 119.78 | 73 | 0.48% | 9.31% |
| IP | Paper | | Consumer Staples | 39.45 | 100 | 0.42% | 8.72% |
| HSIC | Henry Schein | | Services & Goods | 73.41 | 74 | 0.89% | 8.30% |
| ARES | Ares Management | | Financials | 142.48 | 100 | 2.75% | 8.01% |
| LOPE | Grand Canyon | | Services & Goods | 146.88 | 100 | -0.14% | 7.91% |
| NTNX | Nutanix | | Technology | 67.16 | 95 | 1.43% | 7.90% |
| For chart view version of above stock list: Chart View ➞ 0 - 25 , 25 - 50 , 50 - 75 , 75 - 100 , 100 - 125 , 125 - 150 , 150 - 175 , 175 - 200 , 200 - 225 , 225 - 250 , 250 - 275 , 275 - 300 , 300 - 325 , 325 - 350 , 350 - 375 , 375 - 400 , 400 - 425 , 425 - 450 , 450 - 475 , 475 - 500 , 500 - 525 , 525 - 550 , 550 - 575 , 575 - 600 , 600 - 625 , 625 - 650 , 650 - 675 , 675 - 700 , 700 - 725 | ||
 | Click To Change The Sort Order: By Market Cap or Company Size Performance: Year-to-date, Week and Day |  |
|
Get the most comprehensive stock market coverage daily at 12Stocks.com ➞ Best Stocks Today ➞ Best Stocks Weekly ➞ Best Stocks Year-to-Date ➞ Best Stocks Trends ➞  Best Stocks Today 12Stocks.com Best Nasdaq Stocks ➞ Best S&P 500 Stocks ➞ Best Tech Stocks ➞ Best Biotech Stocks ➞ |
| Detailed Overview of Midcap Stocks |
| Midcap Technical Overview, Leaders & Laggards, Top Midcap ETF Funds & Detailed Midcap Stocks List, Charts, Trends & More |
| Midcap: Technical Analysis, Trends & YTD Performance | |
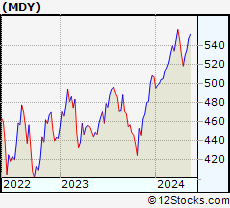
| MidCap segment as represented by
MDY, an exchange-traded fund [ETF], holds basket of about four hundred midcap stocks from across all major sectors of the US stock market. The midcap index (contains stocks like Green Mountain Coffee Roasters and Tractor Supply Company) is up by 7.62% and is currently underperforming the overall market by -0.92% year-to-date. Below is a quick view of technical charts and trends: | |
 MDY Weekly Chart |
|
| Long Term Trend: Very Good | |
| Medium Term Trend: Very Good | |
 MDY Daily Chart |
|
| Short Term Trend: Very Good | |
| Overall Trend Score: 93 | |
| YTD Performance: 7.62% | |
| **Trend Scores & Views Are Only For Educational Purposes And Not For Investing | |
| 12Stocks.com: Investing in Midcap Index using Exchange Traded Funds | |
|
The following table shows list of key exchange traded funds (ETF) that
help investors track Midcap index. The following list also includes leveraged ETF funds that track twice or thrice the daily returns of Midcap indices. Short or inverse ETF funds move in the opposite direction to the index they track and are useful during market pullbacks or during bear markets. Quick View: Move mouse or cursor over ETF symbol (ticker) to view short-term technical chart and over ETF name to view long term chart. Click on ticker or stock name for detailed view. Click on to add stock symbol to your watchlist and to view watchlist. |
12Stocks.com List of ETFs that track Midcap Index
| Ticker | ETF Name | Watchlist | Recent Price | Smart Investing & Trading Score | Change % | Week % | Year-to-date % |
| IJH | iShares Core S&P Mid-Cap | | 59.41 | 88 | 0.23 | 1.51 | 7.19% |
| IWR | iShares Russell Mid-Cap | | 81.73 | 83 | 0.21 | 1.18 | 5.15% |
| MDY | SPDR S&P MidCap 400 ETF | | 546.02 | 93 | 0.69 | 1.98 | 7.62% |
| IJK | iShares S&P Mid-Cap 400 Growth | | 89.75 | 88 | 0.67 | 2.12 | 13.3% |
| IJJ | iShares S&P Mid-Cap 400 Value | | 115.92 | 95 | 0.70 | 1.89 | 1.64% |
| IWP | iShares Russell Mid-Cap Growth | | 109.18 | 32 | -0.04 | 0.4 | 4.52% |
| IWS | iShares Russell Mid-Cap Value | | 122.39 | 93 | 0.14 | 1.4 | 5.25% |
| XMLV | PowerShares S&P MidCap Low Volatil ETF | | 56.37 | 93 | 0.64 | 1.57 | 6% |
| UMDD | ProShares UltraPro MidCap400 | | 26.12 | 100 | 1.87 | 5.84 | 17.03% |
| MVV | ProShares Ultra MidCap400 | | 65.00 | 100 | 1.09 | 3.64 | 12.28% |
| SMDD | ProShares UltraPro Short MidCap400 | | 10.90 | 10 | -0.55 | -4.79 | -19.04% |
| MZZ | ProShares UltraShort MidCap400 | | 11.02 | 20 | -1.52 | -3.84 | -12.34% |
| MYY | ProShares Short MidCap400 | | 20.31 | 18 | 0.04 | -1.29 | -5.34% |
| 12Stocks.com: Charts, Trends, Fundamental Data and Performances of MidCap Stocks | |
|
We now take in-depth look at all MidCap stocks including charts, multi-period performances and overall trends (as measured by Smart Investing & Trading Score). One can sort MidCap stocks (click link to choose) by Daily, Weekly and by Year-to-Date performances. Also, one can sort by size of the company or by market capitalization. |
| Select Your Default Chart Type: | |||||
| |||||
| Click on stock symbol or name for detailed view. Click on to add stock symbol to your watchlist and to view watchlist. Quick View: Move mouse or cursor over "Daily" to quickly view daily technical stock chart and over "Weekly" to view weekly technical stock chart. | |||||

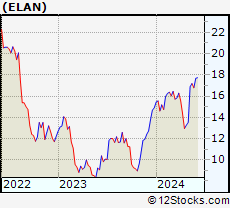 | ELAN Elanco Animal Health Incorporated |
| Sector: Health Care | |
| SubSector: Drugs - Generic | |
| MarketCap: 7752.15 Millions | |
| Recent Price: 17.00 Smart Investing & Trading Score: 100 | |
| Day Percent Change: 0.62% Day Change: 0.11 | |
| Week Change: 25.61% Year-to-date Change: 14.1% | |
| ELAN Links: Profile News Message Board | |
| Charts:- Daily , Weekly | |
| Add ELAN to Watchlist: View: Get Complete ELAN Trend Analysis ➞ | |
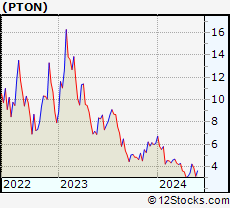 | PTON Peloton Interactive, Inc. |
| Sector: Consumer Staples | |
| SubSector: Sporting Goods | |
| MarketCap: 7282.44 Millions | |
| Recent Price: 4.16 Smart Investing & Trading Score: 69 | |
| Day Percent Change: 5.46% Day Change: 0.22 | |
| Week Change: 21.31% Year-to-date Change: -31.8% | |
| PTON Links: Profile News Message Board | |
| Charts:- Daily , Weekly | |
| Add PTON to Watchlist: View: Get Complete PTON Trend Analysis ➞ | |
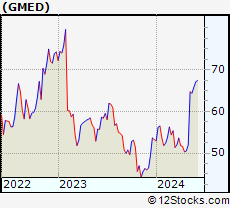 | GMED Globus Medical, Inc. |
| Sector: Health Care | |
| SubSector: Medical Appliances & Equipment | |
| MarketCap: 3965.5 Millions | |
| Recent Price: 61.92 Smart Investing & Trading Score: 100 | |
| Day Percent Change: 0.32% Day Change: 0.20 | |
| Week Change: 19.2% Year-to-date Change: 16.2% | |
| GMED Links: Profile News Message Board | |
| Charts:- Daily , Weekly | |
| Add GMED to Watchlist: View: Get Complete GMED Trend Analysis ➞ | |
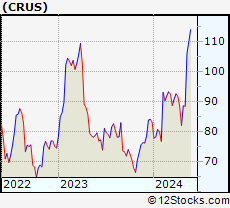 | CRUS Cirrus Logic, Inc. |
| Sector: Technology | |
| SubSector: Semiconductor - Specialized | |
| MarketCap: 3852.6 Millions | |
| Recent Price: 102.94 Smart Investing & Trading Score: 100 | |
| Day Percent Change: 0.69% Day Change: 0.70 | |
| Week Change: 16.35% Year-to-date Change: 23.8% | |
| CRUS Links: Profile News Message Board | |
| Charts:- Daily , Weekly | |
| Add CRUS to Watchlist: View: Get Complete CRUS Trend Analysis ➞ | |
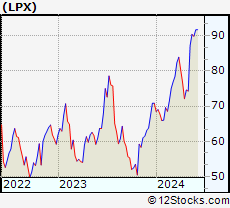 | LPX Louisiana-Pacific Corporation |
| Sector: Services & Goods | |
| SubSector: Building Materials Wholesale | |
| MarketCap: 1943.43 Millions | |
| Recent Price: 86.41 Smart Investing & Trading Score: 100 | |
| Day Percent Change: -1.96% Day Change: -1.73 | |
| Week Change: 16.3% Year-to-date Change: 22.0% | |
| LPX Links: Profile News Message Board | |
| Charts:- Daily , Weekly | |
| Add LPX to Watchlist: View: Get Complete LPX Trend Analysis ➞ | |
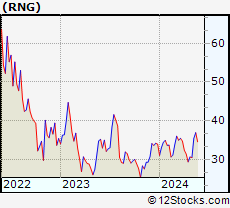 | RNG RingCentral, Inc. |
| Sector: Technology | |
| SubSector: Application Software | |
| MarketCap: 17755.3 Millions | |
| Recent Price: 35.20 Smart Investing & Trading Score: 95 | |
| Day Percent Change: 2.39% Day Change: 0.82 | |
| Week Change: 15.45% Year-to-date Change: 3.7% | |
| RNG Links: Profile News Message Board | |
| Charts:- Daily , Weekly | |
| Add RNG to Watchlist: View: Get Complete RNG Trend Analysis ➞ | |
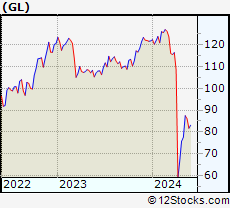 | GL Globe Life Inc. |
| Sector: Financials | |
| SubSector: Life Insurance | |
| MarketCap: 7596.46 Millions | |
| Recent Price: 88.61 Smart Investing & Trading Score: 59 | |
| Day Percent Change: -0.98% Day Change: -0.88 | |
| Week Change: 14.26% Year-to-date Change: -27.2% | |
| GL Links: Profile News Message Board | |
| Charts:- Daily , Weekly | |
| Add GL to Watchlist: View: Get Complete GL Trend Analysis ➞ | |
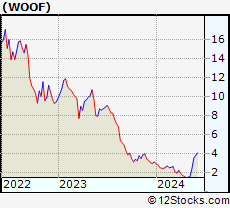 | WOOF Petco Health and Wellness Company, Inc. |
| Sector: Services & Goods | |
| SubSector: Specialty Retail | |
| MarketCap: 2030 Millions | |
| Recent Price: 1.76 Smart Investing & Trading Score: 69 | |
| Day Percent Change: 4.44% Day Change: 0.07 | |
| Week Change: 13.87% Year-to-date Change: -44.2% | |
| WOOF Links: Profile News Message Board | |
| Charts:- Daily , Weekly | |
| Add WOOF to Watchlist: View: Get Complete WOOF Trend Analysis ➞ | |
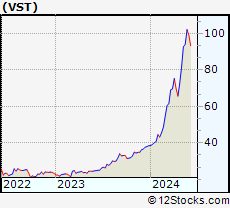 | VST Vistra Energy Corp. |
| Sector: Utilities | |
| SubSector: Electric Utilities | |
| MarketCap: 8396.44 Millions | |
| Recent Price: 91.59 Smart Investing & Trading Score: 100 | |
| Day Percent Change: 2.68% Day Change: 2.39 | |
| Week Change: 12.4% Year-to-date Change: 137.8% | |
| VST Links: Profile News Message Board | |
| Charts:- Daily , Weekly | |
| Add VST to Watchlist: View: Get Complete VST Trend Analysis ➞ | |
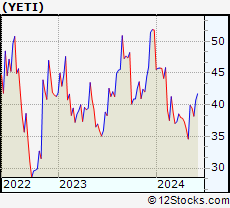 | YETI YETI Holdings, Inc. |
| Sector: Consumer Staples | |
| SubSector: Packaging & Containers | |
| MarketCap: 1495.53 Millions | |
| Recent Price: 38.86 Smart Investing & Trading Score: 64 | |
| Day Percent Change: 11.63% Day Change: 4.05 | |
| Week Change: 12.28% Year-to-date Change: -25.0% | |
| YETI Links: Profile News Message Board | |
| Charts:- Daily , Weekly | |
| Add YETI to Watchlist: View: Get Complete YETI Trend Analysis ➞ | |
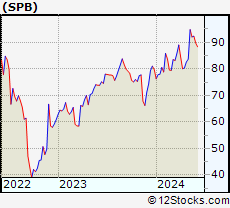 | SPB Spectrum Brands Holdings, Inc. |
| Sector: Consumer Staples | |
| SubSector: Personal Products | |
| MarketCap: 1460.85 Millions | |
| Recent Price: 93.87 Smart Investing & Trading Score: 100 | |
| Day Percent Change: 11.06% Day Change: 9.35 | |
| Week Change: 12.19% Year-to-date Change: 17.7% | |
| SPB Links: Profile News Message Board | |
| Charts:- Daily , Weekly | |
| Add SPB to Watchlist: View: Get Complete SPB Trend Analysis ➞ | |
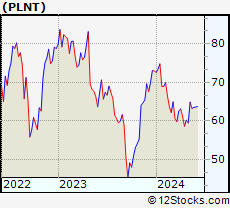 | PLNT Planet Fitness, Inc. |
| Sector: Services & Goods | |
| SubSector: Sporting Activities | |
| MarketCap: 3485.94 Millions | |
| Recent Price: 66.62 Smart Investing & Trading Score: 100 | |
| Day Percent Change: 7.71% Day Change: 4.77 | |
| Week Change: 11.91% Year-to-date Change: -8.7% | |
| PLNT Links: Profile News Message Board | |
| Charts:- Daily , Weekly | |
| Add PLNT to Watchlist: View: Get Complete PLNT Trend Analysis ➞ | |
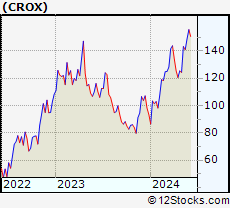 | CROX Crocs, Inc. |
| Sector: Consumer Staples | |
| SubSector: Textile - Apparel Footwear & Accessories | |
| MarketCap: 823.47 Millions | |
| Recent Price: 138.81 Smart Investing & Trading Score: 100 | |
| Day Percent Change: 2.50% Day Change: 3.39 | |
| Week Change: 11.69% Year-to-date Change: 48.6% | |
| CROX Links: Profile News Message Board | |
| Charts:- Daily , Weekly | |
| Add CROX to Watchlist: View: Get Complete CROX Trend Analysis ➞ | |
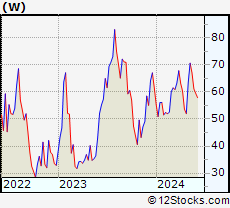 | W Wayfair Inc. |
| Sector: Services & Goods | |
| SubSector: Catalog & Mail Order Houses | |
| MarketCap: 3497.02 Millions | |
| Recent Price: 70.76 Smart Investing & Trading Score: 100 | |
| Day Percent Change: 3.74% Day Change: 2.55 | |
| Week Change: 11.28% Year-to-date Change: 14.7% | |
| W Links: Profile News Message Board | |
| Charts:- Daily , Weekly | |
| Add W to Watchlist: View: Get Complete W Trend Analysis ➞ | |
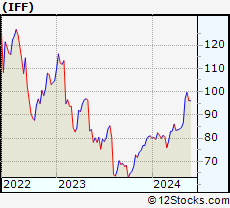 | IFF International Flavors & Fragrances Inc. |
| Sector: Materials | |
| SubSector: Specialty Chemicals | |
| MarketCap: 12178.7 Millions | |
| Recent Price: 96.12 Smart Investing & Trading Score: 100 | |
| Day Percent Change: -1.14% Day Change: -1.11 | |
| Week Change: 10.94% Year-to-date Change: 18.7% | |
| IFF Links: Profile News Message Board | |
| Charts:- Daily , Weekly | |
| Add IFF to Watchlist: View: Get Complete IFF Trend Analysis ➞ | |
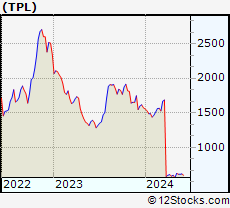 | TPL Texas Pacific Land Trust |
| Sector: Financials | |
| SubSector: Real Estate Development | |
| MarketCap: 3052.29 Millions | |
| Recent Price: 621.77 Smart Investing & Trading Score: 64 | |
| Day Percent Change: 10.34% Day Change: 58.27 | |
| Week Change: 10.71% Year-to-date Change: -60.5% | |
| TPL Links: Profile News Message Board | |
| Charts:- Daily , Weekly | |
| Add TPL to Watchlist: View: Get Complete TPL Trend Analysis ➞ | |
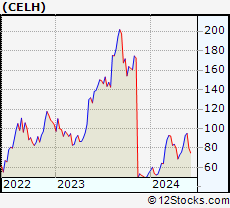 | CELH Celsius Holdings, Inc. |
| Sector: Consumer Staples | |
| SubSector: Beverages - Soft Drinks | |
| MarketCap: 280.32 Millions | |
| Recent Price: 83.66 Smart Investing & Trading Score: 100 | |
| Day Percent Change: 14.62% Day Change: 10.67 | |
| Week Change: 10.12% Year-to-date Change: 53.4% | |
| CELH Links: Profile News Message Board | |
| Charts:- Daily , Weekly | |
| Add CELH to Watchlist: View: Get Complete CELH Trend Analysis ➞ | |
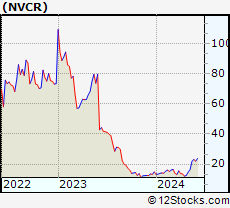 | NVCR NovoCure Limited |
| Sector: Health Care | |
| SubSector: Medical Appliances & Equipment | |
| MarketCap: 5939.5 Millions | |
| Recent Price: 16.18 Smart Investing & Trading Score: 95 | |
| Day Percent Change: 0.94% Day Change: 0.15 | |
| Week Change: 9.47% Year-to-date Change: 8.4% | |
| NVCR Links: Profile News Message Board | |
| Charts:- Daily , Weekly | |
| Add NVCR to Watchlist: View: Get Complete NVCR Trend Analysis ➞ | |
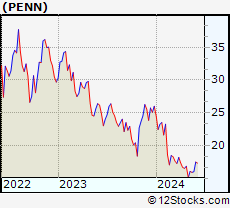 | PENN Penn National Gaming, Inc. |
| Sector: Services & Goods | |
| SubSector: Resorts & Casinos | |
| MarketCap: 1183.84 Millions | |
| Recent Price: 16.56 Smart Investing & Trading Score: 60 | |
| Day Percent Change: 5.72% Day Change: 0.89 | |
| Week Change: 9.45% Year-to-date Change: -36.4% | |
| PENN Links: Profile News Message Board | |
| Charts:- Daily , Weekly | |
| Add PENN to Watchlist: View: Get Complete PENN Trend Analysis ➞ | |
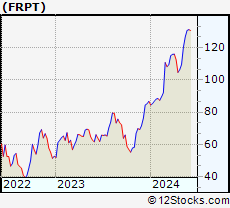 | FRPT Freshpet, Inc. |
| Sector: Consumer Staples | |
| SubSector: Food - Major Diversified | |
| MarketCap: 2449.23 Millions | |
| Recent Price: 119.78 Smart Investing & Trading Score: 73 | |
| Day Percent Change: 0.48% Day Change: 0.57 | |
| Week Change: 9.31% Year-to-date Change: 38.1% | |
| FRPT Links: Profile News Message Board | |
| Charts:- Daily , Weekly | |
| Add FRPT to Watchlist: View: Get Complete FRPT Trend Analysis ➞ | |
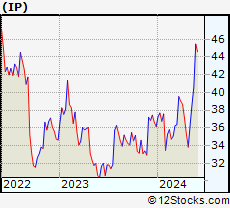 | IP International Paper Company |
| Sector: Consumer Staples | |
| SubSector: Packaging & Containers | |
| MarketCap: 13031.3 Millions | |
| Recent Price: 39.45 Smart Investing & Trading Score: 100 | |
| Day Percent Change: 0.42% Day Change: 0.16 | |
| Week Change: 8.72% Year-to-date Change: 9.1% | |
| IP Links: Profile News Message Board | |
| Charts:- Daily , Weekly | |
| Add IP to Watchlist: View: Get Complete IP Trend Analysis ➞ | |
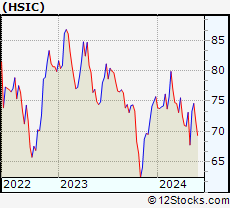 | HSIC Henry Schein, Inc. |
| Sector: Services & Goods | |
| SubSector: Medical Equipment Wholesale | |
| MarketCap: 6760.9 Millions | |
| Recent Price: 73.41 Smart Investing & Trading Score: 74 | |
| Day Percent Change: 0.89% Day Change: 0.64 | |
| Week Change: 8.3% Year-to-date Change: -3.0% | |
| HSIC Links: Profile News Message Board | |
| Charts:- Daily , Weekly | |
| Add HSIC to Watchlist: View: Get Complete HSIC Trend Analysis ➞ | |
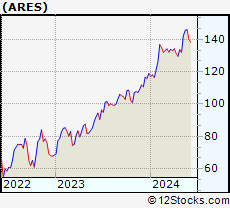 | ARES Ares Management Corporation |
| Sector: Financials | |
| SubSector: Asset Management | |
| MarketCap: 5826.23 Millions | |
| Recent Price: 142.48 Smart Investing & Trading Score: 100 | |
| Day Percent Change: 2.75% Day Change: 3.81 | |
| Week Change: 8.01% Year-to-date Change: 19.8% | |
| ARES Links: Profile News Message Board | |
| Charts:- Daily , Weekly | |
| Add ARES to Watchlist: View: Get Complete ARES Trend Analysis ➞ | |
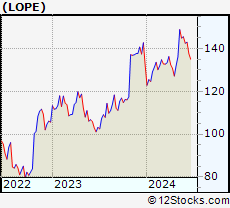 | LOPE Grand Canyon Education, Inc. |
| Sector: Services & Goods | |
| SubSector: Education & Training Services | |
| MarketCap: 3073.56 Millions | |
| Recent Price: 146.88 Smart Investing & Trading Score: 100 | |
| Day Percent Change: -0.14% Day Change: -0.20 | |
| Week Change: 7.91% Year-to-date Change: 11.2% | |
| LOPE Links: Profile News Message Board | |
| Charts:- Daily , Weekly | |
| Add LOPE to Watchlist: View: Get Complete LOPE Trend Analysis ➞ | |
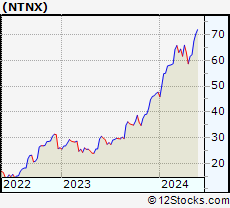 | NTNX Nutanix, Inc. |
| Sector: Technology | |
| SubSector: Technical & System Software | |
| MarketCap: 3376.6 Millions | |
| Recent Price: 67.16 Smart Investing & Trading Score: 95 | |
| Day Percent Change: 1.43% Day Change: 0.95 | |
| Week Change: 7.9% Year-to-date Change: 40.8% | |
| NTNX Links: Profile News Message Board | |
| Charts:- Daily , Weekly | |
| Add NTNX to Watchlist: View: Get Complete NTNX Trend Analysis ➞ | |
| For tabular summary view of above stock list: Summary View ➞ 0 - 25 , 25 - 50 , 50 - 75 , 75 - 100 , 100 - 125 , 125 - 150 , 150 - 175 , 175 - 200 , 200 - 225 , 225 - 250 , 250 - 275 , 275 - 300 , 300 - 325 , 325 - 350 , 350 - 375 , 375 - 400 , 400 - 425 , 425 - 450 , 450 - 475 , 475 - 500 , 500 - 525 , 525 - 550 , 550 - 575 , 575 - 600 , 600 - 625 , 625 - 650 , 650 - 675 , 675 - 700 , 700 - 725 | ||
| Click To Change The Sort Order: By Market Cap or Company Size Performance: Year-to-date, Week and Day | |
| Select Chart Type: | ||
|
Best Stocks Today 12Stocks.com |
© 2024 12Stocks.com Terms & Conditions Privacy Contact Us
All Information Provided Only For Education And Not To Be Used For Investing or Trading. See Terms & Conditions


One More Thing ... Get Best Stocks Delivered Daily!
Never Ever Miss A Move With Our Top Ten Stocks Lists
Find Best Stocks In Any Market - Bull or Bear Market
Take A Peek At Our Top Ten Stocks Lists: Daily, Weekly, Year-to-Date & Top Trends
Find Best Stocks In Any Market - Bull or Bear Market
Take A Peek At Our Top Ten Stocks Lists: Daily, Weekly, Year-to-Date & Top Trends
Midcap Stocks With Best Up Trends [0-bearish to 100-bullish]: Celsius [100], Spectrum [100], Planet Fitness[100], NRG Energy[100], Clearway Energy[100], Maravai LifeSciences[100], US Foods[100], Nexstar Media[100], MKS Instruments[100], Wayfair [100], Darling Ingredients[100]
Best Midcap Stocks Year-to-Date:
Vistra Energy[137.79%], EMCOR [77.37%], ShockWave Medical[73.53%], Tenet [65.86%], Spotify [59.48%], NRG Energy[56.17%], Williams-Sonoma [54.72%], Wingstop [53.87%], Celsius [53.44%], Pure Storage[52.64%], Antero Resources[50.79%] Best Midcap Stocks This Week:
Elanco Animal[25.61%], Peloton Interactive[21.31%], Globus Medical[19.2%], Cirrus Logic[16.35%], Louisiana-Pacific [16.3%], RingCentral [15.45%], Globe Life[14.26%], Petco Health[13.87%], Vistra Energy[12.4%], YETI [12.28%], Spectrum [12.19%] Best Midcap Stocks Daily:
Celsius [14.62%], YETI [11.63%], Spectrum [11.06%], Texas Pacific[10.34%], Planet Fitness[7.71%], Plug Power[7.34%], NRG Energy[6.49%], Clearway Energy[5.82%], Penn National[5.72%], Shift4 Payments[5.58%], Peloton Interactive[5.46%]