
 Login Sign Up


| |||||
 |  | ||||

| 12Stocks.com Market Intelligence |
Best Industrial Stocks
| In a hurry? Industrial Stocks Lists: Performance Trends Table, Stock Charts
Sort Industrial stocks: Daily, Weekly, Year-to-Date, Market Cap & Trends. Filter Industrial stocks list by size:All Industrial Large Mid-Range Small |
| 12Stocks.com Industrial Stocks Performances & Trends Daily | |||||||||
|
|  The overall Smart Investing & Trading Score is 61 (0-bearish to 100-bullish) which puts Industrial sector in short term neutral to bullish trend. The Smart Investing & Trading Score from previous trading session is 88 and a deterioration of trend continues.
| ||||||||
Here are the Smart Investing & Trading Scores of the most requested Industrial stocks at 12Stocks.com (click stock name for detailed review):
|


| 12Stocks.com: Investing in Industrial sector with Stocks | |
|
The following table helps investors and traders sort through current performance and trends (as measured by Smart Investing & Trading Score) of various
stocks in the Industrial sector. Quick View: Move mouse or cursor over stock symbol (ticker) to view short-term Technical chart and over stock name to view long term chart. Click on  to add stock symbol to your watchlist and to add stock symbol to your watchlist and  to view watchlist. Click on any ticker or stock name for detailed market intelligence report for that stock. to view watchlist. Click on any ticker or stock name for detailed market intelligence report for that stock. |
12Stocks.com Performance of Stocks in Industrial Sector
| Ticker | Stock Name | Watchlist | Category | Recent Price | Smart Investing & Trading Score | Change % | Weekly Change% |
| TGI | Triumph |   | Aerospace/Defense | 14.66 | 73 | -0.88% | 2.37% |
| THR | Thermon | | Machinery | 34.99 | 95 | 1.27% | 1.83% |
| LEN | Lennar | | Residential | 165.88 | 78 | 0.41% | 1.81% |
| GTLS | Chart Industries | | Fabrication | 154.00 | 58 | 0.00% | 1.78% |
| BCC | Boise Cascade | | Lumber, Wood | 136.05 | 28 | -0.90% | 1.77% |
| SLDP | Solid Power | | Electrical Equipment & Parts | 1.75 | 58 | -1.69% | 1.74% |
| UFPI | Universal Forest | | Lumber, Wood | 119.92 | 58 | 0.37% | 1.56% |
| LEGH | Legacy Housing | | Residential | 23.77 | 50 | -0.21% | 1.54% |
| PCH | PotlatchDeltic | | Lumber, Wood | 43.83 | 42 | -0.43% | 1.53% |
| IR | Ingersoll Rand | | Machinery | 92.65 | 68 | 1.37% | 1.52% |
| MTH | Meritage Homes | | Residential | 183.00 | 76 | -0.02% | 1.51% |
| HON | Honeywell | | Machinery | 205.97 | 90 | -0.31% | 1.50% |
| CODI | Compass Diversified | | Conglomerates | 22.29 | 42 | 0.72% | 1.50% |
| BAER | Bridger Aerospace | | Security & Protection | 4.15 | 35 | 3.49% | 1.47% |
| AIN | Albany | | Textile Industrial | 90.10 | 42 | 0.01% | 1.43% |
| HII | Huntington Ingalls | | Aerospace/Defense | 255.60 | 49 | -0.22% | 1.42% |
| EVTL | Vertical Aerospace | | Aerospace & Defense | 0.72 | 20 | 0.13% | 1.39% |
| ACHR | Archer Aviation | | Aerospace & Defense | 3.70 | 10 | -2.89% | 1.37% |
| PINS | | Conglomerates | 42.78 | 83 | 0.02% | 1.33% | |
| RYI | Ryerson Holding | | Fabrication | 22.95 | 39 | -4.14% | 1.32% |
| RYI | Ryerson Holding | | Fabrication | 9.45 | 39 | 0.64% | 1.32% |
| WWD | Woodward | | Aerospace/Defense | 179.50 | 90 | 0.64% | 1.26% |
| BZH | Beazer Homes | | Residential | 28.77 | 47 | 1.30% | 1.20% |
| PHM | Pulte | | Residential | 119.07 | 73 | 0.35% | 1.18% |
| AZEK | AZEK | | Building Products & Equipment | 46.63 | 42 | -0.41% | 1.15% |
| For chart view version of above stock list: Chart View ➞ 0 - 25 , 25 - 50 , 50 - 75 , 75 - 100 , 100 - 125 , 125 - 150 , 150 - 175 , 175 - 200 , 200 - 225 , 225 - 250 , 250 - 275 , 275 - 300 | ||
 | Click To Change The Sort Order: By Market Cap or Company Size Performance: Year-to-date, Week and Day |  |
|
Get the most comprehensive stock market coverage daily at 12Stocks.com ➞ Best Stocks Today ➞ Best Stocks Weekly ➞ Best Stocks Year-to-Date ➞ Best Stocks Trends ➞  Best Stocks Today 12Stocks.com Best Nasdaq Stocks ➞ Best S&P 500 Stocks ➞ Best Tech Stocks ➞ Best Biotech Stocks ➞ |
| Detailed Overview of Industrial Stocks |
| Industrial Technical Overview, Leaders & Laggards, Top Industrial ETF Funds & Detailed Industrial Stocks List, Charts, Trends & More |
| Industrial Sector: Technical Analysis, Trends & YTD Performance | |
| Industrial sector is composed of stocks
from industrial machinery, aerospace, defense, farm/construction
and industrial services subsectors. Industrial sector, as represented by XLI, an exchange-traded fund [ETF] that holds basket of Industrial stocks (e.g, Caterpillar, Boeing) is up by 9.95% and is currently underperforming the overall market by -0.62% year-to-date. Below is a quick view of Technical charts and trends: |
|
 XLI Weekly Chart |
|
| Long Term Trend: Very Good | |
| Medium Term Trend: Good | |
 XLI Daily Chart |
|
| Short Term Trend: Good | |
| Overall Trend Score: 61 | |
| YTD Performance: 9.95% | |
| **Trend Scores & Views Are Only For Educational Purposes And Not For Investing | |
| 12Stocks.com: Top Performing Industrial Sector Stocks | ||||||||||||||||||||||||||||||||||||||||||||||||
 The top performing Industrial sector stocks year to date are
Now, more recently, over last week, the top performing Industrial sector stocks on the move are


|
||||||||||||||||||||||||||||||||||||||||||||||||
| 12Stocks.com: Investing in Industrial Sector using Exchange Traded Funds | |
|
The following table shows list of key exchange traded funds (ETF) that
help investors track Industrial Index. For detailed view, check out our ETF Funds section of our website. Quick View: Move mouse or cursor over ETF symbol (ticker) to view short-term Technical chart and over ETF name to view long term chart. Click on ticker or stock name for detailed view. Click on to add stock symbol to your watchlist and to view watchlist. |
12Stocks.com List of ETFs that track Industrial Index
| Ticker | ETF Name | Watchlist | Recent Price | Smart Investing & Trading Score | Change % | Week % | Year-to-date % |
| XLI | Industrial | | 125.33 | 61 | 0.11 | -0.28 | 9.95% |
| UXI | Industrials | | 33.88 | 61 | -0.39 | -0.94 | 17.67% |
| PPA | Aerospace & Defense | | 105.04 | 76 | 0.25 | 0.16 | 13.98% |
| ITA | Aerospace & Defense | | 135.50 | 83 | 0.41 | 0.3 | 7.03% |
| ITB | Home Construction | | 108.69 | 53 | 0.00 | 0.11 | 6.84% |
| XHB | Homebuilders | | 107.17 | 66 | 0.14 | -0.32 | 12.03% |
| SIJ | Short Industrials | | 9.53 | 35 | 0.18 | 0.99 | -15.99% |
| IYJ | Industrials | | 124.41 | 71 | 0.15 | -0.07 | 8.79% |
| EXI | Global Industrials | | 140.28 | 71 | -0.08 | -0.15 | 10.08% |
| VIS | Industrials | | 242.29 | 61 | 0.09 | -0.35 | 9.92% |
| PSCI | SmallCap Industrials | | 123.45 | 63 | -0.48 | -0.63 | 6.46% |
| XAR | Aerospace & Defense | | 143.28 | 76 | 0.07 | 0.77 | 5.8% |
| ARKQ | ARK Industrial Innovation | | 56.19 | 81 | 0.88 | 3.65 | -2.62% |
| 12Stocks.com: Charts, Trends, Fundamental Data and Performances of Industrial Stocks | |
|
We now take in-depth look at all Industrial stocks including charts, multi-period performances and overall trends (as measured by Smart Investing & Trading Score). One can sort Industrial stocks (click link to choose) by Daily, Weekly and by Year-to-Date performances. Also, one can sort by size of the company or by market capitalization. |
| Select Your Default Chart Type: | |||||
| |||||
| Click on stock symbol or name for detailed view. Click on to add stock symbol to your watchlist and to view watchlist. Quick View: Move mouse or cursor over "Daily" to quickly view daily Technical stock chart and over "Weekly" to view weekly Technical stock chart. | |||||

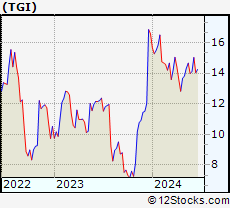 | TGI Triumph Group, Inc. |
| Sector: Industrials | |
| SubSector: Aerospace/Defense Products & Services | |
| MarketCap: 358.901 Millions | |
| Recent Price: 14.66 Smart Investing & Trading Score: 73 | |
| Day Percent Change: -0.88% Day Change: -0.13 | |
| Week Change: 2.37% Year-to-date Change: -11.6% | |
| TGI Links: Profile News Message Board | |
| Charts:- Daily , Weekly | |
| Add TGI to Watchlist: View: Get Complete TGI Trend Analysis ➞ | |
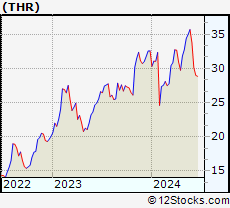 | THR Thermon Group Holdings, Inc. |
| Sector: Industrials | |
| SubSector: Diversified Machinery | |
| MarketCap: 492.816 Millions | |
| Recent Price: 34.99 Smart Investing & Trading Score: 95 | |
| Day Percent Change: 1.27% Day Change: 0.44 | |
| Week Change: 1.83% Year-to-date Change: 7.4% | |
| THR Links: Profile News Message Board | |
| Charts:- Daily , Weekly | |
| Add THR to Watchlist: View: Get Complete THR Trend Analysis ➞ | |
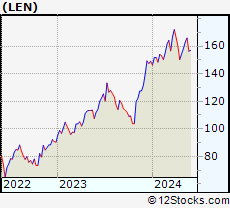 | LEN Lennar Corporation |
| Sector: Industrials | |
| SubSector: Residential Construction | |
| MarketCap: 11926.6 Millions | |
| Recent Price: 165.88 Smart Investing & Trading Score: 78 | |
| Day Percent Change: 0.41% Day Change: 0.68 | |
| Week Change: 1.81% Year-to-date Change: 11.3% | |
| LEN Links: Profile News Message Board | |
| Charts:- Daily , Weekly | |
| Add LEN to Watchlist: View: Get Complete LEN Trend Analysis ➞ | |
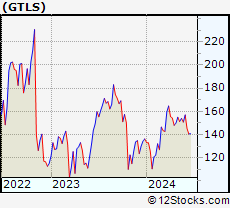 | GTLS Chart Industries, Inc. |
| Sector: Industrials | |
| SubSector: Metal Fabrication | |
| MarketCap: 751.15 Millions | |
| Recent Price: 154.00 Smart Investing & Trading Score: 58 | |
| Day Percent Change: 0.00% Day Change: 0.00 | |
| Week Change: 1.78% Year-to-date Change: 13.0% | |
| GTLS Links: Profile News Message Board | |
| Charts:- Daily , Weekly | |
| Add GTLS to Watchlist: View: Get Complete GTLS Trend Analysis ➞ | |
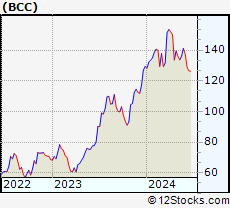 | BCC Boise Cascade Company |
| Sector: Industrials | |
| SubSector: Lumber, Wood Production | |
| MarketCap: 963.938 Millions | |
| Recent Price: 136.05 Smart Investing & Trading Score: 28 | |
| Day Percent Change: -0.90% Day Change: -1.24 | |
| Week Change: 1.77% Year-to-date Change: 5.2% | |
| BCC Links: Profile News Message Board | |
| Charts:- Daily , Weekly | |
| Add BCC to Watchlist: View: Get Complete BCC Trend Analysis ➞ | |
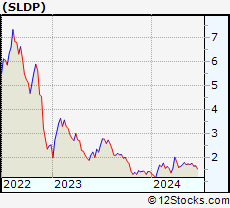 | SLDP Solid Power, Inc. |
| Sector: Industrials | |
| SubSector: Electrical Equipment & Parts | |
| MarketCap: 445 Millions | |
| Recent Price: 1.75 Smart Investing & Trading Score: 58 | |
| Day Percent Change: -1.69% Day Change: -0.03 | |
| Week Change: 1.74% Year-to-date Change: 22.8% | |
| SLDP Links: Profile News Message Board | |
| Charts:- Daily , Weekly | |
| Add SLDP to Watchlist: View: Get Complete SLDP Trend Analysis ➞ | |
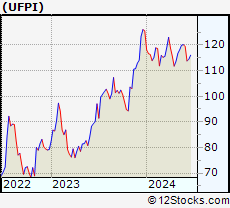 | UFPI Universal Forest Products, Inc. |
| Sector: Industrials | |
| SubSector: Lumber, Wood Production | |
| MarketCap: 2263.38 Millions | |
| Recent Price: 119.92 Smart Investing & Trading Score: 58 | |
| Day Percent Change: 0.37% Day Change: 0.44 | |
| Week Change: 1.56% Year-to-date Change: -4.5% | |
| UFPI Links: Profile News Message Board | |
| Charts:- Daily , Weekly | |
| Add UFPI to Watchlist: View: Get Complete UFPI Trend Analysis ➞ | |
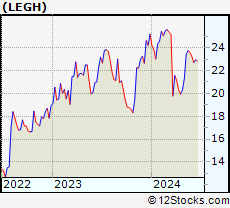 | LEGH Legacy Housing Corporation |
| Sector: Industrials | |
| SubSector: Residential Construction | |
| MarketCap: 298.006 Millions | |
| Recent Price: 23.77 Smart Investing & Trading Score: 50 | |
| Day Percent Change: -0.21% Day Change: -0.05 | |
| Week Change: 1.54% Year-to-date Change: -5.8% | |
| LEGH Links: Profile News Message Board | |
| Charts:- Daily , Weekly | |
| Add LEGH to Watchlist: View: Get Complete LEGH Trend Analysis ➞ | |
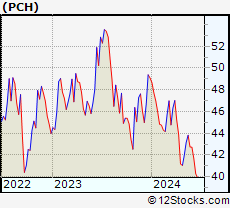 | PCH PotlatchDeltic Corporation |
| Sector: Industrials | |
| SubSector: Lumber, Wood Production | |
| MarketCap: 2314.68 Millions | |
| Recent Price: 43.83 Smart Investing & Trading Score: 42 | |
| Day Percent Change: -0.43% Day Change: -0.19 | |
| Week Change: 1.53% Year-to-date Change: -10.7% | |
| PCH Links: Profile News Message Board | |
| Charts:- Daily , Weekly | |
| Add PCH to Watchlist: View: Get Complete PCH Trend Analysis ➞ | |
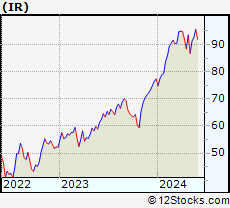 | IR Ingersoll Rand Inc. |
| Sector: Industrials | |
| SubSector: Diversified Machinery | |
| MarketCap: 8970.56 Millions | |
| Recent Price: 92.65 Smart Investing & Trading Score: 68 | |
| Day Percent Change: 1.37% Day Change: 1.25 | |
| Week Change: 1.52% Year-to-date Change: 19.8% | |
| IR Links: Profile News Message Board | |
| Charts:- Daily , Weekly | |
| Add IR to Watchlist: View: Get Complete IR Trend Analysis ➞ | |
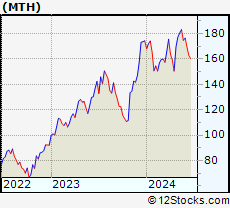 | MTH Meritage Homes Corporation |
| Sector: Industrials | |
| SubSector: Residential Construction | |
| MarketCap: 1440.36 Millions | |
| Recent Price: 183.00 Smart Investing & Trading Score: 76 | |
| Day Percent Change: -0.02% Day Change: -0.03 | |
| Week Change: 1.51% Year-to-date Change: 5.1% | |
| MTH Links: Profile News Message Board | |
| Charts:- Daily , Weekly | |
| Add MTH to Watchlist: View: Get Complete MTH Trend Analysis ➞ | |
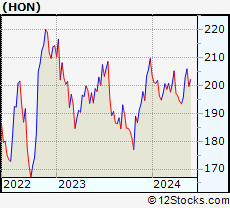 | HON Honeywell International Inc. |
| Sector: Industrials | |
| SubSector: Diversified Machinery | |
| MarketCap: 91189.1 Millions | |
| Recent Price: 205.97 Smart Investing & Trading Score: 90 | |
| Day Percent Change: -0.31% Day Change: -0.65 | |
| Week Change: 1.5% Year-to-date Change: -1.8% | |
| HON Links: Profile News Message Board | |
| Charts:- Daily , Weekly | |
| Add HON to Watchlist: View: Get Complete HON Trend Analysis ➞ | |
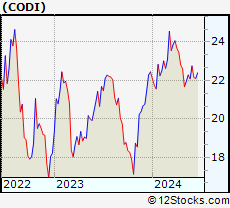 | CODI Compass Diversified Holdings LLC |
| Sector: Industrials | |
| SubSector: Conglomerates | |
| MarketCap: 803.348 Millions | |
| Recent Price: 22.29 Smart Investing & Trading Score: 42 | |
| Day Percent Change: 0.72% Day Change: 0.16 | |
| Week Change: 1.5% Year-to-date Change: -0.7% | |
| CODI Links: Profile News Message Board | |
| Charts:- Daily , Weekly | |
| Add CODI to Watchlist: View: Get Complete CODI Trend Analysis ➞ | |
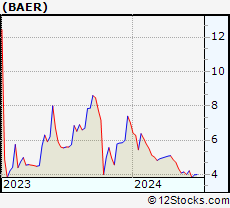 | BAER Bridger Aerospace Group Holdings, Inc. |
| Sector: Industrials | |
| SubSector: Security & Protection Services | |
| MarketCap: 239 Millions | |
| Recent Price: 4.15 Smart Investing & Trading Score: 35 | |
| Day Percent Change: 3.49% Day Change: 0.14 | |
| Week Change: 1.47% Year-to-date Change: -40.9% | |
| BAER Links: Profile News Message Board | |
| Charts:- Daily , Weekly | |
| Add BAER to Watchlist: View: Get Complete BAER Trend Analysis ➞ | |
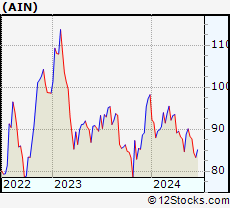 | AIN Albany International Corp. |
| Sector: Industrials | |
| SubSector: Textile Industrial | |
| MarketCap: 1538.4 Millions | |
| Recent Price: 90.10 Smart Investing & Trading Score: 42 | |
| Day Percent Change: 0.01% Day Change: 0.01 | |
| Week Change: 1.43% Year-to-date Change: -8.3% | |
| AIN Links: Profile News Message Board | |
| Charts:- Daily , Weekly | |
| Add AIN to Watchlist: View: Get Complete AIN Trend Analysis ➞ | |
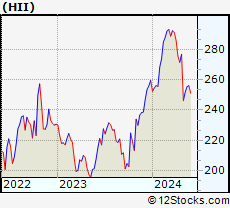 | HII Huntington Ingalls Industries, Inc. |
| Sector: Industrials | |
| SubSector: Aerospace/Defense Products & Services | |
| MarketCap: 7276.11 Millions | |
| Recent Price: 255.60 Smart Investing & Trading Score: 49 | |
| Day Percent Change: -0.22% Day Change: -0.56 | |
| Week Change: 1.42% Year-to-date Change: -1.6% | |
| HII Links: Profile News Message Board | |
| Charts:- Daily , Weekly | |
| Add HII to Watchlist: View: Get Complete HII Trend Analysis ➞ | |
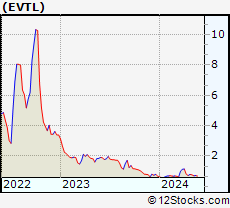 | EVTL Vertical Aerospace Ltd. |
| Sector: Industrials | |
| SubSector: Aerospace & Defense | |
| MarketCap: 403 Millions | |
| Recent Price: 0.72 Smart Investing & Trading Score: 20 | |
| Day Percent Change: 0.13% Day Change: 0.00 | |
| Week Change: 1.39% Year-to-date Change: 5.2% | |
| EVTL Links: Profile News Message Board | |
| Charts:- Daily , Weekly | |
| Add EVTL to Watchlist: View: Get Complete EVTL Trend Analysis ➞ | |
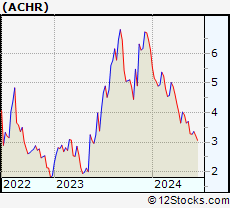 | ACHR Archer Aviation Inc. |
| Sector: Industrials | |
| SubSector: Aerospace & Defense | |
| MarketCap: 976 Millions | |
| Recent Price: 3.70 Smart Investing & Trading Score: 10 | |
| Day Percent Change: -2.89% Day Change: -0.11 | |
| Week Change: 1.37% Year-to-date Change: -39.5% | |
| ACHR Links: Profile News Message Board | |
| Charts:- Daily , Weekly | |
| Add ACHR to Watchlist: View: Get Complete ACHR Trend Analysis ➞ | |
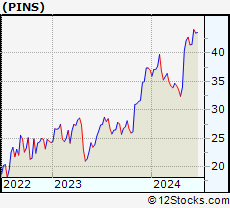 | PINS Pinterest, Inc. |
| Sector: Industrials | |
| SubSector: Conglomerates | |
| MarketCap: 8115.78 Millions | |
| Recent Price: 42.78 Smart Investing & Trading Score: 83 | |
| Day Percent Change: 0.02% Day Change: 0.01 | |
| Week Change: 1.33% Year-to-date Change: 15.5% | |
| PINS Links: Profile News Message Board | |
| Charts:- Daily , Weekly | |
| Add PINS to Watchlist: View: Get Complete PINS Trend Analysis ➞ | |
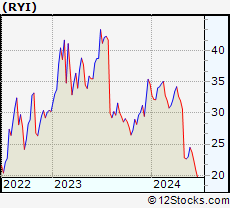 | RYI Ryerson Holding Corporation |
| Sector: Industrials | |
| SubSector: Metal Fabrication | |
| MarketCap: 202.55 Millions | |
| Recent Price: 22.95 Smart Investing & Trading Score: 39 | |
| Day Percent Change: -4.14% Day Change: -0.99 | |
| Week Change: 1.32% Year-to-date Change: -33.8% | |
| RYI Links: Profile News Message Board | |
| Charts:- Daily , Weekly | |
| Add RYI to Watchlist: View: Get Complete RYI Trend Analysis ➞ | |
| RYI Ryerson Holding Corporation |
| Sector: Industrials | |
| SubSector: Metal Fabrication | |
| MarketCap: 202.55 Millions | |
| Recent Price: 9.45 Smart Investing & Trading Score: 39 | |
| Day Percent Change: 0.64% Day Change: 0.06 | |
| Week Change: 1.32% Year-to-date Change: -33.8% | |
| RYI Links: Profile News Message Board | |
| Charts:- Daily , Weekly | |
| Add RYI to Watchlist: View: Get Complete RYI Trend Analysis ➞ | |
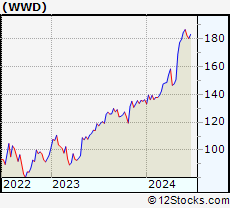 | WWD Woodward, Inc. |
| Sector: Industrials | |
| SubSector: Aerospace/Defense Products & Services | |
| MarketCap: 3764.01 Millions | |
| Recent Price: 179.50 Smart Investing & Trading Score: 90 | |
| Day Percent Change: 0.64% Day Change: 1.15 | |
| Week Change: 1.26% Year-to-date Change: 31.9% | |
| WWD Links: Profile News Message Board | |
| Charts:- Daily , Weekly | |
| Add WWD to Watchlist: View: Get Complete WWD Trend Analysis ➞ | |
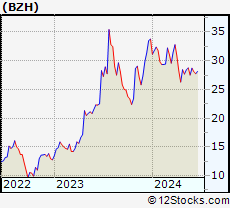 | BZH Beazer Homes USA, Inc. |
| Sector: Industrials | |
| SubSector: Residential Construction | |
| MarketCap: 180.106 Millions | |
| Recent Price: 28.77 Smart Investing & Trading Score: 47 | |
| Day Percent Change: 1.30% Day Change: 0.37 | |
| Week Change: 1.2% Year-to-date Change: -14.9% | |
| BZH Links: Profile News Message Board | |
| Charts:- Daily , Weekly | |
| Add BZH to Watchlist: View: Get Complete BZH Trend Analysis ➞ | |
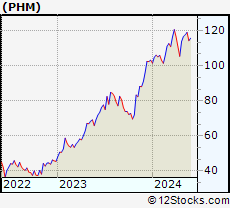 | PHM PulteGroup, Inc. |
| Sector: Industrials | |
| SubSector: Residential Construction | |
| MarketCap: 6186.46 Millions | |
| Recent Price: 119.07 Smart Investing & Trading Score: 73 | |
| Day Percent Change: 0.35% Day Change: 0.41 | |
| Week Change: 1.18% Year-to-date Change: 15.4% | |
| PHM Links: Profile News Message Board | |
| Charts:- Daily , Weekly | |
| Add PHM to Watchlist: View: Get Complete PHM Trend Analysis ➞ | |
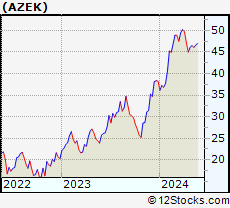 | AZEK The AZEK Company Inc. |
| Sector: Industrials | |
| SubSector: Building Products & Equipment | |
| MarketCap: 55127 Millions | |
| Recent Price: 46.63 Smart Investing & Trading Score: 42 | |
| Day Percent Change: -0.41% Day Change: -0.19 | |
| Week Change: 1.15% Year-to-date Change: 21.9% | |
| AZEK Links: Profile News Message Board | |
| Charts:- Daily , Weekly | |
| Add AZEK to Watchlist: View: Get Complete AZEK Trend Analysis ➞ | |
| For tabular summary view of above stock list: Summary View ➞ 0 - 25 , 25 - 50 , 50 - 75 , 75 - 100 , 100 - 125 , 125 - 150 , 150 - 175 , 175 - 200 , 200 - 225 , 225 - 250 , 250 - 275 , 275 - 300 | ||
| Click To Change The Sort Order: By Market Cap or Company Size Performance: Year-to-date, Week and Day | |
| Select Chart Type: | ||
|
Best Stocks Today 12Stocks.com |
© 2024 12Stocks.com Terms & Conditions Privacy Contact Us
All Information Provided Only For Education And Not To Be Used For Investing or Trading. See Terms & Conditions


One More Thing ... Get Best Stocks Delivered Daily!
Never Ever Miss A Move With Our Top Ten Stocks Lists
Find Best Stocks In Any Market - Bull or Bear Market
Take A Peek At Our Top Ten Stocks Lists: Daily, Weekly, Year-to-Date & Top Trends
Find Best Stocks In Any Market - Bull or Bear Market
Take A Peek At Our Top Ten Stocks Lists: Daily, Weekly, Year-to-Date & Top Trends
Industrial Stocks With Best Up Trends [0-bearish to 100-bullish]: Enovix [100], RBC Bearings[100], Embraer S.A[100], Primoris Services[100], Himalaya Shipping[100], Steel Partners[100], Generac [100], General Dynamics[100], Select Energy[100], EHang [100], HEICO [100]
Best Industrial Stocks Year-to-Date:
Tutor Perini[116.26%], Intuitive Machines[111.52%], FTAI Infrastructure[109.25%], IES [101.91%], NuScale Power[95.66%], ZIM Integrated[93.79%], Powell Industries[78.87%], EMCOR [75.63%], Aspen Aerogels[70.69%], Caesarstone [70.59%], Redwire [70.53%] Best Industrial Stocks This Week:
Plug Power[26.95%], FuelCell Energy[19.63%], Embraer S.A[19.33%], Enovix [17.98%], Evolv Technologies[15.04%], Hertz Global[13.09%], Lilium N.V[12.96%], EHang [11.01%], PureCycle Technologies[10.54%], Astronics [10.23%], Montrose Environmental[9.34%] Best Industrial Stocks Daily:
Novonix [9.97%], Enovix [9.25%], RBC Bearings[7.11%], ESS Tech[5.46%], Amprius Technologies[5.38%], Freightos [4.95%], Xometry [4.91%], PureCycle Technologies[4.09%], MingZhu Logistics[3.79%], Eastern [3.67%], NuScale Power[3.61%]