
 Login Sign Up


| |||||
 |  | ||||

| 12Stocks.com Market Intelligence |
Best Industrial Stocks
| In a hurry? Industrial Stocks Lists: Performance Trends Table, Stock Charts
Sort Industrial stocks: Daily, Weekly, Year-to-Date, Market Cap & Trends. Filter Industrial stocks list by size:All Industrial Large Mid-Range Small |
| 12Stocks.com Industrial Stocks Performances & Trends Daily | |||||||||
|
|  The overall Smart Investing & Trading Score is 61 (0-bearish to 100-bullish) which puts Industrial sector in short term neutral to bullish trend. The Smart Investing & Trading Score from previous trading session is 88 and a deterioration of trend continues.
| ||||||||
Here are the Smart Investing & Trading Scores of the most requested Industrial stocks at 12Stocks.com (click stock name for detailed review):
|


| 12Stocks.com: Investing in Industrial sector with Stocks | |
|
The following table helps investors and traders sort through current performance and trends (as measured by Smart Investing & Trading Score) of various
stocks in the Industrial sector. Quick View: Move mouse or cursor over stock symbol (ticker) to view short-term Technical chart and over stock name to view long term chart. Click on  to add stock symbol to your watchlist and to add stock symbol to your watchlist and  to view watchlist. Click on any ticker or stock name for detailed market intelligence report for that stock. to view watchlist. Click on any ticker or stock name for detailed market intelligence report for that stock. |
12Stocks.com Performance of Stocks in Industrial Sector
| Ticker | Stock Name | Watchlist | Category | Recent Price | Smart Investing & Trading Score | Change % | Weekly Change% |
| ALG | Alamo |   | Machinery | 194.24 | 7 | -0.91% | -2.11% |
| GE | General Electric | | Machinery | 159.89 | 34 | -0.76% | -2.14% |
| LNN | Lindsay | | Machinery | 117.05 | 35 | -0.78% | -2.24% |
| FELE | Franklin Electric | | Electrical Equipment | 99.95 | 7 | -0.41% | -2.27% |
| EMR | Emerson Electric | | Electrical Equipment | 112.88 | 58 | 0.05% | -2.31% |
| AME | AMETEK | | Machinery | 166.80 | 0 | -0.66% | -2.34% |
| NX | Quanex Building | | Building Materials | 33.93 | 8 | -0.79% | -2.36% |
| GRC | Gorman-Rupp | | Machinery | 32.60 | 13 | 0.18% | -2.37% |
| BLD | TopBuild | | Building Materials | 404.04 | 28 | -0.47% | -2.51% |
| ADSE | ADS-TEC Energy | | Electrical Equipment & Parts | 10.85 | 20 | -1.27% | -2.52% |
| NDSN | Nordson | | Machinery | 271.65 | 76 | 0.40% | -2.60% |
| PWR | Quanta Services | | Contractors | 264.40 | 66 | 0.22% | -2.61% |
| DE | Deere & | | Machinery | 397.02 | 51 | 0.66% | -2.66% |
| CDRE | Cadre | | Aerospace & Defense | 30.45 | 17 | 1.84% | -2.75% |
| ATKR | Atkore | | Electrical Equipment | 151.86 | 10 | -1.13% | -2.78% |
| PH | Parker-Hannifin | | Equipment | 545.11 | 26 | 1.04% | -2.85% |
| SITE | SiteOne Landscape | | Small Tools & Accessories | 152.02 | 0 | -0.82% | -2.86% |
| CSWI | CSW s | | Machinery | 240.37 | 34 | -1.00% | -2.93% |
| MLI | Mueller Industries | | Fabrication | 57.51 | 51 | -1.30% | -2.97% |
| MAS | Masco | | Building Materials | 70.16 | 15 | -0.26% | -2.97% |
| KAI | Kadant | | Machinery | 279.02 | 17 | -0.04% | -2.97% |
| YGMZ | MingZhu Logistics | | Trucking | 0.36 | 20 | 3.79% | -2.97% |
| CAE | CAE | | Aerospace/Defense | 20.31 | 61 | -2.73% | -3.01% |
| PATK | Patrick Industries | | Lumber, Wood | 111.39 | 25 | -0.98% | -3.04% |
| HOLI | Hollysys Automation | | Electrical Equipment | 22.74 | 0 | -2.28% | -3.11% |
| For chart view version of above stock list: Chart View ➞ 0 - 25 , 25 - 50 , 50 - 75 , 75 - 100 , 100 - 125 , 125 - 150 , 150 - 175 , 175 - 200 , 200 - 225 , 225 - 250 , 250 - 275 , 275 - 300 | ||
 | Click To Change The Sort Order: By Market Cap or Company Size Performance: Year-to-date, Week and Day |  |
|
Get the most comprehensive stock market coverage daily at 12Stocks.com ➞ Best Stocks Today ➞ Best Stocks Weekly ➞ Best Stocks Year-to-Date ➞ Best Stocks Trends ➞  Best Stocks Today 12Stocks.com Best Nasdaq Stocks ➞ Best S&P 500 Stocks ➞ Best Tech Stocks ➞ Best Biotech Stocks ➞ |
| Detailed Overview of Industrial Stocks |
| Industrial Technical Overview, Leaders & Laggards, Top Industrial ETF Funds & Detailed Industrial Stocks List, Charts, Trends & More |
| Industrial Sector: Technical Analysis, Trends & YTD Performance | |
| Industrial sector is composed of stocks
from industrial machinery, aerospace, defense, farm/construction
and industrial services subsectors. Industrial sector, as represented by XLI, an exchange-traded fund [ETF] that holds basket of Industrial stocks (e.g, Caterpillar, Boeing) is up by 9.95% and is currently underperforming the overall market by -0.62% year-to-date. Below is a quick view of Technical charts and trends: |
|
 XLI Weekly Chart |
|
| Long Term Trend: Very Good | |
| Medium Term Trend: Good | |
 XLI Daily Chart |
|
| Short Term Trend: Good | |
| Overall Trend Score: 61 | |
| YTD Performance: 9.95% | |
| **Trend Scores & Views Are Only For Educational Purposes And Not For Investing | |
| 12Stocks.com: Top Performing Industrial Sector Stocks | ||||||||||||||||||||||||||||||||||||||||||||||||
 The top performing Industrial sector stocks year to date are
Now, more recently, over last week, the top performing Industrial sector stocks on the move are


|
||||||||||||||||||||||||||||||||||||||||||||||||
| 12Stocks.com: Investing in Industrial Sector using Exchange Traded Funds | |
|
The following table shows list of key exchange traded funds (ETF) that
help investors track Industrial Index. For detailed view, check out our ETF Funds section of our website. Quick View: Move mouse or cursor over ETF symbol (ticker) to view short-term Technical chart and over ETF name to view long term chart. Click on ticker or stock name for detailed view. Click on to add stock symbol to your watchlist and to view watchlist. |
12Stocks.com List of ETFs that track Industrial Index
| Ticker | ETF Name | Watchlist | Recent Price | Smart Investing & Trading Score | Change % | Week % | Year-to-date % |
| XLI | Industrial | | 125.33 | 61 | 0.11 | -0.28 | 9.95% |
| UXI | Industrials | | 33.88 | 61 | -0.39 | -0.94 | 17.67% |
| PPA | Aerospace & Defense | | 105.04 | 76 | 0.25 | 0.16 | 13.98% |
| ITA | Aerospace & Defense | | 135.50 | 83 | 0.41 | 0.3 | 7.03% |
| ITB | Home Construction | | 108.69 | 53 | 0.00 | 0.11 | 6.84% |
| XHB | Homebuilders | | 107.17 | 66 | 0.14 | -0.32 | 12.03% |
| SIJ | Short Industrials | | 9.53 | 35 | 0.18 | 0.99 | -15.99% |
| IYJ | Industrials | | 124.41 | 71 | 0.15 | -0.07 | 8.79% |
| EXI | Global Industrials | | 140.28 | 71 | -0.08 | -0.15 | 10.08% |
| VIS | Industrials | | 242.29 | 61 | 0.09 | -0.35 | 9.92% |
| PSCI | SmallCap Industrials | | 123.45 | 63 | -0.48 | -0.63 | 6.46% |
| XAR | Aerospace & Defense | | 143.28 | 76 | 0.07 | 0.77 | 5.8% |
| ARKQ | ARK Industrial Innovation | | 56.19 | 81 | 0.88 | 3.65 | -2.62% |
| 12Stocks.com: Charts, Trends, Fundamental Data and Performances of Industrial Stocks | |
|
We now take in-depth look at all Industrial stocks including charts, multi-period performances and overall trends (as measured by Smart Investing & Trading Score). One can sort Industrial stocks (click link to choose) by Daily, Weekly and by Year-to-Date performances. Also, one can sort by size of the company or by market capitalization. |
| Select Your Default Chart Type: | |||||
| |||||
| Click on stock symbol or name for detailed view. Click on to add stock symbol to your watchlist and to view watchlist. Quick View: Move mouse or cursor over "Daily" to quickly view daily Technical stock chart and over "Weekly" to view weekly Technical stock chart. | |||||

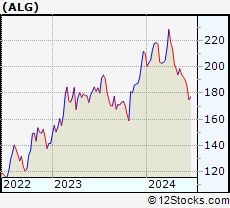 | ALG Alamo Group Inc. |
| Sector: Industrials | |
| SubSector: Farm & Construction Machinery | |
| MarketCap: 964.107 Millions | |
| Recent Price: 194.24 Smart Investing & Trading Score: 7 | |
| Day Percent Change: -0.91% Day Change: -1.78 | |
| Week Change: -2.11% Year-to-date Change: -7.6% | |
| ALG Links: Profile News Message Board | |
| Charts:- Daily , Weekly | |
| Add ALG to Watchlist: View: Get Complete ALG Trend Analysis ➞ | |
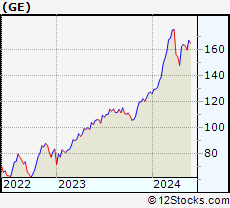 | GE General Electric Company |
| Sector: Industrials | |
| SubSector: Diversified Machinery | |
| MarketCap: 64710.6 Millions | |
| Recent Price: 159.89 Smart Investing & Trading Score: 34 | |
| Day Percent Change: -0.76% Day Change: -1.23 | |
| Week Change: -2.14% Year-to-date Change: 25.3% | |
| GE Links: Profile News Message Board | |
| Charts:- Daily , Weekly | |
| Add GE to Watchlist: View: Get Complete GE Trend Analysis ➞ | |
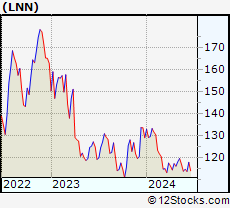 | LNN Lindsay Corporation |
| Sector: Industrials | |
| SubSector: Farm & Construction Machinery | |
| MarketCap: 1097.57 Millions | |
| Recent Price: 117.05 Smart Investing & Trading Score: 35 | |
| Day Percent Change: -0.78% Day Change: -0.92 | |
| Week Change: -2.24% Year-to-date Change: -9.4% | |
| LNN Links: Profile News Message Board | |
| Charts:- Daily , Weekly | |
| Add LNN to Watchlist: View: Get Complete LNN Trend Analysis ➞ | |
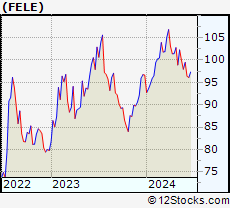 | FELE Franklin Electric Co., Inc. |
| Sector: Industrials | |
| SubSector: Industrial Electrical Equipment | |
| MarketCap: 2397.89 Millions | |
| Recent Price: 99.95 Smart Investing & Trading Score: 7 | |
| Day Percent Change: -0.41% Day Change: -0.41 | |
| Week Change: -2.27% Year-to-date Change: 3.4% | |
| FELE Links: Profile News Message Board | |
| Charts:- Daily , Weekly | |
| Add FELE to Watchlist: View: Get Complete FELE Trend Analysis ➞ | |
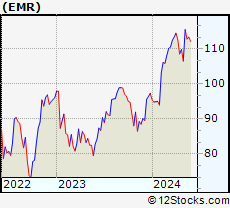 | EMR Emerson Electric Co. |
| Sector: Industrials | |
| SubSector: Industrial Electrical Equipment | |
| MarketCap: 30457.9 Millions | |
| Recent Price: 112.88 Smart Investing & Trading Score: 58 | |
| Day Percent Change: 0.05% Day Change: 0.06 | |
| Week Change: -2.31% Year-to-date Change: 16.0% | |
| EMR Links: Profile News Message Board | |
| Charts:- Daily , Weekly | |
| Add EMR to Watchlist: View: Get Complete EMR Trend Analysis ➞ | |
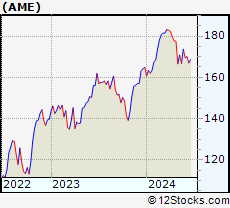 | AME AMETEK, Inc. |
| Sector: Industrials | |
| SubSector: Diversified Machinery | |
| MarketCap: 16611.8 Millions | |
| Recent Price: 166.80 Smart Investing & Trading Score: 0 | |
| Day Percent Change: -0.66% Day Change: -1.11 | |
| Week Change: -2.34% Year-to-date Change: 1.2% | |
| AME Links: Profile News Message Board | |
| Charts:- Daily , Weekly | |
| Add AME to Watchlist: View: Get Complete AME Trend Analysis ➞ | |
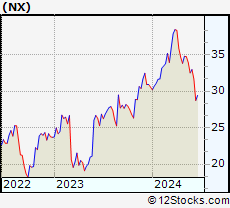 | NX Quanex Building Products Corporation |
| Sector: Industrials | |
| SubSector: General Building Materials | |
| MarketCap: 315.453 Millions | |
| Recent Price: 33.93 Smart Investing & Trading Score: 8 | |
| Day Percent Change: -0.79% Day Change: -0.27 | |
| Week Change: -2.36% Year-to-date Change: 11.0% | |
| NX Links: Profile News Message Board | |
| Charts:- Daily , Weekly | |
| Add NX to Watchlist: View: Get Complete NX Trend Analysis ➞ | |
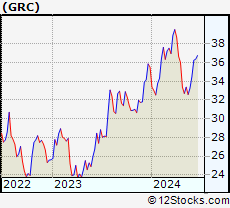 | GRC The Gorman-Rupp Company |
| Sector: Industrials | |
| SubSector: Diversified Machinery | |
| MarketCap: 729.616 Millions | |
| Recent Price: 32.60 Smart Investing & Trading Score: 13 | |
| Day Percent Change: 0.18% Day Change: 0.06 | |
| Week Change: -2.37% Year-to-date Change: -8.3% | |
| GRC Links: Profile News Message Board | |
| Charts:- Daily , Weekly | |
| Add GRC to Watchlist: View: Get Complete GRC Trend Analysis ➞ | |
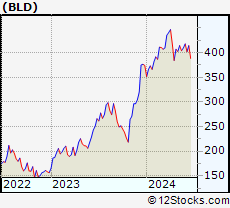 | BLD TopBuild Corp. |
| Sector: Industrials | |
| SubSector: General Building Materials | |
| MarketCap: 2534.53 Millions | |
| Recent Price: 404.04 Smart Investing & Trading Score: 28 | |
| Day Percent Change: -0.47% Day Change: -1.90 | |
| Week Change: -2.51% Year-to-date Change: 8.0% | |
| BLD Links: Profile News Message Board | |
| Charts:- Daily , Weekly | |
| Add BLD to Watchlist: View: Get Complete BLD Trend Analysis ➞ | |
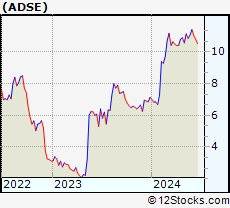 | ADSE ADS-TEC Energy PLC |
| Sector: Industrials | |
| SubSector: Electrical Equipment & Parts | |
| MarketCap: 329 Millions | |
| Recent Price: 10.85 Smart Investing & Trading Score: 20 | |
| Day Percent Change: -1.27% Day Change: -0.14 | |
| Week Change: -2.52% Year-to-date Change: 52.2% | |
| ADSE Links: Profile News Message Board | |
| Charts:- Daily , Weekly | |
| Add ADSE to Watchlist: View: Get Complete ADSE Trend Analysis ➞ | |
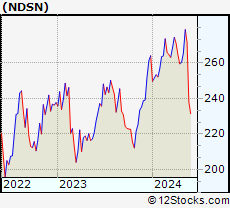 | NDSN Nordson Corporation |
| Sector: Industrials | |
| SubSector: Diversified Machinery | |
| MarketCap: 7117.56 Millions | |
| Recent Price: 271.65 Smart Investing & Trading Score: 76 | |
| Day Percent Change: 0.40% Day Change: 1.09 | |
| Week Change: -2.6% Year-to-date Change: 2.8% | |
| NDSN Links: Profile News Message Board | |
| Charts:- Daily , Weekly | |
| Add NDSN to Watchlist: View: Get Complete NDSN Trend Analysis ➞ | |
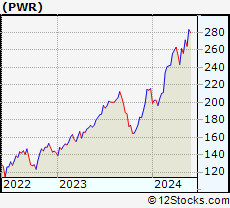 | PWR Quanta Services, Inc. |
| Sector: Industrials | |
| SubSector: General Contractors | |
| MarketCap: 3936.63 Millions | |
| Recent Price: 264.40 Smart Investing & Trading Score: 66 | |
| Day Percent Change: 0.22% Day Change: 0.58 | |
| Week Change: -2.61% Year-to-date Change: 22.5% | |
| PWR Links: Profile News Message Board | |
| Charts:- Daily , Weekly | |
| Add PWR to Watchlist: View: Get Complete PWR Trend Analysis ➞ | |
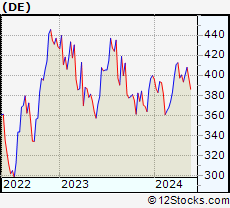 | DE Deere & Company |
| Sector: Industrials | |
| SubSector: Farm & Construction Machinery | |
| MarketCap: 39168.7 Millions | |
| Recent Price: 397.02 Smart Investing & Trading Score: 51 | |
| Day Percent Change: 0.66% Day Change: 2.59 | |
| Week Change: -2.66% Year-to-date Change: -0.7% | |
| DE Links: Profile News Message Board | |
| Charts:- Daily , Weekly | |
| Add DE to Watchlist: View: Get Complete DE Trend Analysis ➞ | |
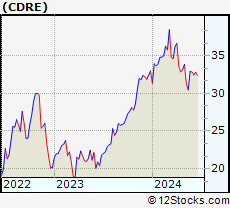 | CDRE Cadre Holdings, Inc. |
| Sector: Industrials | |
| SubSector: Aerospace & Defense | |
| MarketCap: 817 Millions | |
| Recent Price: 30.45 Smart Investing & Trading Score: 17 | |
| Day Percent Change: 1.84% Day Change: 0.55 | |
| Week Change: -2.75% Year-to-date Change: -7.6% | |
| CDRE Links: Profile News Message Board | |
| Charts:- Daily , Weekly | |
| Add CDRE to Watchlist: View: Get Complete CDRE Trend Analysis ➞ | |
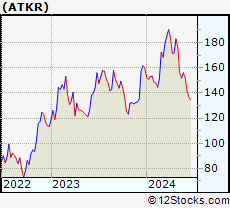 | ATKR Atkore International Group Inc. |
| Sector: Industrials | |
| SubSector: Industrial Electrical Equipment | |
| MarketCap: 1086.79 Millions | |
| Recent Price: 151.86 Smart Investing & Trading Score: 10 | |
| Day Percent Change: -1.13% Day Change: -1.74 | |
| Week Change: -2.78% Year-to-date Change: -5.1% | |
| ATKR Links: Profile News Message Board | |
| Charts:- Daily , Weekly | |
| Add ATKR to Watchlist: View: Get Complete ATKR Trend Analysis ➞ | |
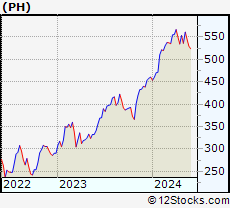 | PH Parker-Hannifin Corporation |
| Sector: Industrials | |
| SubSector: Industrial Equipment & Components | |
| MarketCap: 14888.9 Millions | |
| Recent Price: 545.11 Smart Investing & Trading Score: 26 | |
| Day Percent Change: 1.04% Day Change: 5.62 | |
| Week Change: -2.85% Year-to-date Change: 18.3% | |
| PH Links: Profile News Message Board | |
| Charts:- Daily , Weekly | |
| Add PH to Watchlist: View: Get Complete PH Trend Analysis ➞ | |
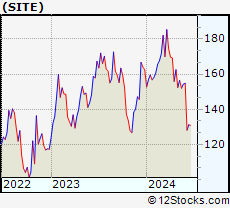 | SITE SiteOne Landscape Supply, Inc. |
| Sector: Industrials | |
| SubSector: Small Tools & Accessories | |
| MarketCap: 2733.56 Millions | |
| Recent Price: 152.02 Smart Investing & Trading Score: 0 | |
| Day Percent Change: -0.82% Day Change: -1.26 | |
| Week Change: -2.86% Year-to-date Change: -6.5% | |
| SITE Links: Profile News Message Board | |
| Charts:- Daily , Weekly | |
| Add SITE to Watchlist: View: Get Complete SITE Trend Analysis ➞ | |
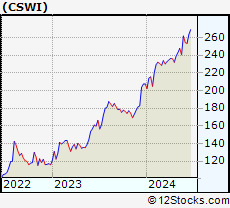 | CSWI CSW Industrials, Inc. |
| Sector: Industrials | |
| SubSector: Diversified Machinery | |
| MarketCap: 985.616 Millions | |
| Recent Price: 240.37 Smart Investing & Trading Score: 34 | |
| Day Percent Change: -1.00% Day Change: -2.42 | |
| Week Change: -2.93% Year-to-date Change: 15.9% | |
| CSWI Links: Profile News Message Board | |
| Charts:- Daily , Weekly | |
| Add CSWI to Watchlist: View: Get Complete CSWI Trend Analysis ➞ | |
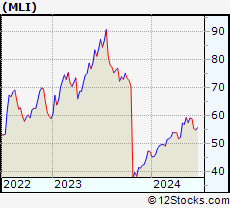 | MLI Mueller Industries, Inc. |
| Sector: Industrials | |
| SubSector: Metal Fabrication | |
| MarketCap: 1259.5 Millions | |
| Recent Price: 57.51 Smart Investing & Trading Score: 51 | |
| Day Percent Change: -1.30% Day Change: -0.76 | |
| Week Change: -2.97% Year-to-date Change: 22.0% | |
| MLI Links: Profile News Message Board | |
| Charts:- Daily , Weekly | |
| Add MLI to Watchlist: View: Get Complete MLI Trend Analysis ➞ | |
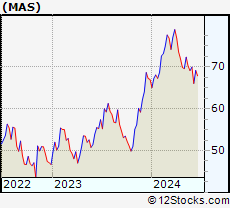 | MAS Masco Corporation |
| Sector: Industrials | |
| SubSector: General Building Materials | |
| MarketCap: 8655.63 Millions | |
| Recent Price: 70.16 Smart Investing & Trading Score: 15 | |
| Day Percent Change: -0.26% Day Change: -0.18 | |
| Week Change: -2.97% Year-to-date Change: 4.8% | |
| MAS Links: Profile News Message Board | |
| Charts:- Daily , Weekly | |
| Add MAS to Watchlist: View: Get Complete MAS Trend Analysis ➞ | |
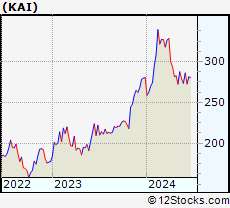 | KAI Kadant Inc. |
| Sector: Industrials | |
| SubSector: Diversified Machinery | |
| MarketCap: 787.116 Millions | |
| Recent Price: 279.02 Smart Investing & Trading Score: 17 | |
| Day Percent Change: -0.04% Day Change: -0.11 | |
| Week Change: -2.97% Year-to-date Change: -0.5% | |
| KAI Links: Profile News Message Board | |
| Charts:- Daily , Weekly | |
| Add KAI to Watchlist: View: Get Complete KAI Trend Analysis ➞ | |
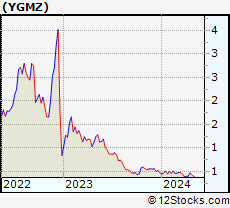 | YGMZ MingZhu Logistics Holdings Limited |
| Sector: Industrials | |
| SubSector: Trucking | |
| MarketCap: 41627 Millions | |
| Recent Price: 0.36 Smart Investing & Trading Score: 20 | |
| Day Percent Change: 3.79% Day Change: 0.01 | |
| Week Change: -2.97% Year-to-date Change: -24.0% | |
| YGMZ Links: Profile News Message Board | |
| Charts:- Daily , Weekly | |
| Add YGMZ to Watchlist: View: Get Complete YGMZ Trend Analysis ➞ | |
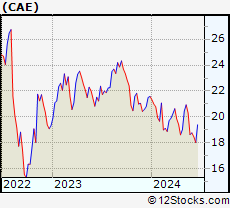 | CAE CAE Inc. |
| Sector: Industrials | |
| SubSector: Aerospace/Defense Products & Services | |
| MarketCap: 3739.61 Millions | |
| Recent Price: 20.31 Smart Investing & Trading Score: 61 | |
| Day Percent Change: -2.73% Day Change: -0.57 | |
| Week Change: -3.01% Year-to-date Change: -5.9% | |
| CAE Links: Profile News Message Board | |
| Charts:- Daily , Weekly | |
| Add CAE to Watchlist: View: Get Complete CAE Trend Analysis ➞ | |
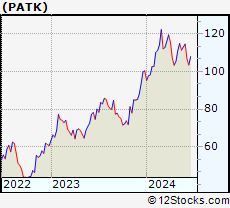 | PATK Patrick Industries, Inc. |
| Sector: Industrials | |
| SubSector: Lumber, Wood Production | |
| MarketCap: 565.838 Millions | |
| Recent Price: 111.39 Smart Investing & Trading Score: 25 | |
| Day Percent Change: -0.98% Day Change: -1.10 | |
| Week Change: -3.04% Year-to-date Change: 11.0% | |
| PATK Links: Profile News Message Board | |
| Charts:- Daily , Weekly | |
| Add PATK to Watchlist: View: Get Complete PATK Trend Analysis ➞ | |
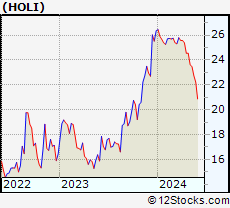 | HOLI Hollysys Automation Technologies Ltd. |
| Sector: Industrials | |
| SubSector: Industrial Electrical Equipment | |
| MarketCap: 668.379 Millions | |
| Recent Price: 22.74 Smart Investing & Trading Score: 0 | |
| Day Percent Change: -2.28% Day Change: -0.53 | |
| Week Change: -3.11% Year-to-date Change: -13.7% | |
| HOLI Links: Profile News Message Board | |
| Charts:- Daily , Weekly | |
| Add HOLI to Watchlist: View: Get Complete HOLI Trend Analysis ➞ | |
| For tabular summary view of above stock list: Summary View ➞ 0 - 25 , 25 - 50 , 50 - 75 , 75 - 100 , 100 - 125 , 125 - 150 , 150 - 175 , 175 - 200 , 200 - 225 , 225 - 250 , 250 - 275 , 275 - 300 | ||
| Click To Change The Sort Order: By Market Cap or Company Size Performance: Year-to-date, Week and Day | |
| Select Chart Type: | ||
|
Best Stocks Today 12Stocks.com |
© 2024 12Stocks.com Terms & Conditions Privacy Contact Us
All Information Provided Only For Education And Not To Be Used For Investing or Trading. See Terms & Conditions


One More Thing ... Get Best Stocks Delivered Daily!
Never Ever Miss A Move With Our Top Ten Stocks Lists
Find Best Stocks In Any Market - Bull or Bear Market
Take A Peek At Our Top Ten Stocks Lists: Daily, Weekly, Year-to-Date & Top Trends
Find Best Stocks In Any Market - Bull or Bear Market
Take A Peek At Our Top Ten Stocks Lists: Daily, Weekly, Year-to-Date & Top Trends
Industrial Stocks With Best Up Trends [0-bearish to 100-bullish]: Enovix [100], RBC Bearings[100], Embraer S.A[100], Primoris Services[100], Himalaya Shipping[100], Steel Partners[100], Generac [100], General Dynamics[100], Select Energy[100], EHang [100], HEICO [100]
Best Industrial Stocks Year-to-Date:
Tutor Perini[116.26%], Intuitive Machines[111.52%], FTAI Infrastructure[109.25%], IES [101.91%], NuScale Power[95.66%], ZIM Integrated[93.79%], Powell Industries[78.87%], EMCOR [75.63%], Aspen Aerogels[70.69%], Caesarstone [70.59%], Redwire [70.53%] Best Industrial Stocks This Week:
Plug Power[26.95%], FuelCell Energy[19.63%], Embraer S.A[19.33%], Enovix [17.98%], Evolv Technologies[15.04%], Hertz Global[13.09%], Lilium N.V[12.96%], EHang [11.01%], PureCycle Technologies[10.54%], Astronics [10.23%], Montrose Environmental[9.34%] Best Industrial Stocks Daily:
Novonix [9.97%], Enovix [9.25%], RBC Bearings[7.11%], ESS Tech[5.46%], Amprius Technologies[5.38%], Freightos [4.95%], Xometry [4.91%], PureCycle Technologies[4.09%], MingZhu Logistics[3.79%], Eastern [3.67%], NuScale Power[3.61%]