
 Login Sign Up


| |||||
 |  | ||||

| 12Stocks.com Market Intelligence |
Best Industrial Stocks
| In a hurry? Industrial Stocks Lists: Performance Trends Table, Stock Charts
Sort Industrial stocks: Daily, Weekly, Year-to-Date, Market Cap & Trends. Filter Industrial stocks list by size:All Industrial Large Mid-Range Small |
| 12Stocks.com Industrial Stocks Performances & Trends Daily | |||||||||
|
|  The overall Smart Investing & Trading Score is 61 (0-bearish to 100-bullish) which puts Industrial sector in short term neutral to bullish trend. The Smart Investing & Trading Score from previous trading session is 88 and a deterioration of trend continues.
| ||||||||
Here are the Smart Investing & Trading Scores of the most requested Industrial stocks at 12Stocks.com (click stock name for detailed review):
|


| 12Stocks.com: Investing in Industrial sector with Stocks | |
|
The following table helps investors and traders sort through current performance and trends (as measured by Smart Investing & Trading Score) of various
stocks in the Industrial sector. Quick View: Move mouse or cursor over stock symbol (ticker) to view short-term Technical chart and over stock name to view long term chart. Click on  to add stock symbol to your watchlist and to add stock symbol to your watchlist and  to view watchlist. Click on any ticker or stock name for detailed market intelligence report for that stock. to view watchlist. Click on any ticker or stock name for detailed market intelligence report for that stock. |
12Stocks.com Performance of Stocks in Industrial Sector
| Ticker | Stock Name | Watchlist | Category | Recent Price | Smart Investing & Trading Score | Change % | Weekly Change% |
| OC | Owens Corning |   | Building Materials | 176.38 | 71 | 1.53% | -0.24% |
| SPXC | SPX | | Machinery | 140.12 | 76 | 0.75% | -0.24% |
| ASPN | Aspen Aerogels | | Building Materials | 26.93 | 90 | 2.10% | -0.28% |
| OTIS | Otis Worldwide | | Specialty Industrial Machinery | 96.79 | 76 | 0.24% | -0.32% |
| MWA | Mueller Water | | Equipment | 19.20 | 83 | 0.16% | -0.36% |
| USLM | United States | | Building Materials | 364.82 | 68 | -0.71% | -0.39% |
| RXO | RXO | | Trucking | 20.58 | 32 | -2.60% | -0.39% |
| JOBY | Joby Aviation | | Airports & Air | 5.04 | 10 | 0.40% | -0.40% |
| JHX | James Hardie | | Cement | 36.76 | 40 | -1.47% | -0.41% |
| CARR | Carrier Global | | Building Products & Equipment | 65.23 | 69 | 0.35% | -0.41% |
| HLMN | Hillman | | Tools & Accessories | 9.54 | 0 | 0.10% | -0.42% |
| XMTR | Xometry | | Specialty Industrial Machinery | 16.23 | 27 | 4.91% | -0.43% |
| GMS | GMS | | Building Materials | 93.91 | 48 | 0.66% | -0.45% |
| ROAD | Construction Partners | | Heavy Construction | 55.44 | 71 | 1.17% | -0.45% |
| SKY | Skyline Champion | | Manufactured Housing | 79.68 | 37 | 0.20% | -0.47% |
| ENS | EnerSys | | Electrical Equipment | 96.37 | 68 | -1.87% | -0.49% |
| WM | Waste Management | | Waste Mgmt | 210.44 | 55 | -0.83% | -0.50% |
| EME | EMCOR | | Contractors | 378.37 | 73 | 0.74% | -0.50% |
| APOG | Apogee Enterprises | | Building Materials | 66.54 | 76 | 1.16% | -0.51% |
| LMT | Lockheed Martin | | Aerospace/Defense | 466.20 | 66 | 0.29% | -0.57% |
| RSG | Republic Services | | Waste Mgmt | 188.16 | 51 | 0.25% | -0.57% |
| CNHI | CNH | | Machinery | 11.45 | 32 | -0.61% | -0.61% |
| CVCO | Cavco Industries | | Residential | 374.21 | 35 | 0.65% | -0.64% |
| GGG | Graco | | Machinery | 83.02 | 37 | -0.47% | -0.65% |
| SKYH | Sky Harbour | | Aerospace & Defense | 12.18 | 70 | 1.50% | -0.65% |
| For chart view version of above stock list: Chart View ➞ 0 - 25 , 25 - 50 , 50 - 75 , 75 - 100 , 100 - 125 , 125 - 150 , 150 - 175 , 175 - 200 , 200 - 225 , 225 - 250 , 250 - 275 , 275 - 300 | ||
 | Click To Change The Sort Order: By Market Cap or Company Size Performance: Year-to-date, Week and Day |  |
|
Get the most comprehensive stock market coverage daily at 12Stocks.com ➞ Best Stocks Today ➞ Best Stocks Weekly ➞ Best Stocks Year-to-Date ➞ Best Stocks Trends ➞  Best Stocks Today 12Stocks.com Best Nasdaq Stocks ➞ Best S&P 500 Stocks ➞ Best Tech Stocks ➞ Best Biotech Stocks ➞ |
| Detailed Overview of Industrial Stocks |
| Industrial Technical Overview, Leaders & Laggards, Top Industrial ETF Funds & Detailed Industrial Stocks List, Charts, Trends & More |
| Industrial Sector: Technical Analysis, Trends & YTD Performance | |
| Industrial sector is composed of stocks
from industrial machinery, aerospace, defense, farm/construction
and industrial services subsectors. Industrial sector, as represented by XLI, an exchange-traded fund [ETF] that holds basket of Industrial stocks (e.g, Caterpillar, Boeing) is up by 9.95% and is currently underperforming the overall market by -0.62% year-to-date. Below is a quick view of Technical charts and trends: |
|
 XLI Weekly Chart |
|
| Long Term Trend: Very Good | |
| Medium Term Trend: Good | |
 XLI Daily Chart |
|
| Short Term Trend: Good | |
| Overall Trend Score: 61 | |
| YTD Performance: 9.95% | |
| **Trend Scores & Views Are Only For Educational Purposes And Not For Investing | |
| 12Stocks.com: Top Performing Industrial Sector Stocks | ||||||||||||||||||||||||||||||||||||||||||||||||
 The top performing Industrial sector stocks year to date are
Now, more recently, over last week, the top performing Industrial sector stocks on the move are


|
||||||||||||||||||||||||||||||||||||||||||||||||
| 12Stocks.com: Investing in Industrial Sector using Exchange Traded Funds | |
|
The following table shows list of key exchange traded funds (ETF) that
help investors track Industrial Index. For detailed view, check out our ETF Funds section of our website. Quick View: Move mouse or cursor over ETF symbol (ticker) to view short-term Technical chart and over ETF name to view long term chart. Click on ticker or stock name for detailed view. Click on to add stock symbol to your watchlist and to view watchlist. |
12Stocks.com List of ETFs that track Industrial Index
| Ticker | ETF Name | Watchlist | Recent Price | Smart Investing & Trading Score | Change % | Week % | Year-to-date % |
| XLI | Industrial | | 125.33 | 61 | 0.11 | -0.28 | 9.95% |
| UXI | Industrials | | 33.88 | 61 | -0.39 | -0.94 | 17.67% |
| PPA | Aerospace & Defense | | 105.04 | 76 | 0.25 | 0.16 | 13.98% |
| ITA | Aerospace & Defense | | 135.50 | 83 | 0.41 | 0.3 | 7.03% |
| ITB | Home Construction | | 108.69 | 53 | 0.00 | 0.11 | 6.84% |
| XHB | Homebuilders | | 107.17 | 66 | 0.14 | -0.32 | 12.03% |
| SIJ | Short Industrials | | 9.53 | 35 | 0.18 | 0.99 | -15.99% |
| IYJ | Industrials | | 124.41 | 71 | 0.15 | -0.07 | 8.79% |
| EXI | Global Industrials | | 140.28 | 71 | -0.08 | -0.15 | 10.08% |
| VIS | Industrials | | 242.29 | 61 | 0.09 | -0.35 | 9.92% |
| PSCI | SmallCap Industrials | | 123.45 | 63 | -0.48 | -0.63 | 6.46% |
| XAR | Aerospace & Defense | | 143.28 | 76 | 0.07 | 0.77 | 5.8% |
| ARKQ | ARK Industrial Innovation | | 56.19 | 81 | 0.88 | 3.65 | -2.62% |
| 12Stocks.com: Charts, Trends, Fundamental Data and Performances of Industrial Stocks | |
|
We now take in-depth look at all Industrial stocks including charts, multi-period performances and overall trends (as measured by Smart Investing & Trading Score). One can sort Industrial stocks (click link to choose) by Daily, Weekly and by Year-to-Date performances. Also, one can sort by size of the company or by market capitalization. |
| Select Your Default Chart Type: | |||||
| |||||
| Click on stock symbol or name for detailed view. Click on to add stock symbol to your watchlist and to view watchlist. Quick View: Move mouse or cursor over "Daily" to quickly view daily Technical stock chart and over "Weekly" to view weekly Technical stock chart. | |||||

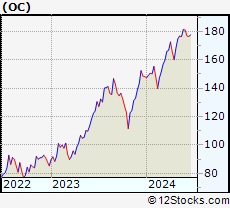 | OC Owens Corning |
| Sector: Industrials | |
| SubSector: General Building Materials | |
| MarketCap: 3686.73 Millions | |
| Recent Price: 176.38 Smart Investing & Trading Score: 71 | |
| Day Percent Change: 1.53% Day Change: 2.66 | |
| Week Change: -0.24% Year-to-date Change: 19.0% | |
| OC Links: Profile News Message Board | |
| Charts:- Daily , Weekly | |
| Add OC to Watchlist: View: Get Complete OC Trend Analysis ➞ | |
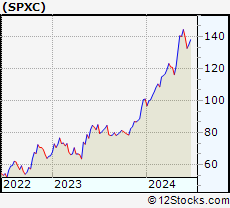 | SPXC SPX Corporation |
| Sector: Industrials | |
| SubSector: Diversified Machinery | |
| MarketCap: 1415.56 Millions | |
| Recent Price: 140.12 Smart Investing & Trading Score: 76 | |
| Day Percent Change: 0.75% Day Change: 1.04 | |
| Week Change: -0.24% Year-to-date Change: 38.7% | |
| SPXC Links: Profile News Message Board | |
| Charts:- Daily , Weekly | |
| Add SPXC to Watchlist: View: Get Complete SPXC Trend Analysis ➞ | |
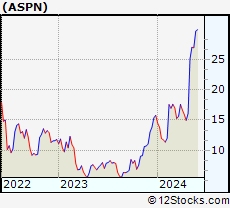 | ASPN Aspen Aerogels, Inc. |
| Sector: Industrials | |
| SubSector: General Building Materials | |
| MarketCap: 150.153 Millions | |
| Recent Price: 26.93 Smart Investing & Trading Score: 90 | |
| Day Percent Change: 2.10% Day Change: 0.55 | |
| Week Change: -0.28% Year-to-date Change: 70.7% | |
| ASPN Links: Profile News Message Board | |
| Charts:- Daily , Weekly | |
| Add ASPN to Watchlist: View: Get Complete ASPN Trend Analysis ➞ | |
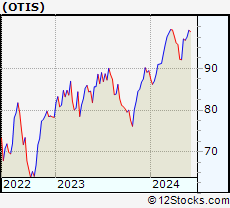 | OTIS Otis Worldwide Corporation |
| Sector: Industrials | |
| SubSector: Specialty Industrial Machinery | |
| MarketCap: 27727 Millions | |
| Recent Price: 96.79 Smart Investing & Trading Score: 76 | |
| Day Percent Change: 0.24% Day Change: 0.23 | |
| Week Change: -0.32% Year-to-date Change: 8.2% | |
| OTIS Links: Profile News Message Board | |
| Charts:- Daily , Weekly | |
| Add OTIS to Watchlist: View: Get Complete OTIS Trend Analysis ➞ | |
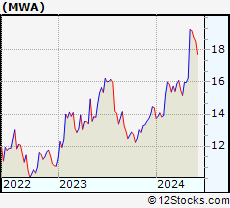 | MWA Mueller Water Products, Inc. |
| Sector: Industrials | |
| SubSector: Industrial Equipment & Components | |
| MarketCap: 1321.09 Millions | |
| Recent Price: 19.20 Smart Investing & Trading Score: 83 | |
| Day Percent Change: 0.16% Day Change: 0.03 | |
| Week Change: -0.36% Year-to-date Change: 33.3% | |
| MWA Links: Profile News Message Board | |
| Charts:- Daily , Weekly | |
| Add MWA to Watchlist: View: Get Complete MWA Trend Analysis ➞ | |
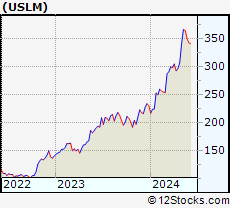 | USLM United States Lime & Minerals, Inc. |
| Sector: Industrials | |
| SubSector: General Building Materials | |
| MarketCap: 427.653 Millions | |
| Recent Price: 364.82 Smart Investing & Trading Score: 68 | |
| Day Percent Change: -0.71% Day Change: -2.61 | |
| Week Change: -0.39% Year-to-date Change: 58.4% | |
| USLM Links: Profile News Message Board | |
| Charts:- Daily , Weekly | |
| Add USLM to Watchlist: View: Get Complete USLM Trend Analysis ➞ | |
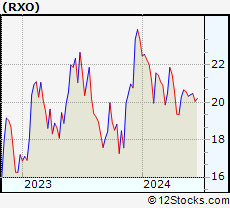 | RXO RXO, Inc. |
| Sector: Industrials | |
| SubSector: Trucking | |
| MarketCap: 2550 Millions | |
| Recent Price: 20.58 Smart Investing & Trading Score: 32 | |
| Day Percent Change: -2.60% Day Change: -0.55 | |
| Week Change: -0.39% Year-to-date Change: -11.9% | |
| RXO Links: Profile News Message Board | |
| Charts:- Daily , Weekly | |
| Add RXO to Watchlist: View: Get Complete RXO Trend Analysis ➞ | |
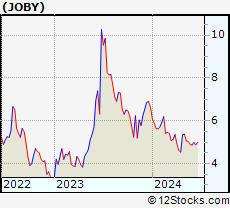 | JOBY Joby Aviation, Inc. |
| Sector: Industrials | |
| SubSector: Airports & Air Services | |
| MarketCap: 5810 Millions | |
| Recent Price: 5.04 Smart Investing & Trading Score: 10 | |
| Day Percent Change: 0.40% Day Change: 0.02 | |
| Week Change: -0.4% Year-to-date Change: -24.1% | |
| JOBY Links: Profile News Message Board | |
| Charts:- Daily , Weekly | |
| Add JOBY to Watchlist: View: Get Complete JOBY Trend Analysis ➞ | |
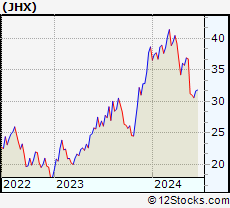 | JHX James Hardie Industries plc |
| Sector: Industrials | |
| SubSector: Cement | |
| MarketCap: 5521 Millions | |
| Recent Price: 36.76 Smart Investing & Trading Score: 40 | |
| Day Percent Change: -1.47% Day Change: -0.55 | |
| Week Change: -0.41% Year-to-date Change: -4.9% | |
| JHX Links: Profile News Message Board | |
| Charts:- Daily , Weekly | |
| Add JHX to Watchlist: View: Get Complete JHX Trend Analysis ➞ | |
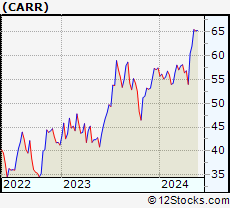 | CARR Carrier Global Corporation |
| Sector: Industrials | |
| SubSector: Building Products & Equipment | |
| MarketCap: 32547 Millions | |
| Recent Price: 65.23 Smart Investing & Trading Score: 69 | |
| Day Percent Change: 0.35% Day Change: 0.23 | |
| Week Change: -0.41% Year-to-date Change: 13.5% | |
| CARR Links: Profile News Message Board | |
| Charts:- Daily , Weekly | |
| Add CARR to Watchlist: View: Get Complete CARR Trend Analysis ➞ | |
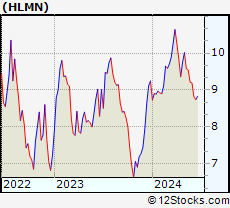 | HLMN Hillman Solutions Corp. |
| Sector: Industrials | |
| SubSector: Tools & Accessories | |
| MarketCap: 1720 Millions | |
| Recent Price: 9.54 Smart Investing & Trading Score: 0 | |
| Day Percent Change: 0.10% Day Change: 0.01 | |
| Week Change: -0.42% Year-to-date Change: 3.2% | |
| HLMN Links: Profile News Message Board | |
| Charts:- Daily , Weekly | |
| Add HLMN to Watchlist: View: Get Complete HLMN Trend Analysis ➞ | |
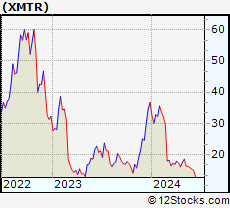 | XMTR Xometry, Inc. |
| Sector: Industrials | |
| SubSector: Specialty Industrial Machinery | |
| MarketCap: 1050 Millions | |
| Recent Price: 16.23 Smart Investing & Trading Score: 27 | |
| Day Percent Change: 4.91% Day Change: 0.76 | |
| Week Change: -0.43% Year-to-date Change: -55.8% | |
| XMTR Links: Profile News Message Board | |
| Charts:- Daily , Weekly | |
| Add XMTR to Watchlist: View: Get Complete XMTR Trend Analysis ➞ | |
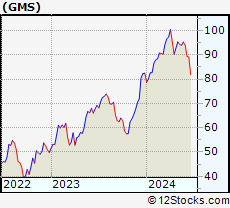 | GMS GMS Inc. |
| Sector: Industrials | |
| SubSector: General Building Materials | |
| MarketCap: 587.753 Millions | |
| Recent Price: 93.91 Smart Investing & Trading Score: 48 | |
| Day Percent Change: 0.66% Day Change: 0.62 | |
| Week Change: -0.45% Year-to-date Change: 13.9% | |
| GMS Links: Profile News Message Board | |
| Charts:- Daily , Weekly | |
| Add GMS to Watchlist: View: Get Complete GMS Trend Analysis ➞ | |
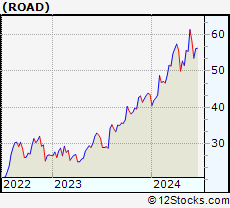 | ROAD Construction Partners, Inc. |
| Sector: Industrials | |
| SubSector: Heavy Construction | |
| MarketCap: 903.095 Millions | |
| Recent Price: 55.44 Smart Investing & Trading Score: 71 | |
| Day Percent Change: 1.17% Day Change: 0.64 | |
| Week Change: -0.45% Year-to-date Change: 27.4% | |
| ROAD Links: Profile News Message Board | |
| Charts:- Daily , Weekly | |
| Add ROAD to Watchlist: View: Get Complete ROAD Trend Analysis ➞ | |
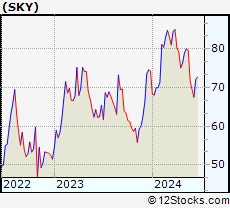 | SKY Skyline Champion Corporation |
| Sector: Industrials | |
| SubSector: Manufactured Housing | |
| MarketCap: 915.145 Millions | |
| Recent Price: 79.68 Smart Investing & Trading Score: 37 | |
| Day Percent Change: 0.20% Day Change: 0.16 | |
| Week Change: -0.47% Year-to-date Change: 7.3% | |
| SKY Links: Profile News Message Board | |
| Charts:- Daily , Weekly | |
| Add SKY to Watchlist: View: Get Complete SKY Trend Analysis ➞ | |
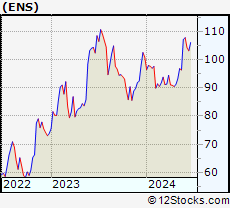 | ENS EnerSys |
| Sector: Industrials | |
| SubSector: Industrial Electrical Equipment | |
| MarketCap: 2068.79 Millions | |
| Recent Price: 96.37 Smart Investing & Trading Score: 68 | |
| Day Percent Change: -1.87% Day Change: -1.84 | |
| Week Change: -0.49% Year-to-date Change: -4.6% | |
| ENS Links: Profile News Message Board | |
| Charts:- Daily , Weekly | |
| Add ENS to Watchlist: View: Get Complete ENS Trend Analysis ➞ | |
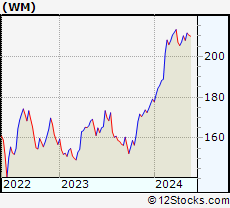 | WM Waste Management, Inc. |
| Sector: Industrials | |
| SubSector: Waste Management | |
| MarketCap: 46977.4 Millions | |
| Recent Price: 210.44 Smart Investing & Trading Score: 55 | |
| Day Percent Change: -0.83% Day Change: -1.76 | |
| Week Change: -0.5% Year-to-date Change: 17.5% | |
| WM Links: Profile News Message Board | |
| Charts:- Daily , Weekly | |
| Add WM to Watchlist: View: Get Complete WM Trend Analysis ➞ | |
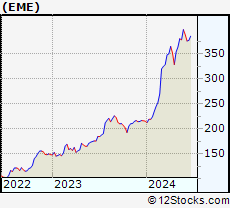 | EME EMCOR Group, Inc. |
| Sector: Industrials | |
| SubSector: General Contractors | |
| MarketCap: 3417.83 Millions | |
| Recent Price: 378.37 Smart Investing & Trading Score: 73 | |
| Day Percent Change: 0.74% Day Change: 2.78 | |
| Week Change: -0.5% Year-to-date Change: 75.6% | |
| EME Links: Profile News Message Board | |
| Charts:- Daily , Weekly | |
| Add EME to Watchlist: View: Get Complete EME Trend Analysis ➞ | |
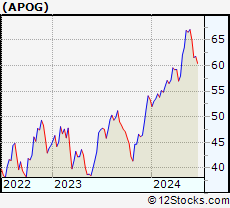 | APOG Apogee Enterprises, Inc. |
| Sector: Industrials | |
| SubSector: General Building Materials | |
| MarketCap: 510.653 Millions | |
| Recent Price: 66.54 Smart Investing & Trading Score: 76 | |
| Day Percent Change: 1.16% Day Change: 0.76 | |
| Week Change: -0.51% Year-to-date Change: 24.6% | |
| APOG Links: Profile News Message Board | |
| Charts:- Daily , Weekly | |
| Add APOG to Watchlist: View: Get Complete APOG Trend Analysis ➞ | |
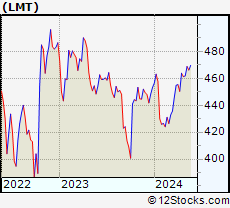 | LMT Lockheed Martin Corporation |
| Sector: Industrials | |
| SubSector: Aerospace/Defense Products & Services | |
| MarketCap: 94116.4 Millions | |
| Recent Price: 466.20 Smart Investing & Trading Score: 66 | |
| Day Percent Change: 0.29% Day Change: 1.37 | |
| Week Change: -0.57% Year-to-date Change: 2.9% | |
| LMT Links: Profile News Message Board | |
| Charts:- Daily , Weekly | |
| Add LMT to Watchlist: View: Get Complete LMT Trend Analysis ➞ | |
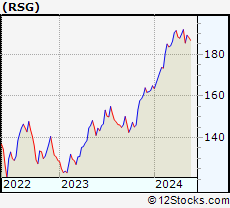 | RSG Republic Services, Inc. |
| Sector: Industrials | |
| SubSector: Waste Management | |
| MarketCap: 26178.6 Millions | |
| Recent Price: 188.16 Smart Investing & Trading Score: 51 | |
| Day Percent Change: 0.25% Day Change: 0.46 | |
| Week Change: -0.57% Year-to-date Change: 14.1% | |
| RSG Links: Profile News Message Board | |
| Charts:- Daily , Weekly | |
| Add RSG to Watchlist: View: Get Complete RSG Trend Analysis ➞ | |
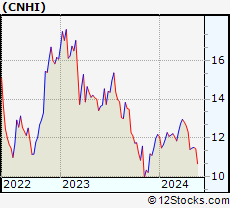 | CNHI CNH Industrial N.V. |
| Sector: Industrials | |
| SubSector: Farm & Construction Machinery | |
| MarketCap: 9366.57 Millions | |
| Recent Price: 11.45 Smart Investing & Trading Score: 32 | |
| Day Percent Change: -0.61% Day Change: -0.07 | |
| Week Change: -0.61% Year-to-date Change: -6.0% | |
| CNHI Links: Profile News Message Board | |
| Charts:- Daily , Weekly | |
| Add CNHI to Watchlist: View: Get Complete CNHI Trend Analysis ➞ | |
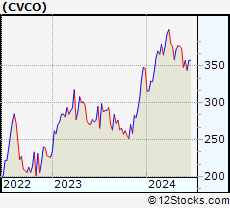 | CVCO Cavco Industries, Inc. |
| Sector: Industrials | |
| SubSector: Residential Construction | |
| MarketCap: 1375.86 Millions | |
| Recent Price: 374.21 Smart Investing & Trading Score: 35 | |
| Day Percent Change: 0.65% Day Change: 2.42 | |
| Week Change: -0.64% Year-to-date Change: 8.0% | |
| CVCO Links: Profile News Message Board | |
| Charts:- Daily , Weekly | |
| Add CVCO to Watchlist: View: Get Complete CVCO Trend Analysis ➞ | |
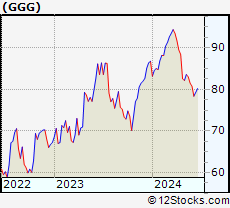 | GGG Graco Inc. |
| Sector: Industrials | |
| SubSector: Diversified Machinery | |
| MarketCap: 7739.76 Millions | |
| Recent Price: 83.02 Smart Investing & Trading Score: 37 | |
| Day Percent Change: -0.47% Day Change: -0.39 | |
| Week Change: -0.65% Year-to-date Change: -4.3% | |
| GGG Links: Profile News Message Board | |
| Charts:- Daily , Weekly | |
| Add GGG to Watchlist: View: Get Complete GGG Trend Analysis ➞ | |
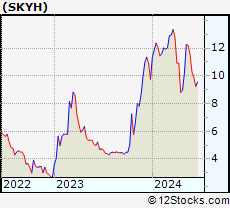 | SKYH Sky Harbour Group Corporation |
| Sector: Industrials | |
| SubSector: Aerospace & Defense | |
| MarketCap: 271 Millions | |
| Recent Price: 12.18 Smart Investing & Trading Score: 70 | |
| Day Percent Change: 1.50% Day Change: 0.18 | |
| Week Change: -0.65% Year-to-date Change: 25.1% | |
| SKYH Links: Profile News Message Board | |
| Charts:- Daily , Weekly | |
| Add SKYH to Watchlist: View: Get Complete SKYH Trend Analysis ➞ | |
| For tabular summary view of above stock list: Summary View ➞ 0 - 25 , 25 - 50 , 50 - 75 , 75 - 100 , 100 - 125 , 125 - 150 , 150 - 175 , 175 - 200 , 200 - 225 , 225 - 250 , 250 - 275 , 275 - 300 | ||
| Click To Change The Sort Order: By Market Cap or Company Size Performance: Year-to-date, Week and Day | |
| Select Chart Type: | ||
|
Best Stocks Today 12Stocks.com |
© 2024 12Stocks.com Terms & Conditions Privacy Contact Us
All Information Provided Only For Education And Not To Be Used For Investing or Trading. See Terms & Conditions


One More Thing ... Get Best Stocks Delivered Daily!
Never Ever Miss A Move With Our Top Ten Stocks Lists
Find Best Stocks In Any Market - Bull or Bear Market
Take A Peek At Our Top Ten Stocks Lists: Daily, Weekly, Year-to-Date & Top Trends
Find Best Stocks In Any Market - Bull or Bear Market
Take A Peek At Our Top Ten Stocks Lists: Daily, Weekly, Year-to-Date & Top Trends
Industrial Stocks With Best Up Trends [0-bearish to 100-bullish]: Enovix [100], RBC Bearings[100], Embraer S.A[100], Primoris Services[100], Himalaya Shipping[100], Steel Partners[100], Generac [100], General Dynamics[100], Select Energy[100], EHang [100], HEICO [100]
Best Industrial Stocks Year-to-Date:
Tutor Perini[116.26%], Intuitive Machines[111.52%], FTAI Infrastructure[109.25%], IES [101.91%], NuScale Power[95.66%], ZIM Integrated[93.79%], Powell Industries[78.87%], EMCOR [75.63%], Aspen Aerogels[70.69%], Caesarstone [70.59%], Redwire [70.53%] Best Industrial Stocks This Week:
Plug Power[26.95%], FuelCell Energy[19.63%], Embraer S.A[19.33%], Enovix [17.98%], Evolv Technologies[15.04%], Hertz Global[13.09%], Lilium N.V[12.96%], EHang [11.01%], PureCycle Technologies[10.54%], Astronics [10.23%], Montrose Environmental[9.34%] Best Industrial Stocks Daily:
Novonix [9.97%], Enovix [9.25%], RBC Bearings[7.11%], ESS Tech[5.46%], Amprius Technologies[5.38%], Freightos [4.95%], Xometry [4.91%], PureCycle Technologies[4.09%], MingZhu Logistics[3.79%], Eastern [3.67%], NuScale Power[3.61%]