
 Login Sign Up


| |||||
 |  | ||||

| 12Stocks.com Market Intelligence |
Best Industrial Stocks
| In a hurry? Industrial Stocks Lists: Performance Trends Table, Stock Charts
Sort Industrial stocks: Daily, Weekly, Year-to-Date, Market Cap & Trends. Filter Industrial stocks list by size:All Industrial Large Mid-Range Small |
| 12Stocks.com Industrial Stocks Performances & Trends Daily | |||||||||
|
|  The overall Smart Investing & Trading Score is 61 (0-bearish to 100-bullish) which puts Industrial sector in short term neutral to bullish trend. The Smart Investing & Trading Score from previous trading session is 88 and a deterioration of trend continues.
| ||||||||
Here are the Smart Investing & Trading Scores of the most requested Industrial stocks at 12Stocks.com (click stock name for detailed review):
|


| 12Stocks.com: Investing in Industrial sector with Stocks | |
|
The following table helps investors and traders sort through current performance and trends (as measured by Smart Investing & Trading Score) of various
stocks in the Industrial sector. Quick View: Move mouse or cursor over stock symbol (ticker) to view short-term Technical chart and over stock name to view long term chart. Click on  to add stock symbol to your watchlist and to add stock symbol to your watchlist and  to view watchlist. Click on any ticker or stock name for detailed market intelligence report for that stock. to view watchlist. Click on any ticker or stock name for detailed market intelligence report for that stock. |
12Stocks.com Performance of Stocks in Industrial Sector
| Ticker | Stock Name | Watchlist | Category | Recent Price | Smart Investing & Trading Score | Change % | Weekly Change% |
| AAON | AAON |   | Building Materials | 74.88 | 18 | 0.03% | -3.12% |
| SST | System1 | | Specialty | 1.55 | 22 | -1.27% | -3.13% |
| AWI | Armstrong World | | Building Materials | 113.87 | 0 | -0.36% | -3.17% |
| NNBR | NN | | Machine Tools | 3.33 | 10 | -5.93% | -3.20% |
| LOMA | Loma Negra | | Building Materials | 7.45 | 66 | -1.72% | -3.25% |
| BOOM | DMC Global | | Fabrication | 13.10 | 25 | 0.61% | -3.32% |
| MIDD | Middleby | | Machinery | 133.08 | 0 | 0.33% | -3.63% |
| MYRG | MYR | | Contractors | 154.82 | 32 | 1.98% | -3.66% |
| ASTE | Astec Industries | | Machinery | 33.49 | 17 | -0.18% | -3.82% |
| LLAP | Terran Orbital | | Aerospace & Defense | 1.00 | 37 | -0.99% | -3.85% |
| APT | Alpha Pro | | Building Materials | 4.93 | 18 | -1.89% | -3.90% |
| TILE | Interface | | Textile Industrial | 15.54 | 13 | -0.96% | -4.19% |
| LICY | Li-Cycle | | Waste Mgmt | 0.59 | 61 | -0.12% | -4.19% |
| REX | REX American | | Conglomerates | 56.60 | 38 | 0.44% | -4.34% |
| SSD | Simpson | | Small Tools & Accessories | 168.35 | 0 | -0.71% | -4.35% |
| CMI | Cummins | | Machinery | 285.56 | 43 | -0.80% | -4.37% |
| PHGE | BiomX | | Conglomerates | 0.34 | 41 | 2.64% | -4.46% |
| MEC | Mayville Engineering | | Fabrication | 15.50 | 68 | 0.19% | -4.56% |
| LECO | Loln Electric | | Small Tools & Accessories | 226.97 | 7 | -0.57% | -4.66% |
| NPK | National Presto | | Aerospace/Defense | 80.38 | 34 | -1.71% | -4.66% |
| EXP | Eagle Materials | | Cement | 256.30 | 34 | -0.74% | -4.77% |
| VMC | Vulcan Materials | | Building Materials | 259.10 | 0 | -0.35% | -4.77% |
| MLM | Martin Marietta | | Building Materials | 580.75 | 13 | -0.16% | -4.86% |
| TWI | Titan | | Machinery | 8.91 | 32 | -0.22% | -5.11% |
| AGCO | AGCO | | Machinery | 110.02 | 13 | -1.79% | -5.20% |
| For chart view version of above stock list: Chart View ➞ 0 - 25 , 25 - 50 , 50 - 75 , 75 - 100 , 100 - 125 , 125 - 150 , 150 - 175 , 175 - 200 , 200 - 225 , 225 - 250 , 250 - 275 , 275 - 300 | ||
 | Click To Change The Sort Order: By Market Cap or Company Size Performance: Year-to-date, Week and Day |  |
|
Get the most comprehensive stock market coverage daily at 12Stocks.com ➞ Best Stocks Today ➞ Best Stocks Weekly ➞ Best Stocks Year-to-Date ➞ Best Stocks Trends ➞  Best Stocks Today 12Stocks.com Best Nasdaq Stocks ➞ Best S&P 500 Stocks ➞ Best Tech Stocks ➞ Best Biotech Stocks ➞ |
| Detailed Overview of Industrial Stocks |
| Industrial Technical Overview, Leaders & Laggards, Top Industrial ETF Funds & Detailed Industrial Stocks List, Charts, Trends & More |
| Industrial Sector: Technical Analysis, Trends & YTD Performance | |
| Industrial sector is composed of stocks
from industrial machinery, aerospace, defense, farm/construction
and industrial services subsectors. Industrial sector, as represented by XLI, an exchange-traded fund [ETF] that holds basket of Industrial stocks (e.g, Caterpillar, Boeing) is up by 9.95% and is currently underperforming the overall market by -0.62% year-to-date. Below is a quick view of Technical charts and trends: |
|
 XLI Weekly Chart |
|
| Long Term Trend: Very Good | |
| Medium Term Trend: Good | |
 XLI Daily Chart |
|
| Short Term Trend: Good | |
| Overall Trend Score: 61 | |
| YTD Performance: 9.95% | |
| **Trend Scores & Views Are Only For Educational Purposes And Not For Investing | |
| 12Stocks.com: Top Performing Industrial Sector Stocks | ||||||||||||||||||||||||||||||||||||||||||||||||
 The top performing Industrial sector stocks year to date are
Now, more recently, over last week, the top performing Industrial sector stocks on the move are


|
||||||||||||||||||||||||||||||||||||||||||||||||
| 12Stocks.com: Investing in Industrial Sector using Exchange Traded Funds | |
|
The following table shows list of key exchange traded funds (ETF) that
help investors track Industrial Index. For detailed view, check out our ETF Funds section of our website. Quick View: Move mouse or cursor over ETF symbol (ticker) to view short-term Technical chart and over ETF name to view long term chart. Click on ticker or stock name for detailed view. Click on to add stock symbol to your watchlist and to view watchlist. |
12Stocks.com List of ETFs that track Industrial Index
| Ticker | ETF Name | Watchlist | Recent Price | Smart Investing & Trading Score | Change % | Week % | Year-to-date % |
| XLI | Industrial | | 125.33 | 61 | 0.11 | -0.28 | 9.95% |
| UXI | Industrials | | 33.88 | 61 | -0.39 | -0.94 | 17.67% |
| PPA | Aerospace & Defense | | 105.04 | 76 | 0.25 | 0.16 | 13.98% |
| ITA | Aerospace & Defense | | 135.50 | 83 | 0.41 | 0.3 | 7.03% |
| ITB | Home Construction | | 108.69 | 53 | 0.00 | 0.11 | 6.84% |
| XHB | Homebuilders | | 107.17 | 66 | 0.14 | -0.32 | 12.03% |
| SIJ | Short Industrials | | 9.53 | 35 | 0.18 | 0.99 | -15.99% |
| IYJ | Industrials | | 124.41 | 71 | 0.15 | -0.07 | 8.79% |
| EXI | Global Industrials | | 140.28 | 71 | -0.08 | -0.15 | 10.08% |
| VIS | Industrials | | 242.29 | 61 | 0.09 | -0.35 | 9.92% |
| PSCI | SmallCap Industrials | | 123.45 | 63 | -0.48 | -0.63 | 6.46% |
| XAR | Aerospace & Defense | | 143.28 | 76 | 0.07 | 0.77 | 5.8% |
| ARKQ | ARK Industrial Innovation | | 56.19 | 81 | 0.88 | 3.65 | -2.62% |
| 12Stocks.com: Charts, Trends, Fundamental Data and Performances of Industrial Stocks | |
|
We now take in-depth look at all Industrial stocks including charts, multi-period performances and overall trends (as measured by Smart Investing & Trading Score). One can sort Industrial stocks (click link to choose) by Daily, Weekly and by Year-to-Date performances. Also, one can sort by size of the company or by market capitalization. |
| Select Your Default Chart Type: | |||||
| |||||
| Click on stock symbol or name for detailed view. Click on to add stock symbol to your watchlist and to view watchlist. Quick View: Move mouse or cursor over "Daily" to quickly view daily Technical stock chart and over "Weekly" to view weekly Technical stock chart. | |||||

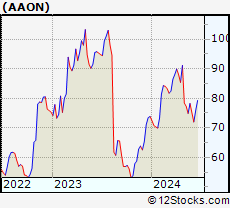 | AAON AAON, Inc. |
| Sector: Industrials | |
| SubSector: General Building Materials | |
| MarketCap: 2533.63 Millions | |
| Recent Price: 74.88 Smart Investing & Trading Score: 18 | |
| Day Percent Change: 0.03% Day Change: 0.02 | |
| Week Change: -3.12% Year-to-date Change: 1.4% | |
| AAON Links: Profile News Message Board | |
| Charts:- Daily , Weekly | |
| Add AAON to Watchlist: View: Get Complete AAON Trend Analysis ➞ | |
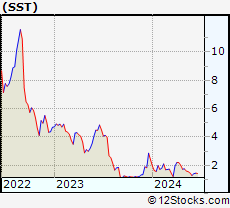 | SST System1, Inc. |
| Sector: Industrials | |
| SubSector: Specialty Business Services | |
| MarketCap: 504 Millions | |
| Recent Price: 1.55 Smart Investing & Trading Score: 22 | |
| Day Percent Change: -1.27% Day Change: -0.02 | |
| Week Change: -3.13% Year-to-date Change: -35.7% | |
| SST Links: Profile News Message Board | |
| Charts:- Daily , Weekly | |
| Add SST to Watchlist: View: Get Complete SST Trend Analysis ➞ | |
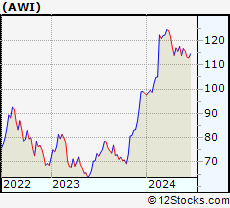 | AWI Armstrong World Industries, Inc. |
| Sector: Industrials | |
| SubSector: General Building Materials | |
| MarketCap: 3609.53 Millions | |
| Recent Price: 113.87 Smart Investing & Trading Score: 0 | |
| Day Percent Change: -0.36% Day Change: -0.41 | |
| Week Change: -3.17% Year-to-date Change: 15.8% | |
| AWI Links: Profile News Message Board | |
| Charts:- Daily , Weekly | |
| Add AWI to Watchlist: View: Get Complete AWI Trend Analysis ➞ | |
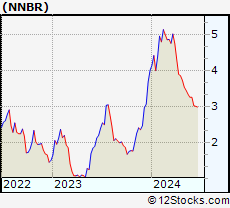 | NNBR NN, Inc. |
| Sector: Industrials | |
| SubSector: Machine Tools & Accessories | |
| MarketCap: 103.348 Millions | |
| Recent Price: 3.33 Smart Investing & Trading Score: 10 | |
| Day Percent Change: -5.93% Day Change: -0.21 | |
| Week Change: -3.2% Year-to-date Change: -16.8% | |
| NNBR Links: Profile News Message Board | |
| Charts:- Daily , Weekly | |
| Add NNBR to Watchlist: View: Get Complete NNBR Trend Analysis ➞ | |
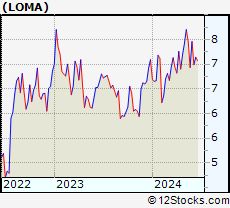 | LOMA Loma Negra Compania Industrial Argentina Sociedad Anonima |
| Sector: Industrials | |
| SubSector: General Building Materials | |
| MarketCap: 408.853 Millions | |
| Recent Price: 7.45 Smart Investing & Trading Score: 66 | |
| Day Percent Change: -1.72% Day Change: -0.13 | |
| Week Change: -3.25% Year-to-date Change: 5.1% | |
| LOMA Links: Profile News Message Board | |
| Charts:- Daily , Weekly | |
| Add LOMA to Watchlist: View: Get Complete LOMA Trend Analysis ➞ | |
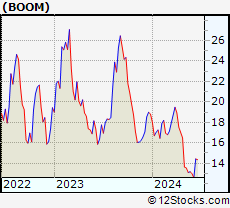 | BOOM DMC Global Inc. |
| Sector: Industrials | |
| SubSector: Metal Fabrication | |
| MarketCap: 359.15 Millions | |
| Recent Price: 13.10 Smart Investing & Trading Score: 25 | |
| Day Percent Change: 0.61% Day Change: 0.08 | |
| Week Change: -3.32% Year-to-date Change: -30.4% | |
| BOOM Links: Profile News Message Board | |
| Charts:- Daily , Weekly | |
| Add BOOM to Watchlist: View: Get Complete BOOM Trend Analysis ➞ | |
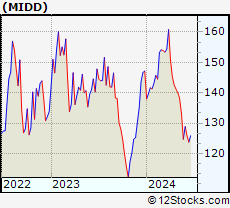 | MIDD The Middleby Corporation |
| Sector: Industrials | |
| SubSector: Diversified Machinery | |
| MarketCap: 3070.36 Millions | |
| Recent Price: 133.08 Smart Investing & Trading Score: 0 | |
| Day Percent Change: 0.33% Day Change: 0.44 | |
| Week Change: -3.63% Year-to-date Change: -9.6% | |
| MIDD Links: Profile News Message Board | |
| Charts:- Daily , Weekly | |
| Add MIDD to Watchlist: View: Get Complete MIDD Trend Analysis ➞ | |
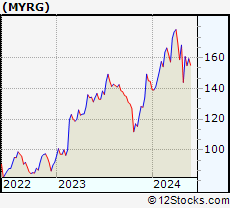 | MYRG MYR Group Inc. |
| Sector: Industrials | |
| SubSector: General Contractors | |
| MarketCap: 405.363 Millions | |
| Recent Price: 154.82 Smart Investing & Trading Score: 32 | |
| Day Percent Change: 1.98% Day Change: 3.00 | |
| Week Change: -3.66% Year-to-date Change: 7.1% | |
| MYRG Links: Profile News Message Board | |
| Charts:- Daily , Weekly | |
| Add MYRG to Watchlist: View: Get Complete MYRG Trend Analysis ➞ | |
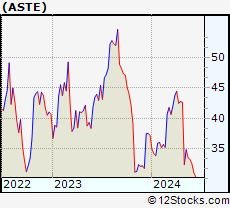 | ASTE Astec Industries, Inc. |
| Sector: Industrials | |
| SubSector: Farm & Construction Machinery | |
| MarketCap: 731.607 Millions | |
| Recent Price: 33.49 Smart Investing & Trading Score: 17 | |
| Day Percent Change: -0.18% Day Change: -0.06 | |
| Week Change: -3.82% Year-to-date Change: -10.0% | |
| ASTE Links: Profile News Message Board | |
| Charts:- Daily , Weekly | |
| Add ASTE to Watchlist: View: Get Complete ASTE Trend Analysis ➞ | |
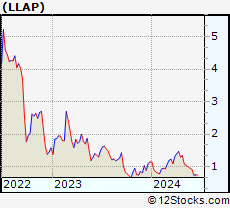 | LLAP Terran Orbital Corporation |
| Sector: Industrials | |
| SubSector: Aerospace & Defense | |
| MarketCap: 206 Millions | |
| Recent Price: 1.00 Smart Investing & Trading Score: 37 | |
| Day Percent Change: -0.99% Day Change: -0.01 | |
| Week Change: -3.85% Year-to-date Change: -12.7% | |
| LLAP Links: Profile News Message Board | |
| Charts:- Daily , Weekly | |
| Add LLAP to Watchlist: View: Get Complete LLAP Trend Analysis ➞ | |
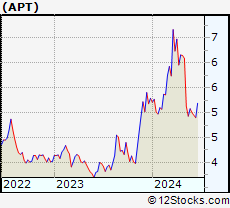 | APT Alpha Pro Tech, Ltd. |
| Sector: Industrials | |
| SubSector: General Building Materials | |
| MarketCap: 125.953 Millions | |
| Recent Price: 4.93 Smart Investing & Trading Score: 18 | |
| Day Percent Change: -1.89% Day Change: -0.10 | |
| Week Change: -3.9% Year-to-date Change: -6.8% | |
| APT Links: Profile News Message Board | |
| Charts:- Daily , Weekly | |
| Add APT to Watchlist: View: Get Complete APT Trend Analysis ➞ | |
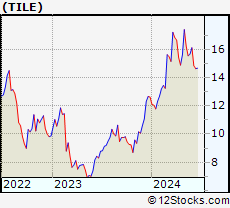 | TILE Interface, Inc. |
| Sector: Industrials | |
| SubSector: Textile Industrial | |
| MarketCap: 478 Millions | |
| Recent Price: 15.54 Smart Investing & Trading Score: 13 | |
| Day Percent Change: -0.96% Day Change: -0.15 | |
| Week Change: -4.19% Year-to-date Change: 23.1% | |
| TILE Links: Profile News Message Board | |
| Charts:- Daily , Weekly | |
| Add TILE to Watchlist: View: Get Complete TILE Trend Analysis ➞ | |
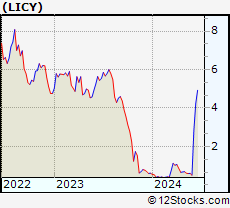 | LICY Li-Cycle Holdings Corp. |
| Sector: Industrials | |
| SubSector: Waste Management | |
| MarketCap: 959 Millions | |
| Recent Price: 0.59 Smart Investing & Trading Score: 61 | |
| Day Percent Change: -0.12% Day Change: 0.00 | |
| Week Change: -4.19% Year-to-date Change: -4.5% | |
| LICY Links: Profile News Message Board | |
| Charts:- Daily , Weekly | |
| Add LICY to Watchlist: View: Get Complete LICY Trend Analysis ➞ | |
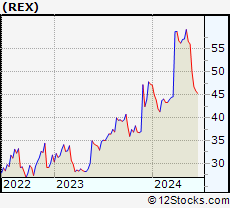 | REX REX American Resources Corporation |
| Sector: Industrials | |
| SubSector: Conglomerates | |
| MarketCap: 373.748 Millions | |
| Recent Price: 56.60 Smart Investing & Trading Score: 38 | |
| Day Percent Change: 0.44% Day Change: 0.25 | |
| Week Change: -4.34% Year-to-date Change: 19.7% | |
| REX Links: Profile News Message Board | |
| Charts:- Daily , Weekly | |
| Add REX to Watchlist: View: Get Complete REX Trend Analysis ➞ | |
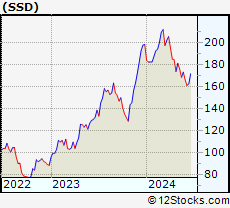 | SSD Simpson Manufacturing Co., Inc. |
| Sector: Industrials | |
| SubSector: Small Tools & Accessories | |
| MarketCap: 2850.16 Millions | |
| Recent Price: 168.35 Smart Investing & Trading Score: 0 | |
| Day Percent Change: -0.71% Day Change: -1.21 | |
| Week Change: -4.35% Year-to-date Change: -15.0% | |
| SSD Links: Profile News Message Board | |
| Charts:- Daily , Weekly | |
| Add SSD to Watchlist: View: Get Complete SSD Trend Analysis ➞ | |
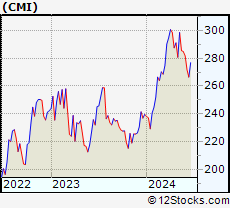 | CMI Cummins Inc. |
| Sector: Industrials | |
| SubSector: Diversified Machinery | |
| MarketCap: 19127.1 Millions | |
| Recent Price: 285.56 Smart Investing & Trading Score: 43 | |
| Day Percent Change: -0.80% Day Change: -2.29 | |
| Week Change: -4.37% Year-to-date Change: 19.2% | |
| CMI Links: Profile News Message Board | |
| Charts:- Daily , Weekly | |
| Add CMI to Watchlist: View: Get Complete CMI Trend Analysis ➞ | |
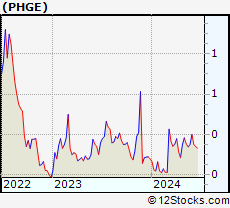 | PHGE BiomX Inc. |
| Sector: Industrials | |
| SubSector: Conglomerates | |
| MarketCap: 168.148 Millions | |
| Recent Price: 0.34 Smart Investing & Trading Score: 41 | |
| Day Percent Change: 2.64% Day Change: 0.01 | |
| Week Change: -4.46% Year-to-date Change: 21.0% | |
| PHGE Links: Profile News Message Board | |
| Charts:- Daily , Weekly | |
| Add PHGE to Watchlist: View: Get Complete PHGE Trend Analysis ➞ | |
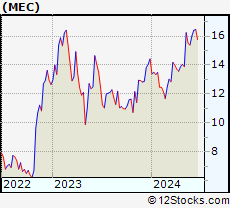 | MEC Mayville Engineering Company, Inc. |
| Sector: Industrials | |
| SubSector: Metal Fabrication | |
| MarketCap: 143.55 Millions | |
| Recent Price: 15.50 Smart Investing & Trading Score: 68 | |
| Day Percent Change: 0.19% Day Change: 0.03 | |
| Week Change: -4.56% Year-to-date Change: 7.5% | |
| MEC Links: Profile News Message Board | |
| Charts:- Daily , Weekly | |
| Add MEC to Watchlist: View: Get Complete MEC Trend Analysis ➞ | |
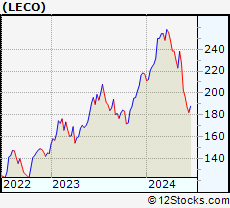 | LECO Lincoln Electric Holdings, Inc. |
| Sector: Industrials | |
| SubSector: Small Tools & Accessories | |
| MarketCap: 4085.06 Millions | |
| Recent Price: 226.97 Smart Investing & Trading Score: 7 | |
| Day Percent Change: -0.57% Day Change: -1.29 | |
| Week Change: -4.66% Year-to-date Change: 4.4% | |
| LECO Links: Profile News Message Board | |
| Charts:- Daily , Weekly | |
| Add LECO to Watchlist: View: Get Complete LECO Trend Analysis ➞ | |
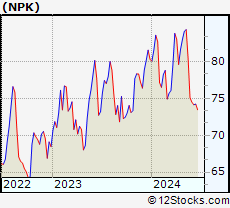 | NPK National Presto Industries, Inc. |
| Sector: Industrials | |
| SubSector: Aerospace/Defense Products & Services | |
| MarketCap: 540.401 Millions | |
| Recent Price: 80.38 Smart Investing & Trading Score: 34 | |
| Day Percent Change: -1.71% Day Change: -1.40 | |
| Week Change: -4.66% Year-to-date Change: 0.1% | |
| NPK Links: Profile News Message Board | |
| Charts:- Daily , Weekly | |
| Add NPK to Watchlist: View: Get Complete NPK Trend Analysis ➞ | |
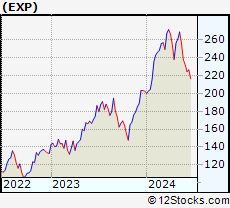 | EXP Eagle Materials Inc. |
| Sector: Industrials | |
| SubSector: Cement | |
| MarketCap: 2234.73 Millions | |
| Recent Price: 256.30 Smart Investing & Trading Score: 34 | |
| Day Percent Change: -0.74% Day Change: -1.90 | |
| Week Change: -4.77% Year-to-date Change: 26.4% | |
| EXP Links: Profile News Message Board | |
| Charts:- Daily , Weekly | |
| Add EXP to Watchlist: View: Get Complete EXP Trend Analysis ➞ | |
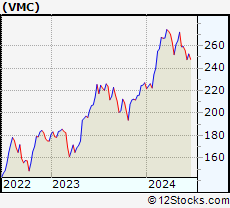 | VMC Vulcan Materials Company |
| Sector: Industrials | |
| SubSector: General Building Materials | |
| MarketCap: 12304.7 Millions | |
| Recent Price: 259.10 Smart Investing & Trading Score: 0 | |
| Day Percent Change: -0.35% Day Change: -0.90 | |
| Week Change: -4.77% Year-to-date Change: 14.1% | |
| VMC Links: Profile News Message Board | |
| Charts:- Daily , Weekly | |
| Add VMC to Watchlist: View: Get Complete VMC Trend Analysis ➞ | |
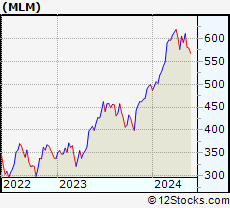 | MLM Martin Marietta Materials, Inc. |
| Sector: Industrials | |
| SubSector: General Building Materials | |
| MarketCap: 10624.3 Millions | |
| Recent Price: 580.75 Smart Investing & Trading Score: 13 | |
| Day Percent Change: -0.16% Day Change: -0.94 | |
| Week Change: -4.86% Year-to-date Change: 16.4% | |
| MLM Links: Profile News Message Board | |
| Charts:- Daily , Weekly | |
| Add MLM to Watchlist: View: Get Complete MLM Trend Analysis ➞ | |
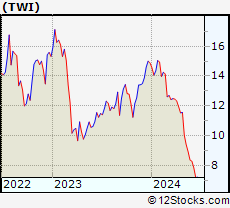 | TWI Titan International, Inc. |
| Sector: Industrials | |
| SubSector: Farm & Construction Machinery | |
| MarketCap: 104.607 Millions | |
| Recent Price: 8.91 Smart Investing & Trading Score: 32 | |
| Day Percent Change: -0.22% Day Change: -0.02 | |
| Week Change: -5.11% Year-to-date Change: -40.1% | |
| TWI Links: Profile News Message Board | |
| Charts:- Daily , Weekly | |
| Add TWI to Watchlist: View: Get Complete TWI Trend Analysis ➞ | |
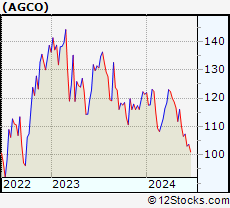 | AGCO AGCO Corporation |
| Sector: Industrials | |
| SubSector: Farm & Construction Machinery | |
| MarketCap: 3399.57 Millions | |
| Recent Price: 110.02 Smart Investing & Trading Score: 13 | |
| Day Percent Change: -1.79% Day Change: -2.01 | |
| Week Change: -5.2% Year-to-date Change: -9.4% | |
| AGCO Links: Profile News Message Board | |
| Charts:- Daily , Weekly | |
| Add AGCO to Watchlist: View: Get Complete AGCO Trend Analysis ➞ | |
| For tabular summary view of above stock list: Summary View ➞ 0 - 25 , 25 - 50 , 50 - 75 , 75 - 100 , 100 - 125 , 125 - 150 , 150 - 175 , 175 - 200 , 200 - 225 , 225 - 250 , 250 - 275 , 275 - 300 | ||
| Click To Change The Sort Order: By Market Cap or Company Size Performance: Year-to-date, Week and Day | |
| Select Chart Type: | ||
|
Best Stocks Today 12Stocks.com |
© 2024 12Stocks.com Terms & Conditions Privacy Contact Us
All Information Provided Only For Education And Not To Be Used For Investing or Trading. See Terms & Conditions


One More Thing ... Get Best Stocks Delivered Daily!
Never Ever Miss A Move With Our Top Ten Stocks Lists
Find Best Stocks In Any Market - Bull or Bear Market
Take A Peek At Our Top Ten Stocks Lists: Daily, Weekly, Year-to-Date & Top Trends
Find Best Stocks In Any Market - Bull or Bear Market
Take A Peek At Our Top Ten Stocks Lists: Daily, Weekly, Year-to-Date & Top Trends
Industrial Stocks With Best Up Trends [0-bearish to 100-bullish]: Enovix [100], RBC Bearings[100], Embraer S.A[100], Primoris Services[100], Himalaya Shipping[100], Steel Partners[100], Generac [100], General Dynamics[100], Select Energy[100], EHang [100], HEICO [100]
Best Industrial Stocks Year-to-Date:
Tutor Perini[116.26%], Intuitive Machines[111.52%], FTAI Infrastructure[109.25%], IES [101.91%], NuScale Power[95.66%], ZIM Integrated[93.79%], Powell Industries[78.87%], EMCOR [75.63%], Aspen Aerogels[70.69%], Caesarstone [70.59%], Redwire [70.53%] Best Industrial Stocks This Week:
Plug Power[26.95%], FuelCell Energy[19.63%], Embraer S.A[19.33%], Enovix [17.98%], Evolv Technologies[15.04%], Hertz Global[13.09%], Lilium N.V[12.96%], EHang [11.01%], PureCycle Technologies[10.54%], Astronics [10.23%], Montrose Environmental[9.34%] Best Industrial Stocks Daily:
Novonix [9.97%], Enovix [9.25%], RBC Bearings[7.11%], ESS Tech[5.46%], Amprius Technologies[5.38%], Freightos [4.95%], Xometry [4.91%], PureCycle Technologies[4.09%], MingZhu Logistics[3.79%], Eastern [3.67%], NuScale Power[3.61%]