
 Login Sign Up


| |||||
 |  | ||||

| 12Stocks.com Market Intelligence |
Best Consumer Services Stocks
| In a hurry? Services & Goods Stocks: Performance Trends Table, Stock Charts
Sort Consumer Services: Daily, Weekly, Year-to-Date, Market Cap & Trends. Filter Services & Goods stocks list by size: All Large Mid-Range Small |
| 12Stocks.com Consumer Services Stocks Performances & Trends Daily | |||||||||
|
|  The overall Smart Investing & Trading Score is 40 (0-bearish to 100-bullish) which puts Consumer Services sector in short term bearish to neutral trend. The Smart Investing & Trading Score from previous trading session is 47 and a deterioration of trend continues.
| ||||||||
Here are the Smart Investing & Trading Scores of the most requested Consumer Services stocks at 12Stocks.com (click stock name for detailed review):
|


| Consider signing up for our daily 12Stocks.com "Best Stocks Newsletter". You will never ever miss a big stock move again! |
| 12Stocks.com: Investing in Consumer Services sector with Stocks | |
|
The following table helps investors and traders sort through current performance and trends (as measured by Smart Investing & Trading Score) of various
stocks in the Consumer Services sector. Quick View: Move mouse or cursor over stock symbol (ticker) to view short-term Technical chart and over stock name to view long term chart. Click on  to add stock symbol to your watchlist and to add stock symbol to your watchlist and  to view watchlist. Click on any ticker or stock name for detailed market intelligence report for that stock. to view watchlist. Click on any ticker or stock name for detailed market intelligence report for that stock. |
12Stocks.com Performance of Stocks in Consumer Services Sector
| Ticker | Stock Name | Watchlist | Category | Recent Price | Smart Investing & Trading Score | Change % | Weekly Change% |
| TSQ | Townsquare Media |   | Broadcasting | 11.55 | 49 | 0.17% | -5.17% |
| ASO | Academy Sports | | Specialty Retail | 53.71 | 0 | -1.25% | -5.27% |
| RGS | Regis | | Services | 6.25 | 32 | -0.78% | -5.30% |
| SIX | Six Flags | | Entertainment | 25.73 | 68 | -1.15% | -5.54% |
| COOK | Traeger | | Furnishings, Fixtures & Appliances | 2.20 | 20 | -3.93% | -5.58% |
| MCS | Marcus | | Entertainment | 10.90 | 0 | -1.71% | -5.63% |
| BH | Biglari | | Restaurants | 200.00 | 43 | -7.32% | -5.66% |
| PRAA | PRA | | Services | 24.96 | 32 | -0.40% | -5.67% |
| OLLI | Ollie s | | Retail | 73.36 | 8 | -0.20% | -5.76% |
| ARCO | Arcos Dorados | | Restaurants | 10.45 | 0 | -0.10% | -5.94% |
| SEAT | Vivid Seats | | Internet Content & Information | 5.17 | 0 | -1.71% | -6.00% |
| LE | Lands | | Retail | 14.03 | 59 | -0.28% | -6.22% |
| GGR | Gogoro | | Auto Parts | 1.50 | 20 | 2.04% | -6.25% |
| CHGG | Chegg | | Education | 4.38 | 10 | -4.78% | -6.41% |
| LI | Li Auto | | Auto Manufacturers | 24.89 | 8 | -1.19% | -6.74% |
| AUVI | Applied UV | | Furnishings, Fixtures & Appliances | 0.57 | 25 | -3.32% | -7.04% |
| NL | NL Industries | | Equipment | 7.27 | 68 | 4.01% | -7.74% |
| DIBS | 1stdibs.Com | | Internet Retail | 5.58 | 38 | -3.79% | -7.77% |
| ECX | ECARX | | Auto Parts | 1.48 | 20 | -8.07% | -8.07% |
| BGSF | BG Staffing | | Staffing | 6.99 | 10 | 1.16% | -8.27% |
| IHRT | iHeartMedia | | Broadcasting | 1.21 | 10 | -6.20% | -8.33% |
| MG | Mistras | | Security | 8.38 | 17 | 0.48% | -8.42% |
| MCW | Mister Car | | Services | 7.13 | 30 | -4.04% | -8.82% |
| FWRG | First Watch | | Restaurants | 18.93 | 10 | -1.61% | -9.60% |
| VRM | Vroom | | Auto & Truck Dealerships | 11.17 | 12 | -4.28% | -9.92% |
| For chart view version of above stock list: Chart View ➞ 0 - 25 , 25 - 50 , 50 - 75 , 75 - 100 , 100 - 125 , 125 - 150 , 150 - 175 , 175 - 200 , 200 - 225 , 225 - 250 , 250 - 275 , 275 - 300 , 300 - 325 , 325 - 350 , 350 - 375 , 375 - 400 , 400 - 425 , 425 - 450 , 450 - 475 | ||
 | Click To Change The Sort Order: By Market Cap or Company Size Performance: Year-to-date, Week and Day |  |
|
Get the most comprehensive stock market coverage daily at 12Stocks.com ➞ Best Stocks Today ➞ Best Stocks Weekly ➞ Best Stocks Year-to-Date ➞ Best Stocks Trends ➞  Best Stocks Today 12Stocks.com Best Nasdaq Stocks ➞ Best S&P 500 Stocks ➞ Best Tech Stocks ➞ Best Biotech Stocks ➞ |
| Detailed Overview of Consumer Services Stocks |
| Consumer Services Technical Overview, Leaders & Laggards, Top Consumer Services ETF Funds & Detailed Consumer Services Stocks List, Charts, Trends & More |
| Consumer Services Sector: Technical Analysis, Trends & YTD Performance | |
| Consumer Services sector is composed of stocks
from retail, entertainment, media/publishing, consumer goods
and services subsectors. Consumer Services sector, as represented by XLY, an exchange-traded fund [ETF] that holds basket of Consumer Services stocks (e.g, Walmart, Alibaba) is down by -0.06% and is currently underperforming the overall market by -10.63% year-to-date. Below is a quick view of Technical charts and trends: |
|
 XLY Weekly Chart |
|
| Long Term Trend: Not Good | |
| Medium Term Trend: Very Good | |
 XLY Daily Chart |
|
| Short Term Trend: Good | |
| Overall Trend Score: 40 | |
| YTD Performance: -0.06% | |
| **Trend Scores & Views Are Only For Educational Purposes And Not For Investing | |
| 12Stocks.com: Top Performing Consumer Services Sector Stocks | ||||||||||||||||||||||||||||||||||||||||||||||||
 The top performing Consumer Services sector stocks year to date are
Now, more recently, over last week, the top performing Consumer Services sector stocks on the move are


|
||||||||||||||||||||||||||||||||||||||||||||||||
| 12Stocks.com: Investing in Consumer Services Sector using Exchange Traded Funds | |
|
The following table shows list of key exchange traded funds (ETF) that
help investors track Consumer Services Index. For detailed view, check out our ETF Funds section of our website. Quick View: Move mouse or cursor over ETF symbol (ticker) to view short-term Technical chart and over ETF name to view long term chart. Click on ticker or stock name for detailed view. Click on to add stock symbol to your watchlist and to view watchlist. |
12Stocks.com List of ETFs that track Consumer Services Index
| Ticker | ETF Name | Watchlist | Recent Price | Smart Investing & Trading Score | Change % | Week % | Year-to-date % |
| XLY | Consumer Discret Sel | | 178.70 | 40 | 0.51 | 0.34 | -0.06% |
| RTH | Retail | | 204.39 | 70 | 0.17 | 0.41 | 8.59% |
| IYC | Consumer Services | | 80.00 | 45 | 0.26 | 0.49 | 5.58% |
| XRT | Retail | | 75.93 | 37 | -0.78 | 2.08 | 4.99% |
| IYK | Consumer Goods | | 68.05 | 76 | -0.29 | 0.16 | 6.49% |
| UCC | Consumer Services | | 34.67 | 40 | 0.35 | 0.26 | -3.45% |
| RETL | Retail Bull 3X | | 9.64 | 37 | -2.63 | 5.47 | 5.7% |
| RXI | Globl Consumer Discretionary | | 164.60 | 57 | 0.50 | 0.99 | 3.48% |
| SCC | Short Consumer Services | | 15.33 | 54 | -0.65 | -0.39 | 0.04% |
| UGE | Consumer Goods | | 18.22 | 93 | -0.94 | 1.11 | 15.73% |
| 12Stocks.com: Charts, Trends, Fundamental Data and Performances of Consumer Services Stocks | |
|
We now take in-depth look at all Consumer Services stocks including charts, multi-period performances and overall trends (as measured by Smart Investing & Trading Score). One can sort Consumer Services stocks (click link to choose) by Daily, Weekly and by Year-to-Date performances. Also, one can sort by size of the company or by market capitalization. |
| Select Your Default Chart Type: | |||||
| |||||
| Click on stock symbol or name for detailed view. Click on to add stock symbol to your watchlist and to view watchlist. Quick View: Move mouse or cursor over "Daily" to quickly view daily Technical stock chart and over "Weekly" to view weekly Technical stock chart. | |||||

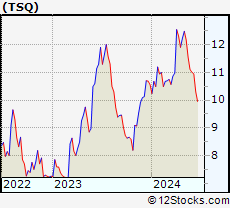 | TSQ Townsquare Media, Inc. |
| Sector: Services & Goods | |
| SubSector: Broadcasting - Radio | |
| MarketCap: 101.795 Millions | |
| Recent Price: 11.55 Smart Investing & Trading Score: 49 | |
| Day Percent Change: 0.17% Day Change: 0.02 | |
| Week Change: -5.17% Year-to-date Change: 9.4% | |
| TSQ Links: Profile News Message Board | |
| Charts:- Daily , Weekly | |
| Add TSQ to Watchlist: View: Get Complete TSQ Trend Analysis ➞ | |
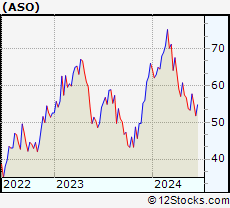 | ASO Academy Sports and Outdoors, Inc. |
| Sector: Services & Goods | |
| SubSector: Specialty Retail | |
| MarketCap: 16027 Millions | |
| Recent Price: 53.71 Smart Investing & Trading Score: 0 | |
| Day Percent Change: -1.25% Day Change: -0.68 | |
| Week Change: -5.27% Year-to-date Change: -18.6% | |
| ASO Links: Profile News Message Board | |
| Charts:- Daily , Weekly | |
| Add ASO to Watchlist: View: Get Complete ASO Trend Analysis ➞ | |
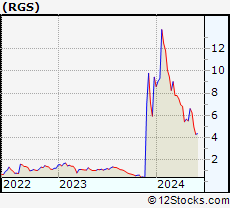 | RGS Regis Corporation |
| Sector: Services & Goods | |
| SubSector: Personal Services | |
| MarketCap: 234.625 Millions | |
| Recent Price: 6.25 Smart Investing & Trading Score: 32 | |
| Day Percent Change: -0.78% Day Change: -0.05 | |
| Week Change: -5.3% Year-to-date Change: -33.9% | |
| RGS Links: Profile News Message Board | |
| Charts:- Daily , Weekly | |
| Add RGS to Watchlist: View: Get Complete RGS Trend Analysis ➞ | |
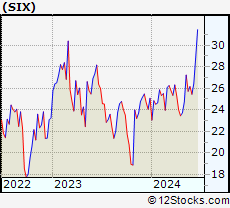 | SIX Six Flags Entertainment Corporation |
| Sector: Services & Goods | |
| SubSector: General Entertainment | |
| MarketCap: 1282.69 Millions | |
| Recent Price: 25.73 Smart Investing & Trading Score: 68 | |
| Day Percent Change: -1.15% Day Change: -0.30 | |
| Week Change: -5.54% Year-to-date Change: 2.6% | |
| SIX Links: Profile News Message Board | |
| Charts:- Daily , Weekly | |
| Add SIX to Watchlist: View: Get Complete SIX Trend Analysis ➞ | |
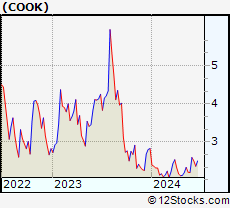 | COOK Traeger, Inc. |
| Sector: Services & Goods | |
| SubSector: Furnishings, Fixtures & Appliances | |
| MarketCap: 524 Millions | |
| Recent Price: 2.20 Smart Investing & Trading Score: 20 | |
| Day Percent Change: -3.93% Day Change: -0.09 | |
| Week Change: -5.58% Year-to-date Change: -22.1% | |
| COOK Links: Profile News Message Board | |
| Charts:- Daily , Weekly | |
| Add COOK to Watchlist: View: Get Complete COOK Trend Analysis ➞ | |
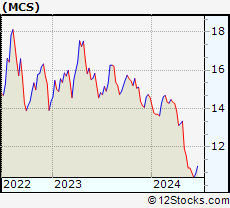 | MCS The Marcus Corporation |
| Sector: Services & Goods | |
| SubSector: Entertainment - Diversified | |
| MarketCap: 441.437 Millions | |
| Recent Price: 10.90 Smart Investing & Trading Score: 0 | |
| Day Percent Change: -1.71% Day Change: -0.19 | |
| Week Change: -5.63% Year-to-date Change: -25.2% | |
| MCS Links: Profile News Message Board | |
| Charts:- Daily , Weekly | |
| Add MCS to Watchlist: View: Get Complete MCS Trend Analysis ➞ | |
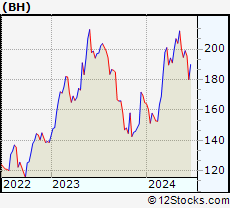 | BH Biglari Holdings Inc. |
| Sector: Services & Goods | |
| SubSector: Restaurants | |
| MarketCap: 149.07 Millions | |
| Recent Price: 200.00 Smart Investing & Trading Score: 43 | |
| Day Percent Change: -7.32% Day Change: -15.80 | |
| Week Change: -5.66% Year-to-date Change: 21.3% | |
| BH Links: Profile News Message Board | |
| Charts:- Daily , Weekly | |
| Add BH to Watchlist: View: Get Complete BH Trend Analysis ➞ | |
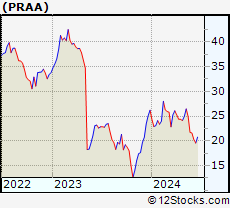 | PRAA PRA Group, Inc. |
| Sector: Services & Goods | |
| SubSector: Business Services | |
| MarketCap: 1290.32 Millions | |
| Recent Price: 24.96 Smart Investing & Trading Score: 32 | |
| Day Percent Change: -0.40% Day Change: -0.10 | |
| Week Change: -5.67% Year-to-date Change: -4.7% | |
| PRAA Links: Profile News Message Board | |
| Charts:- Daily , Weekly | |
| Add PRAA to Watchlist: View: Get Complete PRAA Trend Analysis ➞ | |
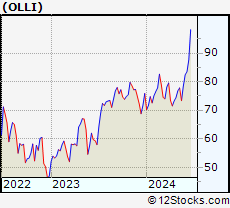 | OLLI Ollie s Bargain Outlet Holdings, Inc. |
| Sector: Services & Goods | |
| SubSector: Discount, Variety Stores | |
| MarketCap: 2904.62 Millions | |
| Recent Price: 73.36 Smart Investing & Trading Score: 8 | |
| Day Percent Change: -0.20% Day Change: -0.15 | |
| Week Change: -5.76% Year-to-date Change: -3.3% | |
| OLLI Links: Profile News Message Board | |
| Charts:- Daily , Weekly | |
| Add OLLI to Watchlist: View: Get Complete OLLI Trend Analysis ➞ | |
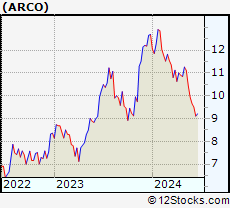 | ARCO Arcos Dorados Holdings Inc. |
| Sector: Services & Goods | |
| SubSector: Restaurants | |
| MarketCap: 778.87 Millions | |
| Recent Price: 10.45 Smart Investing & Trading Score: 0 | |
| Day Percent Change: -0.10% Day Change: -0.01 | |
| Week Change: -5.94% Year-to-date Change: -17.7% | |
| ARCO Links: Profile News Message Board | |
| Charts:- Daily , Weekly | |
| Add ARCO to Watchlist: View: Get Complete ARCO Trend Analysis ➞ | |
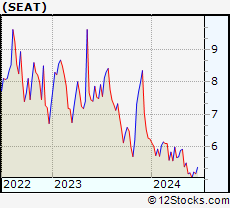 | SEAT Vivid Seats Inc. |
| Sector: Services & Goods | |
| SubSector: Internet Content & Information | |
| MarketCap: 1560 Millions | |
| Recent Price: 5.17 Smart Investing & Trading Score: 0 | |
| Day Percent Change: -1.71% Day Change: -0.09 | |
| Week Change: -6% Year-to-date Change: -17.2% | |
| SEAT Links: Profile News Message Board | |
| Charts:- Daily , Weekly | |
| Add SEAT to Watchlist: View: Get Complete SEAT Trend Analysis ➞ | |
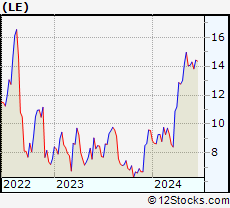 | LE Lands End, Inc. |
| Sector: Services & Goods | |
| SubSector: Catalog & Mail Order Houses | |
| MarketCap: 268.692 Millions | |
| Recent Price: 14.03 Smart Investing & Trading Score: 59 | |
| Day Percent Change: -0.28% Day Change: -0.04 | |
| Week Change: -6.22% Year-to-date Change: 46.8% | |
| LE Links: Profile News Message Board | |
| Charts:- Daily , Weekly | |
| Add LE to Watchlist: View: Get Complete LE Trend Analysis ➞ | |
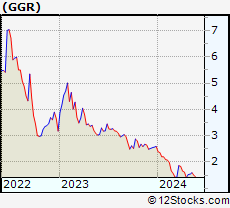 | GGR Gogoro Inc. |
| Sector: Services & Goods | |
| SubSector: Auto Parts | |
| MarketCap: 856 Millions | |
| Recent Price: 1.50 Smart Investing & Trading Score: 20 | |
| Day Percent Change: 2.04% Day Change: 0.03 | |
| Week Change: -6.25% Year-to-date Change: -42.3% | |
| GGR Links: Profile News Message Board | |
| Charts:- Daily , Weekly | |
| Add GGR to Watchlist: View: Get Complete GGR Trend Analysis ➞ | |
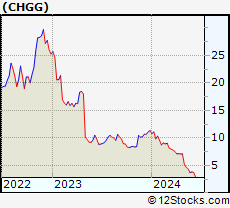 | CHGG Chegg, Inc. |
| Sector: Services & Goods | |
| SubSector: Education & Training Services | |
| MarketCap: 3606.86 Millions | |
| Recent Price: 4.38 Smart Investing & Trading Score: 10 | |
| Day Percent Change: -4.78% Day Change: -0.22 | |
| Week Change: -6.41% Year-to-date Change: -61.4% | |
| CHGG Links: Profile News Message Board | |
| Charts:- Daily , Weekly | |
| Add CHGG to Watchlist: View: Get Complete CHGG Trend Analysis ➞ | |
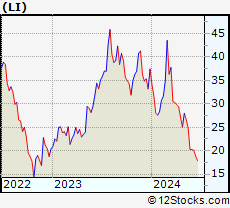 | LI Li Auto Inc. |
| Sector: Services & Goods | |
| SubSector: Auto Manufacturers | |
| MarketCap: 29167 Millions | |
| Recent Price: 24.89 Smart Investing & Trading Score: 8 | |
| Day Percent Change: -1.19% Day Change: -0.30 | |
| Week Change: -6.74% Year-to-date Change: -33.5% | |
| LI Links: Profile News Message Board | |
| Charts:- Daily , Weekly | |
| Add LI to Watchlist: View: Get Complete LI Trend Analysis ➞ | |
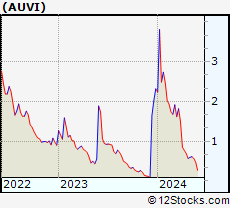 | AUVI Applied UV, Inc. |
| Sector: Services & Goods | |
| SubSector: Furnishings, Fixtures & Appliances | |
| MarketCap: 49027 Millions | |
| Recent Price: 0.57 Smart Investing & Trading Score: 25 | |
| Day Percent Change: -3.32% Day Change: -0.02 | |
| Week Change: -7.04% Year-to-date Change: -75.4% | |
| AUVI Links: Profile News Message Board | |
| Charts:- Daily , Weekly | |
| Add AUVI to Watchlist: View: Get Complete AUVI Trend Analysis ➞ | |
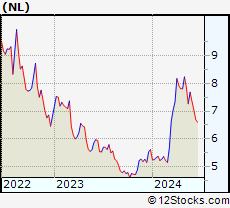 | NL NL Industries, Inc. |
| Sector: Services & Goods | |
| SubSector: Industrial Equipment Wholesale | |
| MarketCap: 126.258 Millions | |
| Recent Price: 7.27 Smart Investing & Trading Score: 68 | |
| Day Percent Change: 4.01% Day Change: 0.28 | |
| Week Change: -7.74% Year-to-date Change: 29.6% | |
| NL Links: Profile News Message Board | |
| Charts:- Daily , Weekly | |
| Add NL to Watchlist: View: Get Complete NL Trend Analysis ➞ | |
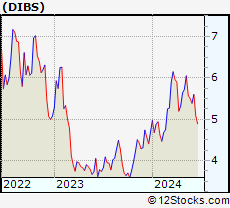 | DIBS 1stdibs.Com, Inc. |
| Sector: Services & Goods | |
| SubSector: Internet Retail | |
| MarketCap: 149 Millions | |
| Recent Price: 5.58 Smart Investing & Trading Score: 38 | |
| Day Percent Change: -3.79% Day Change: -0.22 | |
| Week Change: -7.77% Year-to-date Change: 19.0% | |
| DIBS Links: Profile News Message Board | |
| Charts:- Daily , Weekly | |
| Add DIBS to Watchlist: View: Get Complete DIBS Trend Analysis ➞ | |
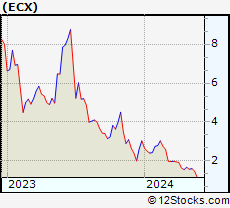 | ECX ECARX Holdings Inc. |
| Sector: Services & Goods | |
| SubSector: Auto Parts | |
| MarketCap: 2270 Millions | |
| Recent Price: 1.48 Smart Investing & Trading Score: 20 | |
| Day Percent Change: -8.07% Day Change: -0.13 | |
| Week Change: -8.07% Year-to-date Change: -51.2% | |
| ECX Links: Profile News Message Board | |
| Charts:- Daily , Weekly | |
| Add ECX to Watchlist: View: Get Complete ECX Trend Analysis ➞ | |
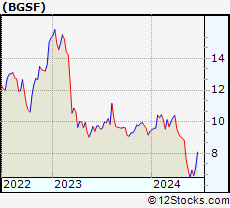 | BGSF BG Staffing, Inc. |
| Sector: Services & Goods | |
| SubSector: Staffing & Outsourcing Services | |
| MarketCap: 111.728 Millions | |
| Recent Price: 6.99 Smart Investing & Trading Score: 10 | |
| Day Percent Change: 1.16% Day Change: 0.08 | |
| Week Change: -8.27% Year-to-date Change: -25.6% | |
| BGSF Links: Profile News Message Board | |
| Charts:- Daily , Weekly | |
| Add BGSF to Watchlist: View: Get Complete BGSF Trend Analysis ➞ | |
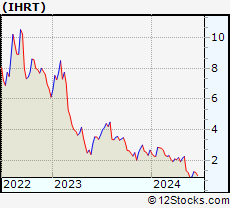 | IHRT iHeartMedia, Inc. |
| Sector: Services & Goods | |
| SubSector: Broadcasting - Radio | |
| MarketCap: 694 Millions | |
| Recent Price: 1.21 Smart Investing & Trading Score: 10 | |
| Day Percent Change: -6.20% Day Change: -0.08 | |
| Week Change: -8.33% Year-to-date Change: -54.7% | |
| IHRT Links: Profile News Message Board | |
| Charts:- Daily , Weekly | |
| Add IHRT to Watchlist: View: Get Complete IHRT Trend Analysis ➞ | |
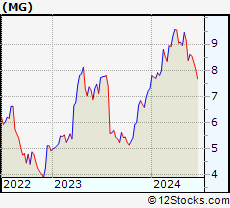 | MG Mistras Group, Inc. |
| Sector: Services & Goods | |
| SubSector: Security & Protection Services | |
| MarketCap: 136.903 Millions | |
| Recent Price: 8.38 Smart Investing & Trading Score: 17 | |
| Day Percent Change: 0.48% Day Change: 0.04 | |
| Week Change: -8.42% Year-to-date Change: 14.5% | |
| MG Links: Profile News Message Board | |
| Charts:- Daily , Weekly | |
| Add MG to Watchlist: View: Get Complete MG Trend Analysis ➞ | |
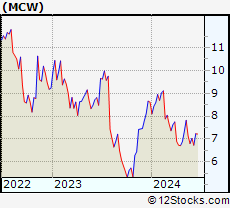 | MCW Mister Car Wash, Inc. |
| Sector: Services & Goods | |
| SubSector: Personal Services | |
| MarketCap: 2790 Millions | |
| Recent Price: 7.13 Smart Investing & Trading Score: 30 | |
| Day Percent Change: -4.04% Day Change: -0.30 | |
| Week Change: -8.82% Year-to-date Change: -17.2% | |
| MCW Links: Profile News Message Board | |
| Charts:- Daily , Weekly | |
| Add MCW to Watchlist: View: Get Complete MCW Trend Analysis ➞ | |
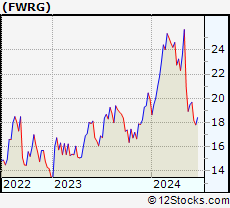 | FWRG First Watch Restaurant Group, Inc. |
| Sector: Services & Goods | |
| SubSector: Restaurants | |
| MarketCap: 1000 Millions | |
| Recent Price: 18.93 Smart Investing & Trading Score: 10 | |
| Day Percent Change: -1.61% Day Change: -0.31 | |
| Week Change: -9.6% Year-to-date Change: -5.0% | |
| FWRG Links: Profile News Message Board | |
| Charts:- Daily , Weekly | |
| Add FWRG to Watchlist: View: Get Complete FWRG Trend Analysis ➞ | |
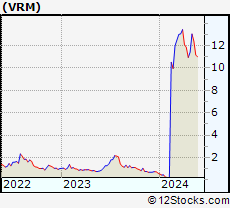 | VRM Vroom, Inc. |
| Sector: Services & Goods | |
| SubSector: Auto & Truck Dealerships | |
| MarketCap: 44327 Millions | |
| Recent Price: 11.17 Smart Investing & Trading Score: 12 | |
| Day Percent Change: -4.28% Day Change: -0.50 | |
| Week Change: -9.92% Year-to-date Change: 1,751.5% | |
| VRM Links: Profile News Message Board | |
| Charts:- Daily , Weekly | |
| Add VRM to Watchlist: View: Get Complete VRM Trend Analysis ➞ | |
| For tabular summary view of above stock list: Summary View ➞ 0 - 25 , 25 - 50 , 50 - 75 , 75 - 100 , 100 - 125 , 125 - 150 , 150 - 175 , 175 - 200 , 200 - 225 , 225 - 250 , 250 - 275 , 275 - 300 , 300 - 325 , 325 - 350 , 350 - 375 , 375 - 400 , 400 - 425 , 425 - 450 , 450 - 475 | ||
| Click To Change The Sort Order: By Market Cap or Company Size Performance: Year-to-date, Week and Day | |
| Select Chart Type: | ||
|
Best Stocks Today 12Stocks.com |
© 2024 12Stocks.com Terms & Conditions Privacy Contact Us
All Information Provided Only For Education And Not To Be Used For Investing or Trading. See Terms & Conditions


One More Thing ... Get Best Stocks Delivered Daily!
Never Ever Miss A Move With Our Top Ten Stocks Lists
Find Best Stocks In Any Market - Bull or Bear Market
Take A Peek At Our Top Ten Stocks Lists: Daily, Weekly, Year-to-Date & Top Trends
Find Best Stocks In Any Market - Bull or Bear Market
Take A Peek At Our Top Ten Stocks Lists: Daily, Weekly, Year-to-Date & Top Trends
Consumer Services Stocks With Best Up Trends [0-bearish to 100-bullish]: Despegar.com [100], Boqii Holding[100], Gannett Co[100], Littelfuse [100], On Holding[100], Tractor Supply[100], Outbrain [100], Super [100], Kratos Defense[100], Alibaba [100], MakeMyTrip [100]
Best Consumer Services Stocks Year-to-Date:
U Power[3454.69%], Vroom [1751.48%], Yatsen Holding[515.09%], Fluent [432.84%], Zhihu [349.45%], Faraday Future[346.47%], Codere Online[183.9%], Sweetgreen [180.97%], Research[155.08%], Carvana Co[121.95%], Smart Share[121.36%] Best Consumer Services Stocks This Week:
Faraday Future[2134.27%], AMC Entertainment[51.2%], Petco Health[50%], HUYA [36.36%], Allbirds [28.4%], GameStop [27.21%], On Holding[25.39%], MOGU [24.34%], EVgo [22.58%], Despegar.com [22.06%], U Power[20.64%] Best Consumer Services Stocks Daily:
Despegar.com [19.14%], Golden Heaven[16.00%], Cumulus Media[10.92%], Zhihu [8.42%], Boqii Holding[7.35%], Yunji [6.10%], Dada Nexus[6.04%], CompX [5.17%], Qurate Retail[5.06%], Gannett Co[4.79%], Research[4.61%]