
 Login Sign Up


| |||||
 |  | ||||

| 12Stocks.com Market Intelligence |
Best Consumer Services Stocks
| In a hurry? Services & Goods Stocks: Performance Trends Table, Stock Charts
Sort Consumer Services: Daily, Weekly, Year-to-Date, Market Cap & Trends. Filter Services & Goods stocks list by size: All Large Mid-Range Small |
| 12Stocks.com Consumer Services Stocks Performances & Trends Daily | |||||||||
|
|  The overall Smart Investing & Trading Score is 40 (0-bearish to 100-bullish) which puts Consumer Services sector in short term bearish to neutral trend. The Smart Investing & Trading Score from previous trading session is 47 and a deterioration of trend continues.
| ||||||||
Here are the Smart Investing & Trading Scores of the most requested Consumer Services stocks at 12Stocks.com (click stock name for detailed review):
|


| Consider signing up for our daily 12Stocks.com "Best Stocks Newsletter". You will never ever miss a big stock move again! |
| 12Stocks.com: Investing in Consumer Services sector with Stocks | |
|
The following table helps investors and traders sort through current performance and trends (as measured by Smart Investing & Trading Score) of various
stocks in the Consumer Services sector. Quick View: Move mouse or cursor over stock symbol (ticker) to view short-term Technical chart and over stock name to view long term chart. Click on  to add stock symbol to your watchlist and to add stock symbol to your watchlist and  to view watchlist. Click on any ticker or stock name for detailed market intelligence report for that stock. to view watchlist. Click on any ticker or stock name for detailed market intelligence report for that stock. |
12Stocks.com Performance of Stocks in Consumer Services Sector
| Ticker | Stock Name | Watchlist | Category | Recent Price | Smart Investing & Trading Score | Change % | Weekly Change% |
| YUMC | Yum China |   | Restaurants | 39.20 | 40 | 0.15% | 3.59% |
| CRAI | CRA | | Services | 170.64 | 83 | -0.25% | 3.58% |
| HTHT | Huazhu | | Lodging | 41.33 | 71 | -1.69% | 3.45% |
| DJCO | Daily Journal | | Publishing | 390.90 | 90 | 1.24% | 3.44% |
| DDS | Dillard s | | Department | 437.38 | 43 | 0.67% | 3.40% |
| MCO | Moody s | | Services | 413.92 | 90 | 0.46% | 3.39% |
| FYBR | Frontier | | Telecom Services | 26.87 | 90 | 0.49% | 3.35% |
| ETSY | Etsy | | Retail | 63.97 | 52 | -0.19% | 3.31% |
| SSTK | Shutterstock | | Services | 41.94 | 27 | -0.19% | 3.30% |
| ATAT | Atour Lifestyle | | Lodging | 18.58 | 60 | 0.27% | 3.28% |
| JWN | Nordstrom | | Apparel | 21.25 | 68 | 0.24% | 3.26% |
| MELI | MercadoLibre | | Retail | 1749.17 | 90 | 0.58% | 3.26% |
| GDEV | GDEV | | Electronic Gaming & Multimedia | 2.22 | 88 | 0.45% | 3.26% |
| TBI | TrueBlue | | Staffing | 11.17 | 57 | -1.24% | 3.23% |
| ICLK | iClick Interactive | | Marketing | 1.28 | 64 | -0.78% | 3.23% |
| MOND | Mondee | | Travel Services | 2.28 | 81 | -1.72% | 3.17% |
| INCR | Research | | Research | 3.29 | 29 | 4.61% | 3.13% |
| REAL | RealReal | | Retail | 4.17 | 58 | -4.14% | 3.09% |
| BEDU | Bright Scholar | | Education | 2.00 | 52 | -5.66% | 3.09% |
| CONN | Conn s | | Retail | 3.68 | 59 | 3.08% | 3.08% |
| INSW | Seaways | | Services | 63.31 | 90 | -0.30% | 3.08% |
| APEI | American Public | | Education | 18.39 | 76 | 1.55% | 3.08% |
| AVT | Avnet | | Retail | 53.33 | 76 | 0.49% | 3.05% |
| TTEK | Tetra Tech | | Services | 220.22 | 95 | 0.82% | 3.04% |
| HYZN | Hyzon Motors | | Auto Manufacturers | 0.55 | 32 | -0.11% | 3.02% |
| For chart view version of above stock list: Chart View ➞ 0 - 25 , 25 - 50 , 50 - 75 , 75 - 100 , 100 - 125 , 125 - 150 , 150 - 175 , 175 - 200 , 200 - 225 , 225 - 250 , 250 - 275 , 275 - 300 , 300 - 325 , 325 - 350 , 350 - 375 , 375 - 400 , 400 - 425 , 425 - 450 , 450 - 475 | ||
 | Click To Change The Sort Order: By Market Cap or Company Size Performance: Year-to-date, Week and Day |  |
|
Get the most comprehensive stock market coverage daily at 12Stocks.com ➞ Best Stocks Today ➞ Best Stocks Weekly ➞ Best Stocks Year-to-Date ➞ Best Stocks Trends ➞  Best Stocks Today 12Stocks.com Best Nasdaq Stocks ➞ Best S&P 500 Stocks ➞ Best Tech Stocks ➞ Best Biotech Stocks ➞ |
| Detailed Overview of Consumer Services Stocks |
| Consumer Services Technical Overview, Leaders & Laggards, Top Consumer Services ETF Funds & Detailed Consumer Services Stocks List, Charts, Trends & More |
| Consumer Services Sector: Technical Analysis, Trends & YTD Performance | |
| Consumer Services sector is composed of stocks
from retail, entertainment, media/publishing, consumer goods
and services subsectors. Consumer Services sector, as represented by XLY, an exchange-traded fund [ETF] that holds basket of Consumer Services stocks (e.g, Walmart, Alibaba) is down by -0.06% and is currently underperforming the overall market by -10.63% year-to-date. Below is a quick view of Technical charts and trends: |
|
 XLY Weekly Chart |
|
| Long Term Trend: Not Good | |
| Medium Term Trend: Very Good | |
 XLY Daily Chart |
|
| Short Term Trend: Good | |
| Overall Trend Score: 40 | |
| YTD Performance: -0.06% | |
| **Trend Scores & Views Are Only For Educational Purposes And Not For Investing | |
| 12Stocks.com: Top Performing Consumer Services Sector Stocks | ||||||||||||||||||||||||||||||||||||||||||||||||
 The top performing Consumer Services sector stocks year to date are
Now, more recently, over last week, the top performing Consumer Services sector stocks on the move are


|
||||||||||||||||||||||||||||||||||||||||||||||||
| 12Stocks.com: Investing in Consumer Services Sector using Exchange Traded Funds | |
|
The following table shows list of key exchange traded funds (ETF) that
help investors track Consumer Services Index. For detailed view, check out our ETF Funds section of our website. Quick View: Move mouse or cursor over ETF symbol (ticker) to view short-term Technical chart and over ETF name to view long term chart. Click on ticker or stock name for detailed view. Click on to add stock symbol to your watchlist and to view watchlist. |
12Stocks.com List of ETFs that track Consumer Services Index
| Ticker | ETF Name | Watchlist | Recent Price | Smart Investing & Trading Score | Change % | Week % | Year-to-date % |
| XLY | Consumer Discret Sel | | 178.70 | 40 | 0.51 | 0.34 | -0.06% |
| RTH | Retail | | 204.39 | 70 | 0.17 | 0.41 | 8.59% |
| IYC | Consumer Services | | 80.00 | 45 | 0.26 | 0.49 | 5.58% |
| XRT | Retail | | 75.93 | 37 | -0.78 | 2.08 | 4.99% |
| IYK | Consumer Goods | | 68.05 | 76 | -0.29 | 0.16 | 6.49% |
| UCC | Consumer Services | | 34.67 | 40 | 0.35 | 0.26 | -3.45% |
| RETL | Retail Bull 3X | | 9.64 | 37 | -2.63 | 5.47 | 5.7% |
| RXI | Globl Consumer Discretionary | | 164.60 | 57 | 0.50 | 0.99 | 3.48% |
| SCC | Short Consumer Services | | 15.33 | 54 | -0.65 | -0.39 | 0.04% |
| UGE | Consumer Goods | | 18.22 | 93 | -0.94 | 1.11 | 15.73% |
| 12Stocks.com: Charts, Trends, Fundamental Data and Performances of Consumer Services Stocks | |
|
We now take in-depth look at all Consumer Services stocks including charts, multi-period performances and overall trends (as measured by Smart Investing & Trading Score). One can sort Consumer Services stocks (click link to choose) by Daily, Weekly and by Year-to-Date performances. Also, one can sort by size of the company or by market capitalization. |
| Select Your Default Chart Type: | |||||
| |||||
| Click on stock symbol or name for detailed view. Click on to add stock symbol to your watchlist and to view watchlist. Quick View: Move mouse or cursor over "Daily" to quickly view daily Technical stock chart and over "Weekly" to view weekly Technical stock chart. | |||||

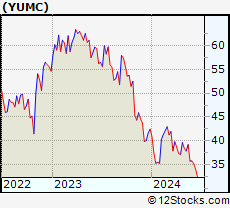 | YUMC Yum China Holdings, Inc. |
| Sector: Services & Goods | |
| SubSector: Restaurants | |
| MarketCap: 16284.5 Millions | |
| Recent Price: 39.20 Smart Investing & Trading Score: 40 | |
| Day Percent Change: 0.15% Day Change: 0.06 | |
| Week Change: 3.59% Year-to-date Change: -7.6% | |
| YUMC Links: Profile News Message Board | |
| Charts:- Daily , Weekly | |
| Add YUMC to Watchlist: View: Get Complete YUMC Trend Analysis ➞ | |
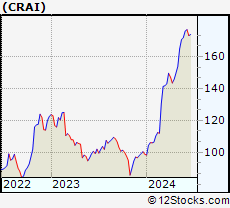 | CRAI CRA International, Inc. |
| Sector: Services & Goods | |
| SubSector: Management Services | |
| MarketCap: 209.645 Millions | |
| Recent Price: 170.64 Smart Investing & Trading Score: 83 | |
| Day Percent Change: -0.25% Day Change: -0.43 | |
| Week Change: 3.58% Year-to-date Change: 72.6% | |
| CRAI Links: Profile News Message Board | |
| Charts:- Daily , Weekly | |
| Add CRAI to Watchlist: View: Get Complete CRAI Trend Analysis ➞ | |
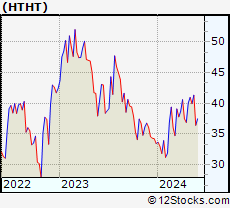 | HTHT Huazhu Group Limited |
| Sector: Services & Goods | |
| SubSector: Lodging | |
| MarketCap: 9164.46 Millions | |
| Recent Price: 41.33 Smart Investing & Trading Score: 71 | |
| Day Percent Change: -1.69% Day Change: -0.71 | |
| Week Change: 3.45% Year-to-date Change: 23.6% | |
| HTHT Links: Profile News Message Board | |
| Charts:- Daily , Weekly | |
| Add HTHT to Watchlist: View: Get Complete HTHT Trend Analysis ➞ | |
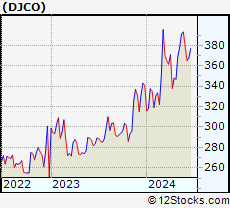 | DJCO Daily Journal Corporation |
| Sector: Services & Goods | |
| SubSector: Publishing - Newspapers | |
| MarketCap: 306.822 Millions | |
| Recent Price: 390.90 Smart Investing & Trading Score: 90 | |
| Day Percent Change: 1.24% Day Change: 4.80 | |
| Week Change: 3.44% Year-to-date Change: 14.7% | |
| DJCO Links: Profile News Message Board | |
| Charts:- Daily , Weekly | |
| Add DJCO to Watchlist: View: Get Complete DJCO Trend Analysis ➞ | |
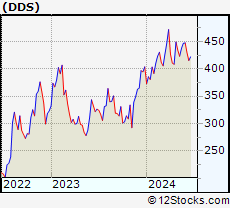 | DDS Dillard s, Inc. |
| Sector: Services & Goods | |
| SubSector: Department Stores | |
| MarketCap: 1170.82 Millions | |
| Recent Price: 437.38 Smart Investing & Trading Score: 43 | |
| Day Percent Change: 0.67% Day Change: 2.93 | |
| Week Change: 3.4% Year-to-date Change: 8.4% | |
| DDS Links: Profile News Message Board | |
| Charts:- Daily , Weekly | |
| Add DDS to Watchlist: View: Get Complete DDS Trend Analysis ➞ | |
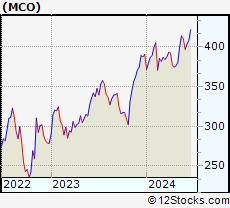 | MCO Moody s Corporation |
| Sector: Services & Goods | |
| SubSector: Business Services | |
| MarketCap: 35998.5 Millions | |
| Recent Price: 413.92 Smart Investing & Trading Score: 90 | |
| Day Percent Change: 0.46% Day Change: 1.90 | |
| Week Change: 3.39% Year-to-date Change: 6.0% | |
| MCO Links: Profile News Message Board | |
| Charts:- Daily , Weekly | |
| Add MCO to Watchlist: View: Get Complete MCO Trend Analysis ➞ | |
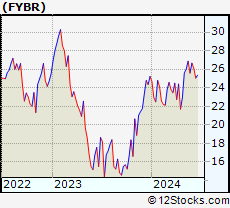 | FYBR Frontier Communications Parent, Inc. |
| Sector: Services & Goods | |
| SubSector: Telecom Services | |
| MarketCap: 4460 Millions | |
| Recent Price: 26.87 Smart Investing & Trading Score: 90 | |
| Day Percent Change: 0.49% Day Change: 0.13 | |
| Week Change: 3.35% Year-to-date Change: 6.5% | |
| FYBR Links: Profile News Message Board | |
| Charts:- Daily , Weekly | |
| Add FYBR to Watchlist: View: Get Complete FYBR Trend Analysis ➞ | |
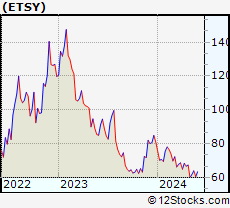 | ETSY Etsy, Inc. |
| Sector: Services & Goods | |
| SubSector: Specialty Retail, Other | |
| MarketCap: 4263.24 Millions | |
| Recent Price: 63.97 Smart Investing & Trading Score: 52 | |
| Day Percent Change: -0.19% Day Change: -0.12 | |
| Week Change: 3.31% Year-to-date Change: -21.1% | |
| ETSY Links: Profile News Message Board | |
| Charts:- Daily , Weekly | |
| Add ETSY to Watchlist: View: Get Complete ETSY Trend Analysis ➞ | |
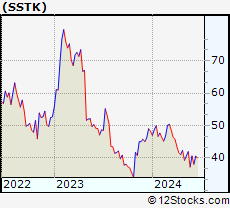 | SSTK Shutterstock, Inc. |
| Sector: Services & Goods | |
| SubSector: Business Services | |
| MarketCap: 1409.62 Millions | |
| Recent Price: 41.94 Smart Investing & Trading Score: 27 | |
| Day Percent Change: -0.19% Day Change: -0.08 | |
| Week Change: 3.3% Year-to-date Change: -13.1% | |
| SSTK Links: Profile News Message Board | |
| Charts:- Daily , Weekly | |
| Add SSTK to Watchlist: View: Get Complete SSTK Trend Analysis ➞ | |
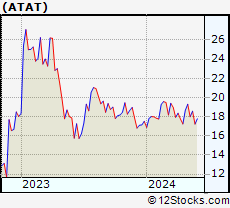 | ATAT Atour Lifestyle Holdings Limited |
| Sector: Services & Goods | |
| SubSector: Lodging | |
| MarketCap: 2120 Millions | |
| Recent Price: 18.58 Smart Investing & Trading Score: 60 | |
| Day Percent Change: 0.27% Day Change: 0.05 | |
| Week Change: 3.28% Year-to-date Change: 6.1% | |
| ATAT Links: Profile News Message Board | |
| Charts:- Daily , Weekly | |
| Add ATAT to Watchlist: View: Get Complete ATAT Trend Analysis ➞ | |
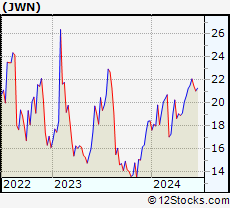 | JWN Nordstrom, Inc. |
| Sector: Services & Goods | |
| SubSector: Apparel Stores | |
| MarketCap: 3351.68 Millions | |
| Recent Price: 21.25 Smart Investing & Trading Score: 68 | |
| Day Percent Change: 0.24% Day Change: 0.05 | |
| Week Change: 3.26% Year-to-date Change: 15.2% | |
| JWN Links: Profile News Message Board | |
| Charts:- Daily , Weekly | |
| Add JWN to Watchlist: View: Get Complete JWN Trend Analysis ➞ | |
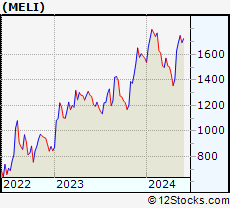 | MELI MercadoLibre, Inc. |
| Sector: Services & Goods | |
| SubSector: Catalog & Mail Order Houses | |
| MarketCap: 24695.5 Millions | |
| Recent Price: 1749.17 Smart Investing & Trading Score: 90 | |
| Day Percent Change: 0.58% Day Change: 10.02 | |
| Week Change: 3.26% Year-to-date Change: 11.3% | |
| MELI Links: Profile News Message Board | |
| Charts:- Daily , Weekly | |
| Add MELI to Watchlist: View: Get Complete MELI Trend Analysis ➞ | |
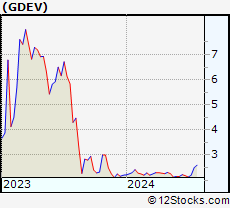 | GDEV GDEV Inc. |
| Sector: Services & Goods | |
| SubSector: Electronic Gaming & Multimedia | |
| MarketCap: 1300 Millions | |
| Recent Price: 2.22 Smart Investing & Trading Score: 88 | |
| Day Percent Change: 0.45% Day Change: 0.01 | |
| Week Change: 3.26% Year-to-date Change: 0.9% | |
| GDEV Links: Profile News Message Board | |
| Charts:- Daily , Weekly | |
| Add GDEV to Watchlist: View: Get Complete GDEV Trend Analysis ➞ | |
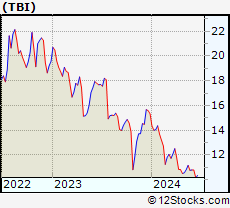 | TBI TrueBlue, Inc. |
| Sector: Services & Goods | |
| SubSector: Staffing & Outsourcing Services | |
| MarketCap: 563.228 Millions | |
| Recent Price: 11.17 Smart Investing & Trading Score: 57 | |
| Day Percent Change: -1.24% Day Change: -0.14 | |
| Week Change: 3.23% Year-to-date Change: -27.2% | |
| TBI Links: Profile News Message Board | |
| Charts:- Daily , Weekly | |
| Add TBI to Watchlist: View: Get Complete TBI Trend Analysis ➞ | |
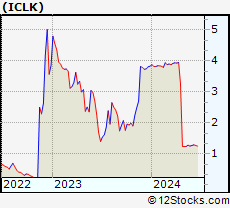 | ICLK iClick Interactive Asia Group Limited |
| Sector: Services & Goods | |
| SubSector: Marketing Services | |
| MarketCap: 258.915 Millions | |
| Recent Price: 1.28 Smart Investing & Trading Score: 64 | |
| Day Percent Change: -0.78% Day Change: -0.01 | |
| Week Change: 3.23% Year-to-date Change: -66.6% | |
| ICLK Links: Profile News Message Board | |
| Charts:- Daily , Weekly | |
| Add ICLK to Watchlist: View: Get Complete ICLK Trend Analysis ➞ | |
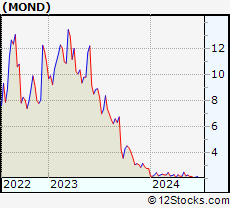 | MOND Mondee Holdings, Inc. |
| Sector: Services & Goods | |
| SubSector: Travel Services | |
| MarketCap: 744 Millions | |
| Recent Price: 2.28 Smart Investing & Trading Score: 81 | |
| Day Percent Change: -1.72% Day Change: -0.04 | |
| Week Change: 3.17% Year-to-date Change: -18.0% | |
| MOND Links: Profile News Message Board | |
| Charts:- Daily , Weekly | |
| Add MOND to Watchlist: View: Get Complete MOND Trend Analysis ➞ | |
 | INCR INC Research Holdings, Inc. |
| Sector: Services & Goods | |
| SubSector: Research Services | |
| MarketCap: 2486.94 Millions | |
| Recent Price: 3.29 Smart Investing & Trading Score: 29 | |
| Day Percent Change: 4.61% Day Change: 0.15 | |
| Week Change: 3.13% Year-to-date Change: 155.1% | |
| INCR Links: Profile News Message Board | |
| Charts:- Daily , Weekly | |
| Add INCR to Watchlist: View: Get Complete INCR Trend Analysis ➞ | |
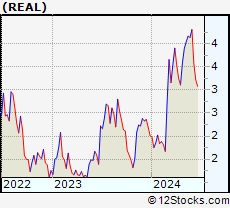 | REAL The RealReal, Inc. |
| Sector: Services & Goods | |
| SubSector: Specialty Retail, Other | |
| MarketCap: 839.344 Millions | |
| Recent Price: 4.17 Smart Investing & Trading Score: 58 | |
| Day Percent Change: -4.14% Day Change: -0.18 | |
| Week Change: 3.09% Year-to-date Change: 107.5% | |
| REAL Links: Profile News Message Board | |
| Charts:- Daily , Weekly | |
| Add REAL to Watchlist: View: Get Complete REAL Trend Analysis ➞ | |
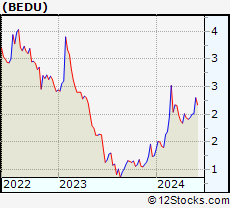 | BEDU Bright Scholar Education Holdings Limited |
| Sector: Services & Goods | |
| SubSector: Education & Training Services | |
| MarketCap: 792.406 Millions | |
| Recent Price: 2.00 Smart Investing & Trading Score: 52 | |
| Day Percent Change: -5.66% Day Change: -0.12 | |
| Week Change: 3.09% Year-to-date Change: 60.0% | |
| BEDU Links: Profile News Message Board | |
| Charts:- Daily , Weekly | |
| Add BEDU to Watchlist: View: Get Complete BEDU Trend Analysis ➞ | |
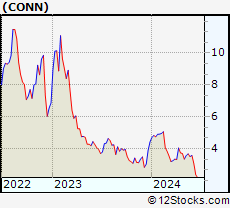 | CONN Conn s, Inc. |
| Sector: Services & Goods | |
| SubSector: Electronics Stores | |
| MarketCap: 153.2 Millions | |
| Recent Price: 3.68 Smart Investing & Trading Score: 59 | |
| Day Percent Change: 3.08% Day Change: 0.11 | |
| Week Change: 3.08% Year-to-date Change: -17.1% | |
| CONN Links: Profile News Message Board | |
| Charts:- Daily , Weekly | |
| Add CONN to Watchlist: View: Get Complete CONN Trend Analysis ➞ | |
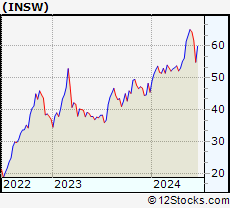 | INSW International Seaways, Inc. |
| Sector: Services & Goods | |
| SubSector: Business Services | |
| MarketCap: 521.582 Millions | |
| Recent Price: 63.31 Smart Investing & Trading Score: 90 | |
| Day Percent Change: -0.30% Day Change: -0.19 | |
| Week Change: 3.08% Year-to-date Change: 39.2% | |
| INSW Links: Profile News Message Board | |
| Charts:- Daily , Weekly | |
| Add INSW to Watchlist: View: Get Complete INSW Trend Analysis ➞ | |
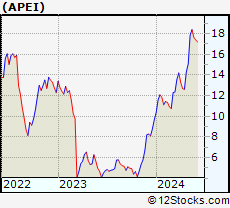 | APEI American Public Education, Inc. |
| Sector: Services & Goods | |
| SubSector: Education & Training Services | |
| MarketCap: 361.306 Millions | |
| Recent Price: 18.39 Smart Investing & Trading Score: 76 | |
| Day Percent Change: 1.55% Day Change: 0.28 | |
| Week Change: 3.08% Year-to-date Change: 90.6% | |
| APEI Links: Profile News Message Board | |
| Charts:- Daily , Weekly | |
| Add APEI to Watchlist: View: Get Complete APEI Trend Analysis ➞ | |
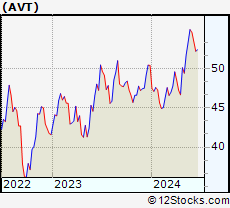 | AVT Avnet, Inc. |
| Sector: Services & Goods | |
| SubSector: Electronics Wholesale | |
| MarketCap: 2776.33 Millions | |
| Recent Price: 53.33 Smart Investing & Trading Score: 76 | |
| Day Percent Change: 0.49% Day Change: 0.26 | |
| Week Change: 3.05% Year-to-date Change: 5.8% | |
| AVT Links: Profile News Message Board | |
| Charts:- Daily , Weekly | |
| Add AVT to Watchlist: View: Get Complete AVT Trend Analysis ➞ | |
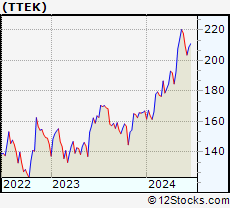 | TTEK Tetra Tech, Inc. |
| Sector: Services & Goods | |
| SubSector: Technical Services | |
| MarketCap: 3985.5 Millions | |
| Recent Price: 220.22 Smart Investing & Trading Score: 95 | |
| Day Percent Change: 0.82% Day Change: 1.79 | |
| Week Change: 3.04% Year-to-date Change: 31.9% | |
| TTEK Links: Profile News Message Board | |
| Charts:- Daily , Weekly | |
| Add TTEK to Watchlist: View: Get Complete TTEK Trend Analysis ➞ | |
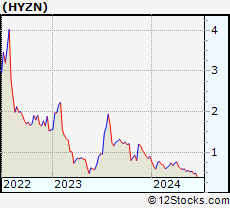 | HYZN Hyzon Motors Inc. |
| Sector: Services & Goods | |
| SubSector: Auto Manufacturers | |
| MarketCap: 223 Millions | |
| Recent Price: 0.55 Smart Investing & Trading Score: 32 | |
| Day Percent Change: -0.11% Day Change: 0.00 | |
| Week Change: 3.02% Year-to-date Change: -38.8% | |
| HYZN Links: Profile News Message Board | |
| Charts:- Daily , Weekly | |
| Add HYZN to Watchlist: View: Get Complete HYZN Trend Analysis ➞ | |
| For tabular summary view of above stock list: Summary View ➞ 0 - 25 , 25 - 50 , 50 - 75 , 75 - 100 , 100 - 125 , 125 - 150 , 150 - 175 , 175 - 200 , 200 - 225 , 225 - 250 , 250 - 275 , 275 - 300 , 300 - 325 , 325 - 350 , 350 - 375 , 375 - 400 , 400 - 425 , 425 - 450 , 450 - 475 | ||
| Click To Change The Sort Order: By Market Cap or Company Size Performance: Year-to-date, Week and Day | |
| Select Chart Type: | ||
|
Best Stocks Today 12Stocks.com |
© 2024 12Stocks.com Terms & Conditions Privacy Contact Us
All Information Provided Only For Education And Not To Be Used For Investing or Trading. See Terms & Conditions


One More Thing ... Get Best Stocks Delivered Daily!
Never Ever Miss A Move With Our Top Ten Stocks Lists
Find Best Stocks In Any Market - Bull or Bear Market
Take A Peek At Our Top Ten Stocks Lists: Daily, Weekly, Year-to-Date & Top Trends
Find Best Stocks In Any Market - Bull or Bear Market
Take A Peek At Our Top Ten Stocks Lists: Daily, Weekly, Year-to-Date & Top Trends
Consumer Services Stocks With Best Up Trends [0-bearish to 100-bullish]: Despegar.com [100], Boqii Holding[100], Gannett Co[100], Littelfuse [100], On Holding[100], Tractor Supply[100], Outbrain [100], Super [100], Kratos Defense[100], Alibaba [100], MakeMyTrip [100]
Best Consumer Services Stocks Year-to-Date:
U Power[3454.69%], Vroom [1751.48%], Yatsen Holding[515.09%], Fluent [432.84%], Zhihu [349.45%], Faraday Future[346.47%], Codere Online[183.9%], Sweetgreen [180.97%], Research[155.08%], Carvana Co[121.95%], Smart Share[121.36%] Best Consumer Services Stocks This Week:
Faraday Future[2134.27%], AMC Entertainment[51.2%], Petco Health[50%], HUYA [36.36%], Allbirds [28.4%], GameStop [27.21%], On Holding[25.39%], MOGU [24.34%], EVgo [22.58%], Despegar.com [22.06%], U Power[20.64%] Best Consumer Services Stocks Daily:
Despegar.com [19.14%], Golden Heaven[16.00%], Cumulus Media[10.92%], Zhihu [8.42%], Boqii Holding[7.35%], Yunji [6.10%], Dada Nexus[6.04%], CompX [5.17%], Qurate Retail[5.06%], Gannett Co[4.79%], Research[4.61%]