
 Login Sign Up


| |||||
 |  | ||||

| 12Stocks.com Market Intelligence |
Best Consumer Services Stocks
| In a hurry? Services & Goods Stocks: Performance Trends Table, Stock Charts
Sort Consumer Services: Daily, Weekly, Year-to-Date, Market Cap & Trends. Filter Services & Goods stocks list by size: All Large Mid-Range Small |
| 12Stocks.com Consumer Services Stocks Performances & Trends Daily | |||||||||
|
|  The overall Smart Investing & Trading Score is 40 (0-bearish to 100-bullish) which puts Consumer Services sector in short term bearish to neutral trend. The Smart Investing & Trading Score from previous trading session is 47 and a deterioration of trend continues.
| ||||||||
Here are the Smart Investing & Trading Scores of the most requested Consumer Services stocks at 12Stocks.com (click stock name for detailed review):
|


| Consider signing up for our daily 12Stocks.com "Best Stocks Newsletter". You will never ever miss a big stock move again! |
| 12Stocks.com: Investing in Consumer Services sector with Stocks | |
|
The following table helps investors and traders sort through current performance and trends (as measured by Smart Investing & Trading Score) of various
stocks in the Consumer Services sector. Quick View: Move mouse or cursor over stock symbol (ticker) to view short-term Technical chart and over stock name to view long term chart. Click on  to add stock symbol to your watchlist and to add stock symbol to your watchlist and  to view watchlist. Click on any ticker or stock name for detailed market intelligence report for that stock. to view watchlist. Click on any ticker or stock name for detailed market intelligence report for that stock. |
12Stocks.com Performance of Stocks in Consumer Services Sector
| Ticker | Stock Name | Watchlist | Category | Recent Price | Smart Investing & Trading Score | Change % | Weekly Change% |
| WEN | Wendy s |   | Restaurants | 18.39 | 36 | -1.13% | -3.21% |
| BFAM | Bright Horizons | | Services | 109.06 | 20 | -3.20% | -3.23% |
| QSR | Restaurant Brands | | Restaurants | 70.86 | 0 | -1.03% | -3.25% |
| CHDN | Churchill Downs | | Gaming | 133.62 | 64 | -0.97% | -3.51% |
| HLLY | Holley | | Auto Parts | 3.85 | 0 | -1.53% | -3.51% |
| TAL | TAL Education | | Education | 12.93 | 17 | -0.84% | -3.65% |
| ACM | AECOM | | Services | 89.62 | 26 | 0.01% | -3.69% |
| SGA | Saga | | Broadcasting | 20.04 | 10 | -0.05% | -3.79% |
| AEO | American Eagle | | Apparel | 23.53 | 0 | -0.38% | -3.80% |
| VSEC | VSE | | Services | 76.73 | 73 | 1.40% | -3.82% |
| SHAK | Shake Shack | | Restaurants | 99.16 | 0 | -2.27% | -3.99% |
| GHG | GreenTree Hospitality | | Lodging | 3.24 | 67 | 4.52% | -4.03% |
| WEX | WEX | | Services | 198.21 | 0 | -2.60% | -4.09% |
| PZZA | Papa John | | Restaurants | 51.10 | 10 | -2.01% | -4.16% |
| RH | RH | | Retail | 278.41 | 63 | -2.89% | -4.32% |
| GTN | Gray Television | | Broadcasting | 6.56 | 68 | -1.35% | -4.37% |
| DFH | Dream Finders | | Residential Construction | 29.28 | 10 | 2.06% | -4.38% |
| DDI | DoubleDown Interactive | | Electronic Gaming & Multimedia | 11.95 | 67 | 1.32% | -4.40% |
| DENN | Denny s | | Restaurants | 7.79 | 10 | -4.30% | -4.42% |
| EVRI | Everi | | Gaming | 7.38 | 0 | -1.86% | -4.53% |
| LVWR | LiveWire | | Auto Manufacturers | 6.73 | 34 | 2.12% | -4.67% |
| BKE | Buckle | | Apparel | 36.98 | 0 | -0.51% | -4.69% |
| PLYA | Playa Hotels | | Casinos | 8.33 | 8 | -2.46% | -4.91% |
| GPS | Gap | | Apparel | 21.60 | 49 | -0.74% | -5.10% |
| W | Wayfair | | Retail | 67.10 | 68 | -2.29% | -5.12% |
| For chart view version of above stock list: Chart View ➞ 0 - 25 , 25 - 50 , 50 - 75 , 75 - 100 , 100 - 125 , 125 - 150 , 150 - 175 , 175 - 200 , 200 - 225 , 225 - 250 , 250 - 275 , 275 - 300 , 300 - 325 , 325 - 350 , 350 - 375 , 375 - 400 , 400 - 425 , 425 - 450 , 450 - 475 | ||
 | Click To Change The Sort Order: By Market Cap or Company Size Performance: Year-to-date, Week and Day |  |
|
Get the most comprehensive stock market coverage daily at 12Stocks.com ➞ Best Stocks Today ➞ Best Stocks Weekly ➞ Best Stocks Year-to-Date ➞ Best Stocks Trends ➞  Best Stocks Today 12Stocks.com Best Nasdaq Stocks ➞ Best S&P 500 Stocks ➞ Best Tech Stocks ➞ Best Biotech Stocks ➞ |
| Detailed Overview of Consumer Services Stocks |
| Consumer Services Technical Overview, Leaders & Laggards, Top Consumer Services ETF Funds & Detailed Consumer Services Stocks List, Charts, Trends & More |
| Consumer Services Sector: Technical Analysis, Trends & YTD Performance | |
| Consumer Services sector is composed of stocks
from retail, entertainment, media/publishing, consumer goods
and services subsectors. Consumer Services sector, as represented by XLY, an exchange-traded fund [ETF] that holds basket of Consumer Services stocks (e.g, Walmart, Alibaba) is down by -0.06% and is currently underperforming the overall market by -10.63% year-to-date. Below is a quick view of Technical charts and trends: |
|
 XLY Weekly Chart |
|
| Long Term Trend: Not Good | |
| Medium Term Trend: Very Good | |
 XLY Daily Chart |
|
| Short Term Trend: Good | |
| Overall Trend Score: 40 | |
| YTD Performance: -0.06% | |
| **Trend Scores & Views Are Only For Educational Purposes And Not For Investing | |
| 12Stocks.com: Top Performing Consumer Services Sector Stocks | ||||||||||||||||||||||||||||||||||||||||||||||||
 The top performing Consumer Services sector stocks year to date are
Now, more recently, over last week, the top performing Consumer Services sector stocks on the move are


|
||||||||||||||||||||||||||||||||||||||||||||||||
| 12Stocks.com: Investing in Consumer Services Sector using Exchange Traded Funds | |
|
The following table shows list of key exchange traded funds (ETF) that
help investors track Consumer Services Index. For detailed view, check out our ETF Funds section of our website. Quick View: Move mouse or cursor over ETF symbol (ticker) to view short-term Technical chart and over ETF name to view long term chart. Click on ticker or stock name for detailed view. Click on to add stock symbol to your watchlist and to view watchlist. |
12Stocks.com List of ETFs that track Consumer Services Index
| Ticker | ETF Name | Watchlist | Recent Price | Smart Investing & Trading Score | Change % | Week % | Year-to-date % |
| XLY | Consumer Discret Sel | | 178.70 | 40 | 0.51 | 0.34 | -0.06% |
| RTH | Retail | | 204.39 | 70 | 0.17 | 0.41 | 8.59% |
| IYC | Consumer Services | | 80.00 | 45 | 0.26 | 0.49 | 5.58% |
| XRT | Retail | | 75.93 | 37 | -0.78 | 2.08 | 4.99% |
| IYK | Consumer Goods | | 68.05 | 76 | -0.29 | 0.16 | 6.49% |
| UCC | Consumer Services | | 34.67 | 40 | 0.35 | 0.26 | -3.45% |
| RETL | Retail Bull 3X | | 9.64 | 37 | -2.63 | 5.47 | 5.7% |
| RXI | Globl Consumer Discretionary | | 164.60 | 57 | 0.50 | 0.99 | 3.48% |
| SCC | Short Consumer Services | | 15.33 | 54 | -0.65 | -0.39 | 0.04% |
| UGE | Consumer Goods | | 18.22 | 93 | -0.94 | 1.11 | 15.73% |
| 12Stocks.com: Charts, Trends, Fundamental Data and Performances of Consumer Services Stocks | |
|
We now take in-depth look at all Consumer Services stocks including charts, multi-period performances and overall trends (as measured by Smart Investing & Trading Score). One can sort Consumer Services stocks (click link to choose) by Daily, Weekly and by Year-to-Date performances. Also, one can sort by size of the company or by market capitalization. |
| Select Your Default Chart Type: | |||||
| |||||
| Click on stock symbol or name for detailed view. Click on to add stock symbol to your watchlist and to view watchlist. Quick View: Move mouse or cursor over "Daily" to quickly view daily Technical stock chart and over "Weekly" to view weekly Technical stock chart. | |||||

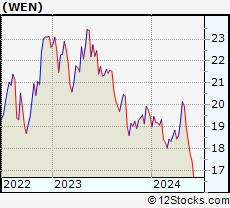 | WEN The Wendy s Company |
| Sector: Services & Goods | |
| SubSector: Restaurants | |
| MarketCap: 2814.9 Millions | |
| Recent Price: 18.39 Smart Investing & Trading Score: 36 | |
| Day Percent Change: -1.13% Day Change: -0.21 | |
| Week Change: -3.21% Year-to-date Change: -5.6% | |
| WEN Links: Profile News Message Board | |
| Charts:- Daily , Weekly | |
| Add WEN to Watchlist: View: Get Complete WEN Trend Analysis ➞ | |
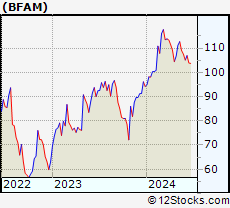 | BFAM Bright Horizons Family Solutions Inc. |
| Sector: Services & Goods | |
| SubSector: Personal Services | |
| MarketCap: 5487.65 Millions | |
| Recent Price: 109.06 Smart Investing & Trading Score: 20 | |
| Day Percent Change: -3.20% Day Change: -3.60 | |
| Week Change: -3.23% Year-to-date Change: 15.7% | |
| BFAM Links: Profile News Message Board | |
| Charts:- Daily , Weekly | |
| Add BFAM to Watchlist: View: Get Complete BFAM Trend Analysis ➞ | |
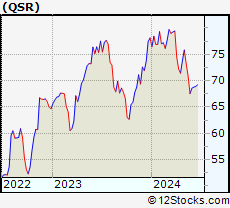 | QSR Restaurant Brands International Inc. |
| Sector: Services & Goods | |
| SubSector: Restaurants | |
| MarketCap: 9551 Millions | |
| Recent Price: 70.86 Smart Investing & Trading Score: 0 | |
| Day Percent Change: -1.03% Day Change: -0.74 | |
| Week Change: -3.25% Year-to-date Change: -9.3% | |
| QSR Links: Profile News Message Board | |
| Charts:- Daily , Weekly | |
| Add QSR to Watchlist: View: Get Complete QSR Trend Analysis ➞ | |
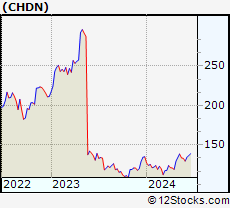 | CHDN Churchill Downs Incorporated |
| Sector: Services & Goods | |
| SubSector: Gaming Activities | |
| MarketCap: 3693.29 Millions | |
| Recent Price: 133.62 Smart Investing & Trading Score: 64 | |
| Day Percent Change: -0.97% Day Change: -1.31 | |
| Week Change: -3.51% Year-to-date Change: -1.0% | |
| CHDN Links: Profile News Message Board | |
| Charts:- Daily , Weekly | |
| Add CHDN to Watchlist: View: Get Complete CHDN Trend Analysis ➞ | |
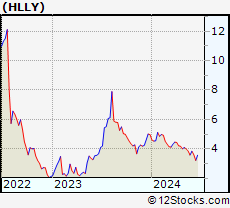 | HLLY Holley Inc. |
| Sector: Services & Goods | |
| SubSector: Auto Parts | |
| MarketCap: 469 Millions | |
| Recent Price: 3.85 Smart Investing & Trading Score: 0 | |
| Day Percent Change: -1.53% Day Change: -0.06 | |
| Week Change: -3.51% Year-to-date Change: -22.5% | |
| HLLY Links: Profile News Message Board | |
| Charts:- Daily , Weekly | |
| Add HLLY to Watchlist: View: Get Complete HLLY Trend Analysis ➞ | |
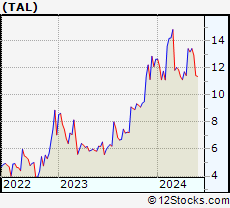 | TAL TAL Education Group |
| Sector: Services & Goods | |
| SubSector: Education & Training Services | |
| MarketCap: 30103.1 Millions | |
| Recent Price: 12.93 Smart Investing & Trading Score: 17 | |
| Day Percent Change: -0.84% Day Change: -0.11 | |
| Week Change: -3.65% Year-to-date Change: 2.4% | |
| TAL Links: Profile News Message Board | |
| Charts:- Daily , Weekly | |
| Add TAL to Watchlist: View: Get Complete TAL Trend Analysis ➞ | |
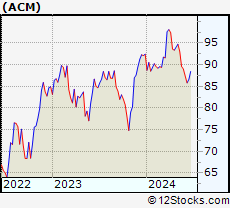 | ACM AECOM |
| Sector: Services & Goods | |
| SubSector: Technical Services | |
| MarketCap: 4781.9 Millions | |
| Recent Price: 89.62 Smart Investing & Trading Score: 26 | |
| Day Percent Change: 0.01% Day Change: 0.01 | |
| Week Change: -3.69% Year-to-date Change: -3.0% | |
| ACM Links: Profile News Message Board | |
| Charts:- Daily , Weekly | |
| Add ACM to Watchlist: View: Get Complete ACM Trend Analysis ➞ | |
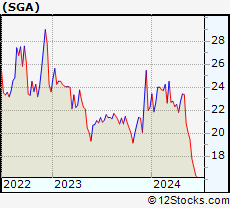 | SGA Saga Communications, Inc. |
| Sector: Services & Goods | |
| SubSector: Broadcasting - Radio | |
| MarketCap: 158.295 Millions | |
| Recent Price: 20.04 Smart Investing & Trading Score: 10 | |
| Day Percent Change: -0.05% Day Change: -0.01 | |
| Week Change: -3.79% Year-to-date Change: -10.0% | |
| SGA Links: Profile News Message Board | |
| Charts:- Daily , Weekly | |
| Add SGA to Watchlist: View: Get Complete SGA Trend Analysis ➞ | |
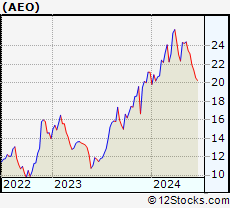 | AEO American Eagle Outfitters, Inc. |
| Sector: Services & Goods | |
| SubSector: Apparel Stores | |
| MarketCap: 1577.08 Millions | |
| Recent Price: 23.53 Smart Investing & Trading Score: 0 | |
| Day Percent Change: -0.38% Day Change: -0.09 | |
| Week Change: -3.8% Year-to-date Change: 11.2% | |
| AEO Links: Profile News Message Board | |
| Charts:- Daily , Weekly | |
| Add AEO to Watchlist: View: Get Complete AEO Trend Analysis ➞ | |
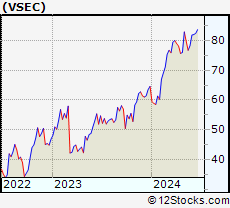 | VSEC VSE Corporation |
| Sector: Services & Goods | |
| SubSector: Technical Services | |
| MarketCap: 183.61 Millions | |
| Recent Price: 76.73 Smart Investing & Trading Score: 73 | |
| Day Percent Change: 1.40% Day Change: 1.06 | |
| Week Change: -3.82% Year-to-date Change: 18.8% | |
| VSEC Links: Profile News Message Board | |
| Charts:- Daily , Weekly | |
| Add VSEC to Watchlist: View: Get Complete VSEC Trend Analysis ➞ | |
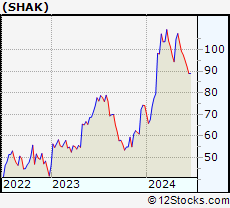 | SHAK Shake Shack Inc. |
| Sector: Services & Goods | |
| SubSector: Specialty Eateries | |
| MarketCap: 1497.67 Millions | |
| Recent Price: 99.16 Smart Investing & Trading Score: 0 | |
| Day Percent Change: -2.27% Day Change: -2.30 | |
| Week Change: -3.99% Year-to-date Change: 33.8% | |
| SHAK Links: Profile News Message Board | |
| Charts:- Daily , Weekly | |
| Add SHAK to Watchlist: View: Get Complete SHAK Trend Analysis ➞ | |
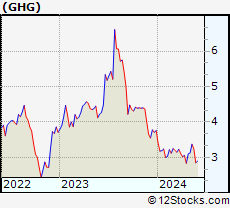 | GHG GreenTree Hospitality Group Ltd. |
| Sector: Services & Goods | |
| SubSector: Lodging | |
| MarketCap: 1195.36 Millions | |
| Recent Price: 3.24 Smart Investing & Trading Score: 67 | |
| Day Percent Change: 4.52% Day Change: 0.14 | |
| Week Change: -4.03% Year-to-date Change: -13.8% | |
| GHG Links: Profile News Message Board | |
| Charts:- Daily , Weekly | |
| Add GHG to Watchlist: View: Get Complete GHG Trend Analysis ➞ | |
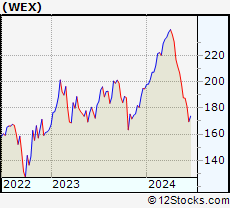 | WEX WEX Inc. |
| Sector: Services & Goods | |
| SubSector: Business Services | |
| MarketCap: 4312.22 Millions | |
| Recent Price: 198.21 Smart Investing & Trading Score: 0 | |
| Day Percent Change: -2.60% Day Change: -5.30 | |
| Week Change: -4.09% Year-to-date Change: 1.9% | |
| WEX Links: Profile News Message Board | |
| Charts:- Daily , Weekly | |
| Add WEX to Watchlist: View: Get Complete WEX Trend Analysis ➞ | |
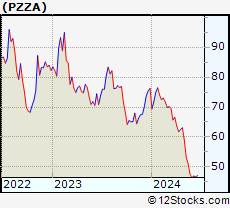 | PZZA Papa John s International, Inc. |
| Sector: Services & Goods | |
| SubSector: Specialty Eateries | |
| MarketCap: 1925.27 Millions | |
| Recent Price: 51.10 Smart Investing & Trading Score: 10 | |
| Day Percent Change: -2.01% Day Change: -1.05 | |
| Week Change: -4.16% Year-to-date Change: -33.0% | |
| PZZA Links: Profile News Message Board | |
| Charts:- Daily , Weekly | |
| Add PZZA to Watchlist: View: Get Complete PZZA Trend Analysis ➞ | |
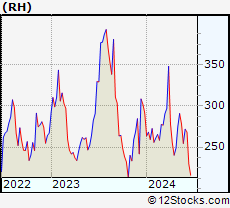 | RH RH |
| Sector: Services & Goods | |
| SubSector: Home Furnishing Stores | |
| MarketCap: 1828.25 Millions | |
| Recent Price: 278.41 Smart Investing & Trading Score: 63 | |
| Day Percent Change: -2.89% Day Change: -8.28 | |
| Week Change: -4.32% Year-to-date Change: -4.5% | |
| RH Links: Profile News Message Board | |
| Charts:- Daily , Weekly | |
| Add RH to Watchlist: View: Get Complete RH Trend Analysis ➞ | |
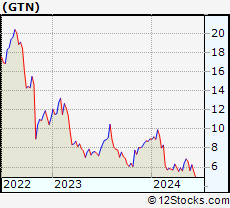 | GTN Gray Television, Inc. |
| Sector: Services & Goods | |
| SubSector: Broadcasting - TV | |
| MarketCap: 1144.63 Millions | |
| Recent Price: 6.56 Smart Investing & Trading Score: 68 | |
| Day Percent Change: -1.35% Day Change: -0.09 | |
| Week Change: -4.37% Year-to-date Change: -26.8% | |
| GTN Links: Profile News Message Board | |
| Charts:- Daily , Weekly | |
| Add GTN to Watchlist: View: Get Complete GTN Trend Analysis ➞ | |
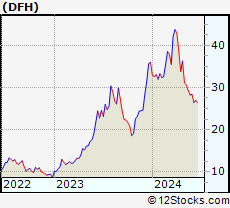 | DFH Dream Finders Homes, Inc. |
| Sector: Services & Goods | |
| SubSector: Residential Construction | |
| MarketCap: 2270 Millions | |
| Recent Price: 29.28 Smart Investing & Trading Score: 10 | |
| Day Percent Change: 2.06% Day Change: 0.59 | |
| Week Change: -4.38% Year-to-date Change: -18.7% | |
| DFH Links: Profile News Message Board | |
| Charts:- Daily , Weekly | |
| Add DFH to Watchlist: View: Get Complete DFH Trend Analysis ➞ | |
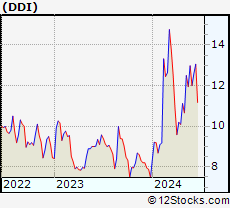 | DDI DoubleDown Interactive Co., Ltd. |
| Sector: Services & Goods | |
| SubSector: Electronic Gaming & Multimedia | |
| MarketCap: 482 Millions | |
| Recent Price: 11.95 Smart Investing & Trading Score: 67 | |
| Day Percent Change: 1.32% Day Change: 0.16 | |
| Week Change: -4.4% Year-to-date Change: 60.0% | |
| DDI Links: Profile News Message Board | |
| Charts:- Daily , Weekly | |
| Add DDI to Watchlist: View: Get Complete DDI Trend Analysis ➞ | |
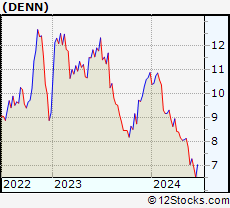 | DENN Denny s Corporation |
| Sector: Services & Goods | |
| SubSector: Restaurants | |
| MarketCap: 367.47 Millions | |
| Recent Price: 7.79 Smart Investing & Trading Score: 10 | |
| Day Percent Change: -4.30% Day Change: -0.35 | |
| Week Change: -4.42% Year-to-date Change: -28.4% | |
| DENN Links: Profile News Message Board | |
| Charts:- Daily , Weekly | |
| Add DENN to Watchlist: View: Get Complete DENN Trend Analysis ➞ | |
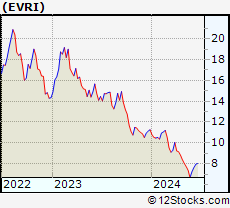 | EVRI Everi Holdings Inc. |
| Sector: Services & Goods | |
| SubSector: Gaming Activities | |
| MarketCap: 273.389 Millions | |
| Recent Price: 7.38 Smart Investing & Trading Score: 0 | |
| Day Percent Change: -1.86% Day Change: -0.14 | |
| Week Change: -4.53% Year-to-date Change: -34.5% | |
| EVRI Links: Profile News Message Board | |
| Charts:- Daily , Weekly | |
| Add EVRI to Watchlist: View: Get Complete EVRI Trend Analysis ➞ | |
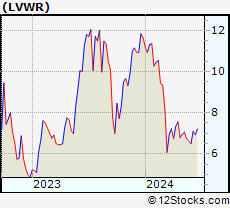 | LVWR LiveWire Group, Inc. |
| Sector: Services & Goods | |
| SubSector: Auto Manufacturers | |
| MarketCap: 2400 Millions | |
| Recent Price: 6.73 Smart Investing & Trading Score: 34 | |
| Day Percent Change: 2.12% Day Change: 0.14 | |
| Week Change: -4.67% Year-to-date Change: -42.2% | |
| LVWR Links: Profile News Message Board | |
| Charts:- Daily , Weekly | |
| Add LVWR to Watchlist: View: Get Complete LVWR Trend Analysis ➞ | |
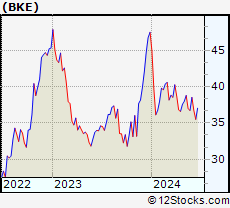 | BKE The Buckle, Inc. |
| Sector: Services & Goods | |
| SubSector: Apparel Stores | |
| MarketCap: 913.808 Millions | |
| Recent Price: 36.98 Smart Investing & Trading Score: 0 | |
| Day Percent Change: -0.51% Day Change: -0.19 | |
| Week Change: -4.69% Year-to-date Change: -22.2% | |
| BKE Links: Profile News Message Board | |
| Charts:- Daily , Weekly | |
| Add BKE to Watchlist: View: Get Complete BKE Trend Analysis ➞ | |
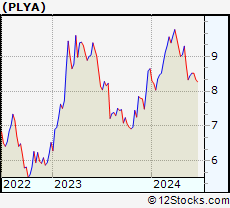 | PLYA Playa Hotels & Resorts N.V. |
| Sector: Services & Goods | |
| SubSector: Resorts & Casinos | |
| MarketCap: 360.194 Millions | |
| Recent Price: 8.33 Smart Investing & Trading Score: 8 | |
| Day Percent Change: -2.46% Day Change: -0.21 | |
| Week Change: -4.91% Year-to-date Change: -3.7% | |
| PLYA Links: Profile News Message Board | |
| Charts:- Daily , Weekly | |
| Add PLYA to Watchlist: View: Get Complete PLYA Trend Analysis ➞ | |
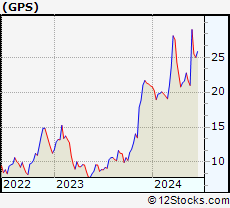 | GPS The Gap, Inc. |
| Sector: Services & Goods | |
| SubSector: Apparel Stores | |
| MarketCap: 2936.08 Millions | |
| Recent Price: 21.60 Smart Investing & Trading Score: 49 | |
| Day Percent Change: -0.74% Day Change: -0.16 | |
| Week Change: -5.1% Year-to-date Change: 3.3% | |
| GPS Links: Profile News Message Board | |
| Charts:- Daily , Weekly | |
| Add GPS to Watchlist: View: Get Complete GPS Trend Analysis ➞ | |
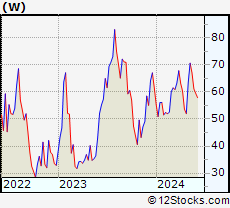 | W Wayfair Inc. |
| Sector: Services & Goods | |
| SubSector: Catalog & Mail Order Houses | |
| MarketCap: 3497.02 Millions | |
| Recent Price: 67.10 Smart Investing & Trading Score: 68 | |
| Day Percent Change: -2.29% Day Change: -1.57 | |
| Week Change: -5.12% Year-to-date Change: 8.8% | |
| W Links: Profile News Message Board | |
| Charts:- Daily , Weekly | |
| Add W to Watchlist: View: Get Complete W Trend Analysis ➞ | |
| For tabular summary view of above stock list: Summary View ➞ 0 - 25 , 25 - 50 , 50 - 75 , 75 - 100 , 100 - 125 , 125 - 150 , 150 - 175 , 175 - 200 , 200 - 225 , 225 - 250 , 250 - 275 , 275 - 300 , 300 - 325 , 325 - 350 , 350 - 375 , 375 - 400 , 400 - 425 , 425 - 450 , 450 - 475 | ||
| Click To Change The Sort Order: By Market Cap or Company Size Performance: Year-to-date, Week and Day | |
| Select Chart Type: | ||
|
Best Stocks Today 12Stocks.com |
© 2024 12Stocks.com Terms & Conditions Privacy Contact Us
All Information Provided Only For Education And Not To Be Used For Investing or Trading. See Terms & Conditions


One More Thing ... Get Best Stocks Delivered Daily!
Never Ever Miss A Move With Our Top Ten Stocks Lists
Find Best Stocks In Any Market - Bull or Bear Market
Take A Peek At Our Top Ten Stocks Lists: Daily, Weekly, Year-to-Date & Top Trends
Find Best Stocks In Any Market - Bull or Bear Market
Take A Peek At Our Top Ten Stocks Lists: Daily, Weekly, Year-to-Date & Top Trends
Consumer Services Stocks With Best Up Trends [0-bearish to 100-bullish]: Despegar.com [100], Boqii Holding[100], Gannett Co[100], Littelfuse [100], On Holding[100], Tractor Supply[100], Outbrain [100], Super [100], Kratos Defense[100], Alibaba [100], MakeMyTrip [100]
Best Consumer Services Stocks Year-to-Date:
U Power[3454.69%], Vroom [1751.48%], Yatsen Holding[515.09%], Fluent [432.84%], Zhihu [349.45%], Faraday Future[346.47%], Codere Online[183.9%], Sweetgreen [180.97%], Research[155.08%], Carvana Co[121.95%], Smart Share[121.36%] Best Consumer Services Stocks This Week:
Faraday Future[2134.27%], AMC Entertainment[51.2%], Petco Health[50%], HUYA [36.36%], Allbirds [28.4%], GameStop [27.21%], On Holding[25.39%], MOGU [24.34%], EVgo [22.58%], Despegar.com [22.06%], U Power[20.64%] Best Consumer Services Stocks Daily:
Despegar.com [19.14%], Golden Heaven[16.00%], Cumulus Media[10.92%], Zhihu [8.42%], Boqii Holding[7.35%], Yunji [6.10%], Dada Nexus[6.04%], CompX [5.17%], Qurate Retail[5.06%], Gannett Co[4.79%], Research[4.61%]