
 Login Sign Up


| |||||
 |  | ||||

| 12Stocks.com Market Intelligence |
Best Consumer Services Stocks
| In a hurry? Services & Goods Stocks: Performance Trends Table, Stock Charts
Sort Consumer Services: Daily, Weekly, Year-to-Date, Market Cap & Trends. Filter Services & Goods stocks list by size: All Large Mid-Range Small |
| 12Stocks.com Consumer Services Stocks Performances & Trends Daily | |||||||||
|
|  The overall Smart Investing & Trading Score is 25 (0-bearish to 100-bullish) which puts Consumer Services sector in short term bearish to neutral trend. The Smart Investing & Trading Score from previous trading session is 8 and an improvement of trend continues.
| ||||||||
Here are the Smart Investing & Trading Scores of the most requested Consumer Services stocks at 12Stocks.com (click stock name for detailed review):
|


| Consider signing up for our daily 12Stocks.com "Best Stocks Newsletter". You will never ever miss a big stock move again! |
| 12Stocks.com: Investing in Consumer Services sector with Stocks | |
|
The following table helps investors and traders sort through current performance and trends (as measured by Smart Investing & Trading Score) of various
stocks in the Consumer Services sector. Quick View: Move mouse or cursor over stock symbol (ticker) to view short-term Technical chart and over stock name to view long term chart. Click on  to add stock symbol to your watchlist and to add stock symbol to your watchlist and  to view watchlist. Click on any ticker or stock name for detailed market intelligence report for that stock. to view watchlist. Click on any ticker or stock name for detailed market intelligence report for that stock. |
12Stocks.com Performance of Stocks in Consumer Services Sector
| Ticker | Stock Name | Watchlist | Category | Recent Price | Smart Investing & Trading Score | Change % | Weekly Change% |
| HSAI | Hesai |   | Auto Parts | 4.86 | 73 | -0.82% | 4.52% |
| ECX | ECARX | | Auto Parts | 1.20 | 42 | 10.09% | 4.35% |
| BLMN | Bloomin | | Restaurants | 21.80 | 32 | 3.66% | 4.31% |
| CCRN | Cross Country | | Staffing | 15.12 | 49 | 2.51% | 4.28% |
| FYBR | Frontier | | Telecom Services | 26.66 | 93 | -0.22% | 4.22% |
| FWONA | Formula One | | Broadcasting | 68.41 | 100 | 0.80% | 4.14% |
| FWONK | Formula One | | Broadcasting | 74.14 | 100 | 0.39% | 4.13% |
| REAL | RealReal | | Retail | 4.31 | 90 | -0.58% | 4.11% |
| UONEK | Urban One | | Broadcasting | 1.68 | 52 | 3.07% | 4.02% |
| TGNA | TEGNA | | Broadcasting | 14.91 | 78 | 1.50% | 3.97% |
| DBI | Designer Brands | | Apparel | 10.05 | 74 | 6.24% | 3.93% |
| BIG | Big Lots | | Retail | 3.48 | 52 | 2.35% | 3.88% |
| CMCSA | Comcast | | Entertainment | 40.03 | 64 | 2.98% | 3.87% |
| FIVE | Five Below | | Retail | 138.13 | 49 | 2.54% | 3.86% |
| FIGS | FIGS | | Apparel Manufacturing | 5.30 | 51 | 2.32% | 3.82% |
| CHGG | Chegg | | Education | 3.83 | 32 | 1.59% | 3.79% |
| BROS | Dutch Bros | | Restaurants | 35.39 | 64 | -0.81% | 3.78% |
| NEWT | Newtek Business | | Services | 13.75 | 100 | 2.54% | 3.77% |
| NCLH | Norwegian Cruise | | Casinos | 16.60 | 50 | 0.91% | 3.75% |
| BOWL | Bowlero | | Leisure | 12.45 | 59 | 2.72% | 3.71% |
| ULTA | Ulta Beauty | | Retail | 395.09 | 49 | 2.47% | 3.49% |
| BKR | Baker Hughes | | Services | 33.48 | 83 | 3.08% | 3.43% |
| DENN | Denny s | | Restaurants | 7.30 | 32 | 4.89% | 3.40% |
| MCW | Mister Car | | Services | 7.03 | 47 | 3.53% | 3.38% |
| ATAT | Atour Lifestyle | | Lodging | 17.81 | 28 | 1.08% | 3.37% |
| For chart view version of above stock list: Chart View ➞ 0 - 25 , 25 - 50 , 50 - 75 , 75 - 100 , 100 - 125 , 125 - 150 , 150 - 175 , 175 - 200 , 200 - 225 , 225 - 250 , 250 - 275 , 275 - 300 , 300 - 325 , 325 - 350 , 350 - 375 , 375 - 400 , 400 - 425 , 425 - 450 , 450 - 475 | ||
 | Click To Change The Sort Order: By Market Cap or Company Size Performance: Year-to-date, Week and Day |  |
|
Get the most comprehensive stock market coverage daily at 12Stocks.com ➞ Best Stocks Today ➞ Best Stocks Weekly ➞ Best Stocks Year-to-Date ➞ Best Stocks Trends ➞  Best Stocks Today 12Stocks.com Best Nasdaq Stocks ➞ Best S&P 500 Stocks ➞ Best Tech Stocks ➞ Best Biotech Stocks ➞ |
| Detailed Overview of Consumer Services Stocks |
| Consumer Services Technical Overview, Leaders & Laggards, Top Consumer Services ETF Funds & Detailed Consumer Services Stocks List, Charts, Trends & More |
| Consumer Services Sector: Technical Analysis, Trends & YTD Performance | |
| Consumer Services sector is composed of stocks
from retail, entertainment, media/publishing, consumer goods
and services subsectors. Consumer Services sector, as represented by XLY, an exchange-traded fund [ETF] that holds basket of Consumer Services stocks (e.g, Walmart, Alibaba) is down by -1.59% and is currently underperforming the overall market by -11.38% year-to-date. Below is a quick view of Technical charts and trends: |
|
 XLY Weekly Chart |
|
| Long Term Trend: Not Good | |
| Medium Term Trend: Not Good | |
 XLY Daily Chart |
|
| Short Term Trend: Very Good | |
| Overall Trend Score: 25 | |
| YTD Performance: -1.59% | |
| **Trend Scores & Views Are Only For Educational Purposes And Not For Investing | |
| 12Stocks.com: Top Performing Consumer Services Sector Stocks | ||||||||||||||||||||||||||||||||||||||||||||||||
 The top performing Consumer Services sector stocks year to date are
Now, more recently, over last week, the top performing Consumer Services sector stocks on the move are


|
||||||||||||||||||||||||||||||||||||||||||||||||
| 12Stocks.com: Investing in Consumer Services Sector using Exchange Traded Funds | |
|
The following table shows list of key exchange traded funds (ETF) that
help investors track Consumer Services Index. For detailed view, check out our ETF Funds section of our website. Quick View: Move mouse or cursor over ETF symbol (ticker) to view short-term Technical chart and over ETF name to view long term chart. Click on ticker or stock name for detailed view. Click on to add stock symbol to your watchlist and to view watchlist. |
12Stocks.com List of ETFs that track Consumer Services Index
| Ticker | ETF Name | Watchlist | Recent Price | Smart Investing & Trading Score | Change % | Week % | Year-to-date % |
| XLY | Consumer Discret Sel | | 175.97 | 25 | 0.56 | 0.24 | -1.59% |
| RTH | Retail | | 200.42 | 32 | 0.79 | 0.6 | 6.48% |
| IYC | Consumer Services | | 78.26 | 8 | -0.36 | -0.92 | 3.29% |
| XRT | Retail | | 77.52 | 100 | 2.24 | 3.43 | 7.19% |
| IYK | Consumer Goods | | 65.97 | 61 | 0.59 | -1.18 | 3.23% |
| UCC | Consumer Services | | 33.50 | 42 | 1.25 | 0.24 | -6.7% |
| RETL | Retail Bull 3X | | 9.76 | 69 | 2.63 | 5.57 | 6.96% |
| RXI | Globl Consumer Discretionary | | 159.55 | 18 | 0.81 | -0.73 | 0.31% |
| SCC | Short Consumer Services | | 15.90 | 68 | -0.93 | -0.14 | 3.78% |
| UGE | Consumer Goods | | 17.74 | 83 | 2.95 | 0.34 | 12.68% |
| 12Stocks.com: Charts, Trends, Fundamental Data and Performances of Consumer Services Stocks | |
|
We now take in-depth look at all Consumer Services stocks including charts, multi-period performances and overall trends (as measured by Smart Investing & Trading Score). One can sort Consumer Services stocks (click link to choose) by Daily, Weekly and by Year-to-Date performances. Also, one can sort by size of the company or by market capitalization. |
| Select Your Default Chart Type: | |||||
| |||||
| Click on stock symbol or name for detailed view. Click on to add stock symbol to your watchlist and to view watchlist. Quick View: Move mouse or cursor over "Daily" to quickly view daily Technical stock chart and over "Weekly" to view weekly Technical stock chart. | |||||

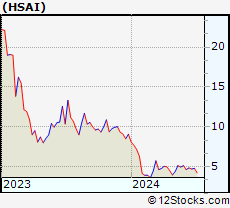 | HSAI Hesai Group |
| Sector: Services & Goods | |
| SubSector: Auto Parts | |
| MarketCap: 1330 Millions | |
| Recent Price: 4.86 Smart Investing & Trading Score: 73 | |
| Day Percent Change: -0.82% Day Change: -0.04 | |
| Week Change: 4.52% Year-to-date Change: -46.5% | |
| HSAI Links: Profile News Message Board | |
| Charts:- Daily , Weekly | |
| Add HSAI to Watchlist: View: Get Complete HSAI Trend Analysis ➞ | |
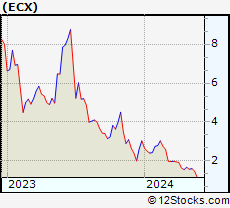 | ECX ECARX Holdings Inc. |
| Sector: Services & Goods | |
| SubSector: Auto Parts | |
| MarketCap: 2270 Millions | |
| Recent Price: 1.20 Smart Investing & Trading Score: 42 | |
| Day Percent Change: 10.09% Day Change: 0.11 | |
| Week Change: 4.35% Year-to-date Change: -60.5% | |
| ECX Links: Profile News Message Board | |
| Charts:- Daily , Weekly | |
| Add ECX to Watchlist: View: Get Complete ECX Trend Analysis ➞ | |
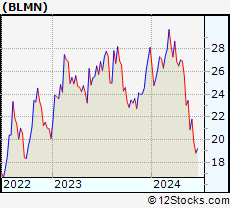 | BLMN Bloomin Brands, Inc. |
| Sector: Services & Goods | |
| SubSector: Restaurants | |
| MarketCap: 503.47 Millions | |
| Recent Price: 21.80 Smart Investing & Trading Score: 32 | |
| Day Percent Change: 3.66% Day Change: 0.77 | |
| Week Change: 4.31% Year-to-date Change: -22.6% | |
| BLMN Links: Profile News Message Board | |
| Charts:- Daily , Weekly | |
| Add BLMN to Watchlist: View: Get Complete BLMN Trend Analysis ➞ | |
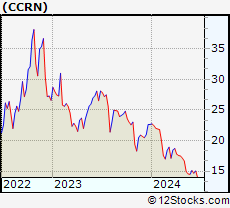 | CCRN Cross Country Healthcare, Inc. |
| Sector: Services & Goods | |
| SubSector: Staffing & Outsourcing Services | |
| MarketCap: 348.328 Millions | |
| Recent Price: 15.12 Smart Investing & Trading Score: 49 | |
| Day Percent Change: 2.51% Day Change: 0.37 | |
| Week Change: 4.28% Year-to-date Change: -33.2% | |
| CCRN Links: Profile News Message Board | |
| Charts:- Daily , Weekly | |
| Add CCRN to Watchlist: View: Get Complete CCRN Trend Analysis ➞ | |
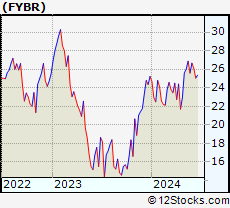 | FYBR Frontier Communications Parent, Inc. |
| Sector: Services & Goods | |
| SubSector: Telecom Services | |
| MarketCap: 4460 Millions | |
| Recent Price: 26.66 Smart Investing & Trading Score: 93 | |
| Day Percent Change: -0.22% Day Change: -0.06 | |
| Week Change: 4.22% Year-to-date Change: 5.7% | |
| FYBR Links: Profile News Message Board | |
| Charts:- Daily , Weekly | |
| Add FYBR to Watchlist: View: Get Complete FYBR Trend Analysis ➞ | |
 | FWONA Formula One Group |
| Sector: Services & Goods | |
| SubSector: Broadcasting - TV | |
| MarketCap: 17485.6 Millions | |
| Recent Price: 68.41 Smart Investing & Trading Score: 100 | |
| Day Percent Change: 0.80% Day Change: 0.54 | |
| Week Change: 4.14% Year-to-date Change: 18.0% | |
| FWONA Links: Profile News Message Board | |
| Charts:- Daily , Weekly | |
| Add FWONA to Watchlist: View: Get Complete FWONA Trend Analysis ➞ | |
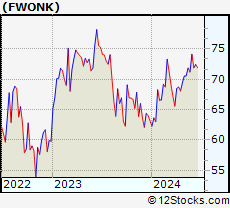 | FWONK Formula One Group |
| Sector: Services & Goods | |
| SubSector: Broadcasting - TV | |
| MarketCap: 4677.53 Millions | |
| Recent Price: 74.14 Smart Investing & Trading Score: 100 | |
| Day Percent Change: 0.39% Day Change: 0.29 | |
| Week Change: 4.13% Year-to-date Change: 17.4% | |
| FWONK Links: Profile News Message Board | |
| Charts:- Daily , Weekly | |
| Add FWONK to Watchlist: View: Get Complete FWONK Trend Analysis ➞ | |
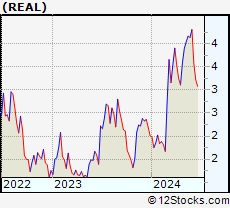 | REAL The RealReal, Inc. |
| Sector: Services & Goods | |
| SubSector: Specialty Retail, Other | |
| MarketCap: 839.344 Millions | |
| Recent Price: 4.31 Smart Investing & Trading Score: 90 | |
| Day Percent Change: -0.58% Day Change: -0.03 | |
| Week Change: 4.11% Year-to-date Change: 114.4% | |
| REAL Links: Profile News Message Board | |
| Charts:- Daily , Weekly | |
| Add REAL to Watchlist: View: Get Complete REAL Trend Analysis ➞ | |
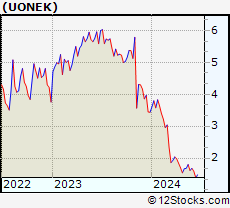 | UONEK Urban One, Inc. |
| Sector: Services & Goods | |
| SubSector: Broadcasting - Radio | |
| MarketCap: 601.795 Millions | |
| Recent Price: 1.68 Smart Investing & Trading Score: 52 | |
| Day Percent Change: 3.07% Day Change: 0.05 | |
| Week Change: 4.02% Year-to-date Change: -51.2% | |
| UONEK Links: Profile News Message Board | |
| Charts:- Daily , Weekly | |
| Add UONEK to Watchlist: View: Get Complete UONEK Trend Analysis ➞ | |
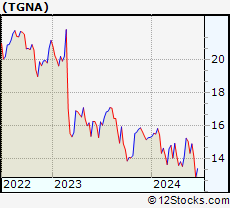 | TGNA TEGNA Inc. |
| Sector: Services & Goods | |
| SubSector: Broadcasting - TV | |
| MarketCap: 2791.83 Millions | |
| Recent Price: 14.91 Smart Investing & Trading Score: 78 | |
| Day Percent Change: 1.50% Day Change: 0.22 | |
| Week Change: 3.97% Year-to-date Change: -2.6% | |
| TGNA Links: Profile News Message Board | |
| Charts:- Daily , Weekly | |
| Add TGNA to Watchlist: View: Get Complete TGNA Trend Analysis ➞ | |
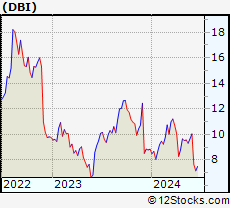 | DBI Designer Brands Inc. |
| Sector: Services & Goods | |
| SubSector: Apparel Stores | |
| MarketCap: 467.308 Millions | |
| Recent Price: 10.05 Smart Investing & Trading Score: 74 | |
| Day Percent Change: 6.24% Day Change: 0.59 | |
| Week Change: 3.93% Year-to-date Change: 13.6% | |
| DBI Links: Profile News Message Board | |
| Charts:- Daily , Weekly | |
| Add DBI to Watchlist: View: Get Complete DBI Trend Analysis ➞ | |
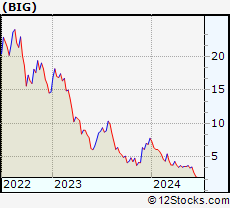 | BIG Big Lots, Inc. |
| Sector: Services & Goods | |
| SubSector: Discount, Variety Stores | |
| MarketCap: 603.572 Millions | |
| Recent Price: 3.48 Smart Investing & Trading Score: 52 | |
| Day Percent Change: 2.35% Day Change: 0.08 | |
| Week Change: 3.88% Year-to-date Change: -55.3% | |
| BIG Links: Profile News Message Board | |
| Charts:- Daily , Weekly | |
| Add BIG to Watchlist: View: Get Complete BIG Trend Analysis ➞ | |
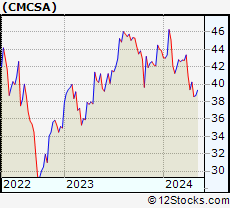 | CMCSA Comcast Corporation |
| Sector: Services & Goods | |
| SubSector: Entertainment - Diversified | |
| MarketCap: 164849 Millions | |
| Recent Price: 40.03 Smart Investing & Trading Score: 64 | |
| Day Percent Change: 2.98% Day Change: 1.16 | |
| Week Change: 3.87% Year-to-date Change: -8.7% | |
| CMCSA Links: Profile News Message Board | |
| Charts:- Daily , Weekly | |
| Add CMCSA to Watchlist: View: Get Complete CMCSA Trend Analysis ➞ | |
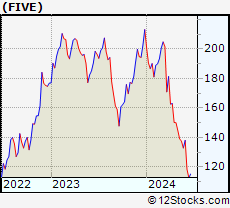 | FIVE Five Below, Inc. |
| Sector: Services & Goods | |
| SubSector: Specialty Retail, Other | |
| MarketCap: 3693.74 Millions | |
| Recent Price: 138.13 Smart Investing & Trading Score: 49 | |
| Day Percent Change: 2.54% Day Change: 3.42 | |
| Week Change: 3.86% Year-to-date Change: -35.2% | |
| FIVE Links: Profile News Message Board | |
| Charts:- Daily , Weekly | |
| Add FIVE to Watchlist: View: Get Complete FIVE Trend Analysis ➞ | |
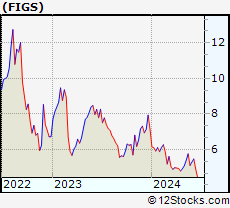 | FIGS FIGS, Inc. |
| Sector: Services & Goods | |
| SubSector: Apparel Manufacturing | |
| MarketCap: 1370 Millions | |
| Recent Price: 5.30 Smart Investing & Trading Score: 51 | |
| Day Percent Change: 2.32% Day Change: 0.12 | |
| Week Change: 3.82% Year-to-date Change: -25.7% | |
| FIGS Links: Profile News Message Board | |
| Charts:- Daily , Weekly | |
| Add FIGS to Watchlist: View: Get Complete FIGS Trend Analysis ➞ | |
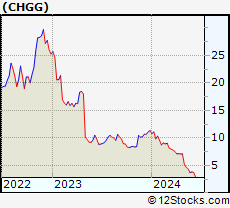 | CHGG Chegg, Inc. |
| Sector: Services & Goods | |
| SubSector: Education & Training Services | |
| MarketCap: 3606.86 Millions | |
| Recent Price: 3.83 Smart Investing & Trading Score: 32 | |
| Day Percent Change: 1.59% Day Change: 0.06 | |
| Week Change: 3.79% Year-to-date Change: -66.3% | |
| CHGG Links: Profile News Message Board | |
| Charts:- Daily , Weekly | |
| Add CHGG to Watchlist: View: Get Complete CHGG Trend Analysis ➞ | |
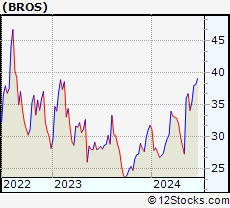 | BROS Dutch Bros Inc. |
| Sector: Services & Goods | |
| SubSector: Restaurants | |
| MarketCap: 4670 Millions | |
| Recent Price: 35.39 Smart Investing & Trading Score: 64 | |
| Day Percent Change: -0.81% Day Change: -0.29 | |
| Week Change: 3.78% Year-to-date Change: 11.5% | |
| BROS Links: Profile News Message Board | |
| Charts:- Daily , Weekly | |
| Add BROS to Watchlist: View: Get Complete BROS Trend Analysis ➞ | |
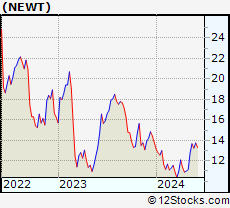 | NEWT Newtek Business Services Corp. |
| Sector: Services & Goods | |
| SubSector: Business Services | |
| MarketCap: 243.982 Millions | |
| Recent Price: 13.75 Smart Investing & Trading Score: 100 | |
| Day Percent Change: 2.54% Day Change: 0.34 | |
| Week Change: 3.77% Year-to-date Change: -0.4% | |
| NEWT Links: Profile News Message Board | |
| Charts:- Daily , Weekly | |
| Add NEWT to Watchlist: View: Get Complete NEWT Trend Analysis ➞ | |
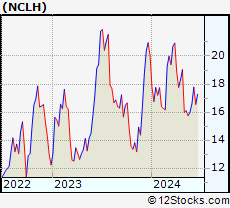 | NCLH Norwegian Cruise Line Holdings Ltd. |
| Sector: Services & Goods | |
| SubSector: Resorts & Casinos | |
| MarketCap: 2895.54 Millions | |
| Recent Price: 16.60 Smart Investing & Trading Score: 50 | |
| Day Percent Change: 0.91% Day Change: 0.15 | |
| Week Change: 3.75% Year-to-date Change: -17.2% | |
| NCLH Links: Profile News Message Board | |
| Charts:- Daily , Weekly | |
| Add NCLH to Watchlist: View: Get Complete NCLH Trend Analysis ➞ | |
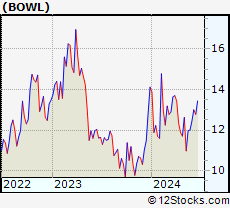 | BOWL Bowlero Corp. |
| Sector: Services & Goods | |
| SubSector: Leisure | |
| MarketCap: 2000 Millions | |
| Recent Price: 12.45 Smart Investing & Trading Score: 59 | |
| Day Percent Change: 2.72% Day Change: 0.33 | |
| Week Change: 3.71% Year-to-date Change: -11.8% | |
| BOWL Links: Profile News Message Board | |
| Charts:- Daily , Weekly | |
| Add BOWL to Watchlist: View: Get Complete BOWL Trend Analysis ➞ | |
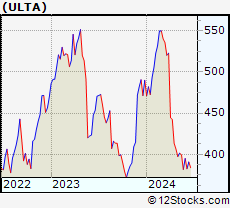 | ULTA Ulta Beauty, Inc. |
| Sector: Services & Goods | |
| SubSector: Specialty Retail, Other | |
| MarketCap: 9429.94 Millions | |
| Recent Price: 395.09 Smart Investing & Trading Score: 49 | |
| Day Percent Change: 2.47% Day Change: 9.51 | |
| Week Change: 3.49% Year-to-date Change: -19.4% | |
| ULTA Links: Profile News Message Board | |
| Charts:- Daily , Weekly | |
| Add ULTA to Watchlist: View: Get Complete ULTA Trend Analysis ➞ | |
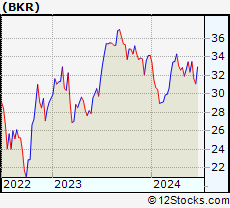 | BKR Baker Hughes Company |
| Sector: Services & Goods | |
| SubSector: Technical Services | |
| MarketCap: 1330 Millions | |
| Recent Price: 33.48 Smart Investing & Trading Score: 83 | |
| Day Percent Change: 3.08% Day Change: 1.00 | |
| Week Change: 3.43% Year-to-date Change: -2.1% | |
| BKR Links: Profile News Message Board | |
| Charts:- Daily , Weekly | |
| Add BKR to Watchlist: View: Get Complete BKR Trend Analysis ➞ | |
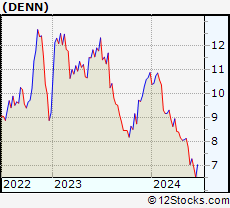 | DENN Denny s Corporation |
| Sector: Services & Goods | |
| SubSector: Restaurants | |
| MarketCap: 367.47 Millions | |
| Recent Price: 7.30 Smart Investing & Trading Score: 32 | |
| Day Percent Change: 4.89% Day Change: 0.34 | |
| Week Change: 3.4% Year-to-date Change: -32.9% | |
| DENN Links: Profile News Message Board | |
| Charts:- Daily , Weekly | |
| Add DENN to Watchlist: View: Get Complete DENN Trend Analysis ➞ | |
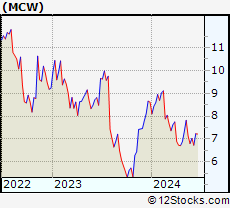 | MCW Mister Car Wash, Inc. |
| Sector: Services & Goods | |
| SubSector: Personal Services | |
| MarketCap: 2790 Millions | |
| Recent Price: 7.03 Smart Investing & Trading Score: 47 | |
| Day Percent Change: 3.53% Day Change: 0.24 | |
| Week Change: 3.38% Year-to-date Change: -18.4% | |
| MCW Links: Profile News Message Board | |
| Charts:- Daily , Weekly | |
| Add MCW to Watchlist: View: Get Complete MCW Trend Analysis ➞ | |
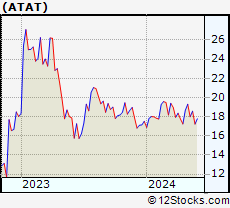 | ATAT Atour Lifestyle Holdings Limited |
| Sector: Services & Goods | |
| SubSector: Lodging | |
| MarketCap: 2120 Millions | |
| Recent Price: 17.81 Smart Investing & Trading Score: 28 | |
| Day Percent Change: 1.08% Day Change: 0.19 | |
| Week Change: 3.37% Year-to-date Change: 1.7% | |
| ATAT Links: Profile News Message Board | |
| Charts:- Daily , Weekly | |
| Add ATAT to Watchlist: View: Get Complete ATAT Trend Analysis ➞ | |
| For tabular summary view of above stock list: Summary View ➞ 0 - 25 , 25 - 50 , 50 - 75 , 75 - 100 , 100 - 125 , 125 - 150 , 150 - 175 , 175 - 200 , 200 - 225 , 225 - 250 , 250 - 275 , 275 - 300 , 300 - 325 , 325 - 350 , 350 - 375 , 375 - 400 , 400 - 425 , 425 - 450 , 450 - 475 | ||
| Click To Change The Sort Order: By Market Cap or Company Size Performance: Year-to-date, Week and Day | |
| Select Chart Type: | ||
|
Best Stocks Today 12Stocks.com |
© 2024 12Stocks.com Terms & Conditions Privacy Contact Us
All Information Provided Only For Education And Not To Be Used For Investing or Trading. See Terms & Conditions


One More Thing ... Get Best Stocks Delivered Daily!
Never Ever Miss A Move With Our Top Ten Stocks Lists
Find Best Stocks In Any Market - Bull or Bear Market
Take A Peek At Our Top Ten Stocks Lists: Daily, Weekly, Year-to-Date & Top Trends
Find Best Stocks In Any Market - Bull or Bear Market
Take A Peek At Our Top Ten Stocks Lists: Daily, Weekly, Year-to-Date & Top Trends
Consumer Services Stocks With Best Up Trends [0-bearish to 100-bullish]: Gap [100], Boqii Holding[100], Nordstrom [100], SunCar Technology[100], Boot Barn[100], Arhaus [100], Best Buy[100], Signet Jewelers[100], Nathan s[100], Barrett Business[100], Newtek Business[100]
Best Consumer Services Stocks Year-to-Date:
U Power[2896.65%], Vroom [1650.37%], Fluent [450.75%], Yatsen Holding[364.73%], Zhihu [244.75%], Sweetgreen [172.12%], Codere Online[156.85%], Faraday Future[152.88%], Research[128.72%], RealReal [114.43%], CAVA [112.86%] Best Consumer Services Stocks This Week:
Gap [38.04%], Chewy [28%], Boqii Holding[22.37%], GameStop [21.79%], Sunnova Energy[21.11%], D-Market Elektronik[20.72%], DICK S[19.83%], Burlington Stores[19.8%], Red Robin[19.29%], Best Buy[18.63%], Traeger [18%] Best Consumer Services Stocks Daily:
Gap [28.60%], Penn National[19.62%], Slair Broadcast[12.08%], Caesars Entertainment[11.65%], Conn s[10.49%], ECARX [10.09%], Yunji [9.95%], Olaplex [9.88%], IHS Holding[8.96%], Stitch Fix[8.81%], Boqii Holding[8.78%]