
 Login Sign Up


| |||||
 |  | ||||

| 12Stocks.com Market Intelligence |
Best Consumer Services Stocks
| In a hurry? Services & Goods Stocks: Performance Trends Table, Stock Charts
Sort Consumer Services: Daily, Weekly, Year-to-Date, Market Cap & Trends. Filter Services & Goods stocks list by size: All Large Mid-Range Small |
| 12Stocks.com Consumer Services Stocks Performances & Trends Daily | |||||||||
|
|  The overall Smart Investing & Trading Score is 25 (0-bearish to 100-bullish) which puts Consumer Services sector in short term bearish to neutral trend. The Smart Investing & Trading Score from previous trading session is 8 and an improvement of trend continues.
| ||||||||
Here are the Smart Investing & Trading Scores of the most requested Consumer Services stocks at 12Stocks.com (click stock name for detailed review):
|


| Consider signing up for our daily 12Stocks.com "Best Stocks Newsletter". You will never ever miss a big stock move again! |
| 12Stocks.com: Investing in Consumer Services sector with Stocks | |
|
The following table helps investors and traders sort through current performance and trends (as measured by Smart Investing & Trading Score) of various
stocks in the Consumer Services sector. Quick View: Move mouse or cursor over stock symbol (ticker) to view short-term Technical chart and over stock name to view long term chart. Click on  to add stock symbol to your watchlist and to add stock symbol to your watchlist and  to view watchlist. Click on any ticker or stock name for detailed market intelligence report for that stock. to view watchlist. Click on any ticker or stock name for detailed market intelligence report for that stock. |
12Stocks.com Performance of Stocks in Consumer Services Sector
| Ticker | Stock Name | Watchlist | Category | Recent Price | Smart Investing & Trading Score | Change % | Weekly Change% |
| KFY | Korn Ferry |   | Staffing | 65.94 | 75 | 0.53% | -0.89% |
| TSQ | Townsquare Media | | Broadcasting | 11.01 | 44 | 0.55% | -0.90% |
| FUN | Cedar Fair | | Entertainment | 43.43 | 78 | 2.31% | -0.91% |
| MOND | Mondee | | Travel Services | 2.16 | 10 | -3.14% | -0.92% |
| ICFI | ICF | | Services | 142.75 | 32 | 2.36% | -0.97% |
| TLYS | Tilly s | | Apparel | 5.77 | 20 | 0.00% | -1.03% |
| IPG | Interpublic | | Advertising | 31.37 | 73 | 1.88% | -1.04% |
| QGEN | QIAGEN N.V | | Research | 43.26 | 76 | 1.45% | -1.07% |
| KBR | KBR | | Services | 65.66 | 61 | 1.25% | -1.07% |
| ROL | Rollins | | Services | 45.69 | 43 | -0.37% | -1.08% |
| INSW | Seaways | | Services | 64.42 | 83 | -0.85% | -1.09% |
| DFIN | Donnelley Financial | | Services | 60.96 | 18 | 1.97% | -1.09% |
| KR | Kroger Co | | Grocery | 52.37 | 51 | 0.75% | -1.17% |
| QRTEP | Qurate Retail | | Internet Retail | 48.86 | 20 | -2.48% | -1.17% |
| PK | Park Hotels | | Lodging | 15.86 | 25 | 1.99% | -1.18% |
| STN | Stantec | | Services | 80.68 | 35 | 2.36% | -1.19% |
| STRA | Strategic Education | | Education | 113.42 | 49 | -0.26% | -1.20% |
| FC | Franklin Covey | | Education | 37.00 | 17 | 0.84% | -1.20% |
| EXPO | Exponent | | Services | 95.12 | 76 | 1.15% | -1.20% |
| NSSC | Napco Security | | Security | 49.65 | 68 | -4.17% | -1.21% |
| LAD | Lithia Motors | | Automobile | 253.14 | 27 | 0.54% | -1.25% |
| CRMT | America s | | Automobile | 60.27 | 35 | -2.35% | -1.26% |
| VLGEA | Village Super | | Grocery | 30.40 | 68 | -0.69% | -1.27% |
| MUSA | Murphy USA | | Retail | 438.75 | 68 | 1.73% | -1.28% |
| HLT | Hilton Worldwide | | Lodging | 200.60 | 25 | 2.07% | -1.30% |
| For chart view version of above stock list: Chart View ➞ 0 - 25 , 25 - 50 , 50 - 75 , 75 - 100 , 100 - 125 , 125 - 150 , 150 - 175 , 175 - 200 , 200 - 225 , 225 - 250 , 250 - 275 , 275 - 300 , 300 - 325 , 325 - 350 , 350 - 375 , 375 - 400 , 400 - 425 , 425 - 450 , 450 - 475 | ||
 | Click To Change The Sort Order: By Market Cap or Company Size Performance: Year-to-date, Week and Day |  |
|
Get the most comprehensive stock market coverage daily at 12Stocks.com ➞ Best Stocks Today ➞ Best Stocks Weekly ➞ Best Stocks Year-to-Date ➞ Best Stocks Trends ➞  Best Stocks Today 12Stocks.com Best Nasdaq Stocks ➞ Best S&P 500 Stocks ➞ Best Tech Stocks ➞ Best Biotech Stocks ➞ |
| Detailed Overview of Consumer Services Stocks |
| Consumer Services Technical Overview, Leaders & Laggards, Top Consumer Services ETF Funds & Detailed Consumer Services Stocks List, Charts, Trends & More |
| Consumer Services Sector: Technical Analysis, Trends & YTD Performance | |
| Consumer Services sector is composed of stocks
from retail, entertainment, media/publishing, consumer goods
and services subsectors. Consumer Services sector, as represented by XLY, an exchange-traded fund [ETF] that holds basket of Consumer Services stocks (e.g, Walmart, Alibaba) is down by -1.59% and is currently underperforming the overall market by -11.38% year-to-date. Below is a quick view of Technical charts and trends: |
|
 XLY Weekly Chart |
|
| Long Term Trend: Not Good | |
| Medium Term Trend: Not Good | |
 XLY Daily Chart |
|
| Short Term Trend: Very Good | |
| Overall Trend Score: 25 | |
| YTD Performance: -1.59% | |
| **Trend Scores & Views Are Only For Educational Purposes And Not For Investing | |
| 12Stocks.com: Top Performing Consumer Services Sector Stocks | ||||||||||||||||||||||||||||||||||||||||||||||||
 The top performing Consumer Services sector stocks year to date are
Now, more recently, over last week, the top performing Consumer Services sector stocks on the move are


|
||||||||||||||||||||||||||||||||||||||||||||||||
| 12Stocks.com: Investing in Consumer Services Sector using Exchange Traded Funds | |
|
The following table shows list of key exchange traded funds (ETF) that
help investors track Consumer Services Index. For detailed view, check out our ETF Funds section of our website. Quick View: Move mouse or cursor over ETF symbol (ticker) to view short-term Technical chart and over ETF name to view long term chart. Click on ticker or stock name for detailed view. Click on to add stock symbol to your watchlist and to view watchlist. |
12Stocks.com List of ETFs that track Consumer Services Index
| Ticker | ETF Name | Watchlist | Recent Price | Smart Investing & Trading Score | Change % | Week % | Year-to-date % |
| XLY | Consumer Discret Sel | | 175.97 | 25 | 0.56 | 0.24 | -1.59% |
| RTH | Retail | | 200.42 | 32 | 0.79 | 0.6 | 6.48% |
| IYC | Consumer Services | | 78.26 | 8 | -0.36 | -0.92 | 3.29% |
| XRT | Retail | | 77.52 | 100 | 2.24 | 3.43 | 7.19% |
| IYK | Consumer Goods | | 65.97 | 61 | 0.59 | -1.18 | 3.23% |
| UCC | Consumer Services | | 33.50 | 42 | 1.25 | 0.24 | -6.7% |
| RETL | Retail Bull 3X | | 9.76 | 69 | 2.63 | 5.57 | 6.96% |
| RXI | Globl Consumer Discretionary | | 159.55 | 18 | 0.81 | -0.73 | 0.31% |
| SCC | Short Consumer Services | | 15.90 | 68 | -0.93 | -0.14 | 3.78% |
| UGE | Consumer Goods | | 17.74 | 83 | 2.95 | 0.34 | 12.68% |
| 12Stocks.com: Charts, Trends, Fundamental Data and Performances of Consumer Services Stocks | |
|
We now take in-depth look at all Consumer Services stocks including charts, multi-period performances and overall trends (as measured by Smart Investing & Trading Score). One can sort Consumer Services stocks (click link to choose) by Daily, Weekly and by Year-to-Date performances. Also, one can sort by size of the company or by market capitalization. |
| Select Your Default Chart Type: | |||||
| |||||
| Click on stock symbol or name for detailed view. Click on to add stock symbol to your watchlist and to view watchlist. Quick View: Move mouse or cursor over "Daily" to quickly view daily Technical stock chart and over "Weekly" to view weekly Technical stock chart. | |||||

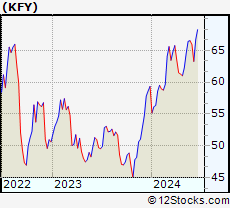 | KFY Korn Ferry |
| Sector: Services & Goods | |
| SubSector: Staffing & Outsourcing Services | |
| MarketCap: 1534.28 Millions | |
| Recent Price: 65.94 Smart Investing & Trading Score: 75 | |
| Day Percent Change: 0.53% Day Change: 0.35 | |
| Week Change: -0.89% Year-to-date Change: 11.1% | |
| KFY Links: Profile News Message Board | |
| Charts:- Daily , Weekly | |
| Add KFY to Watchlist: View: Get Complete KFY Trend Analysis ➞ | |
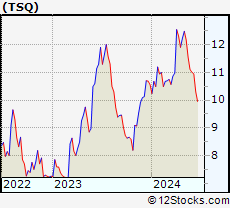 | TSQ Townsquare Media, Inc. |
| Sector: Services & Goods | |
| SubSector: Broadcasting - Radio | |
| MarketCap: 101.795 Millions | |
| Recent Price: 11.01 Smart Investing & Trading Score: 44 | |
| Day Percent Change: 0.55% Day Change: 0.06 | |
| Week Change: -0.9% Year-to-date Change: 4.3% | |
| TSQ Links: Profile News Message Board | |
| Charts:- Daily , Weekly | |
| Add TSQ to Watchlist: View: Get Complete TSQ Trend Analysis ➞ | |
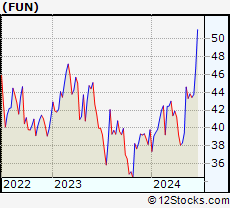 | FUN Cedar Fair, L.P. |
| Sector: Services & Goods | |
| SubSector: General Entertainment | |
| MarketCap: 1440.49 Millions | |
| Recent Price: 43.43 Smart Investing & Trading Score: 78 | |
| Day Percent Change: 2.31% Day Change: 0.98 | |
| Week Change: -0.91% Year-to-date Change: 9.1% | |
| FUN Links: Profile News Message Board | |
| Charts:- Daily , Weekly | |
| Add FUN to Watchlist: View: Get Complete FUN Trend Analysis ➞ | |
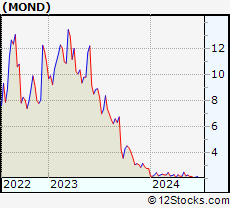 | MOND Mondee Holdings, Inc. |
| Sector: Services & Goods | |
| SubSector: Travel Services | |
| MarketCap: 744 Millions | |
| Recent Price: 2.16 Smart Investing & Trading Score: 10 | |
| Day Percent Change: -3.14% Day Change: -0.07 | |
| Week Change: -0.92% Year-to-date Change: -22.3% | |
| MOND Links: Profile News Message Board | |
| Charts:- Daily , Weekly | |
| Add MOND to Watchlist: View: Get Complete MOND Trend Analysis ➞ | |
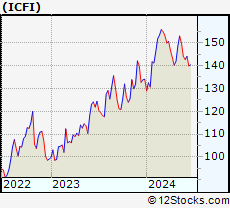 | ICFI ICF International, Inc. |
| Sector: Services & Goods | |
| SubSector: Management Services | |
| MarketCap: 1218.75 Millions | |
| Recent Price: 142.75 Smart Investing & Trading Score: 32 | |
| Day Percent Change: 2.36% Day Change: 3.29 | |
| Week Change: -0.97% Year-to-date Change: 6.5% | |
| ICFI Links: Profile News Message Board | |
| Charts:- Daily , Weekly | |
| Add ICFI to Watchlist: View: Get Complete ICFI Trend Analysis ➞ | |
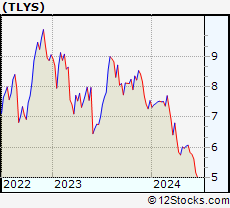 | TLYS Tilly s, Inc. |
| Sector: Services & Goods | |
| SubSector: Apparel Stores | |
| MarketCap: 127.408 Millions | |
| Recent Price: 5.77 Smart Investing & Trading Score: 20 | |
| Day Percent Change: 0.00% Day Change: 0.00 | |
| Week Change: -1.03% Year-to-date Change: -23.5% | |
| TLYS Links: Profile News Message Board | |
| Charts:- Daily , Weekly | |
| Add TLYS to Watchlist: View: Get Complete TLYS Trend Analysis ➞ | |
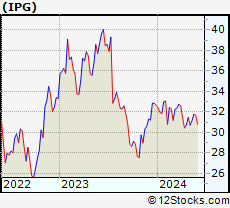 | IPG The Interpublic Group of Companies, Inc. |
| Sector: Services & Goods | |
| SubSector: Advertising Agencies | |
| MarketCap: 5730.55 Millions | |
| Recent Price: 31.37 Smart Investing & Trading Score: 73 | |
| Day Percent Change: 1.88% Day Change: 0.58 | |
| Week Change: -1.04% Year-to-date Change: -3.9% | |
| IPG Links: Profile News Message Board | |
| Charts:- Daily , Weekly | |
| Add IPG to Watchlist: View: Get Complete IPG Trend Analysis ➞ | |
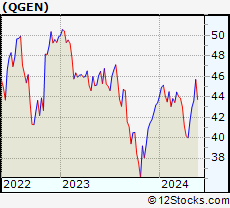 | QGEN QIAGEN N.V. |
| Sector: Services & Goods | |
| SubSector: Research Services | |
| MarketCap: 8698.94 Millions | |
| Recent Price: 43.26 Smart Investing & Trading Score: 76 | |
| Day Percent Change: 1.45% Day Change: 0.62 | |
| Week Change: -1.07% Year-to-date Change: -0.4% | |
| QGEN Links: Profile News Message Board | |
| Charts:- Daily , Weekly | |
| Add QGEN to Watchlist: View: Get Complete QGEN Trend Analysis ➞ | |
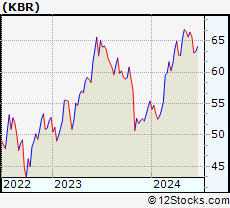 | KBR KBR, Inc. |
| Sector: Services & Goods | |
| SubSector: Technical Services | |
| MarketCap: 2526.1 Millions | |
| Recent Price: 65.66 Smart Investing & Trading Score: 61 | |
| Day Percent Change: 1.25% Day Change: 0.81 | |
| Week Change: -1.07% Year-to-date Change: 18.5% | |
| KBR Links: Profile News Message Board | |
| Charts:- Daily , Weekly | |
| Add KBR to Watchlist: View: Get Complete KBR Trend Analysis ➞ | |
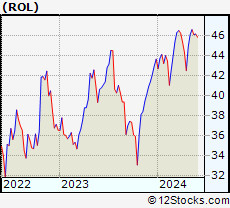 | ROL Rollins, Inc. |
| Sector: Services & Goods | |
| SubSector: Business Services | |
| MarketCap: 12827.4 Millions | |
| Recent Price: 45.69 Smart Investing & Trading Score: 43 | |
| Day Percent Change: -0.37% Day Change: -0.17 | |
| Week Change: -1.08% Year-to-date Change: 4.6% | |
| ROL Links: Profile News Message Board | |
| Charts:- Daily , Weekly | |
| Add ROL to Watchlist: View: Get Complete ROL Trend Analysis ➞ | |
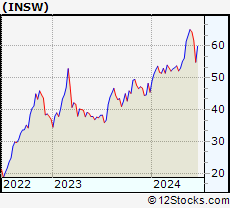 | INSW International Seaways, Inc. |
| Sector: Services & Goods | |
| SubSector: Business Services | |
| MarketCap: 521.582 Millions | |
| Recent Price: 64.42 Smart Investing & Trading Score: 83 | |
| Day Percent Change: -0.85% Day Change: -0.55 | |
| Week Change: -1.09% Year-to-date Change: 41.6% | |
| INSW Links: Profile News Message Board | |
| Charts:- Daily , Weekly | |
| Add INSW to Watchlist: View: Get Complete INSW Trend Analysis ➞ | |
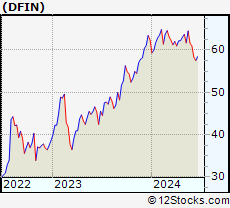 | DFIN Donnelley Financial Solutions, Inc. |
| Sector: Services & Goods | |
| SubSector: Business Services | |
| MarketCap: 229.882 Millions | |
| Recent Price: 60.96 Smart Investing & Trading Score: 18 | |
| Day Percent Change: 1.97% Day Change: 1.18 | |
| Week Change: -1.09% Year-to-date Change: -2.3% | |
| DFIN Links: Profile News Message Board | |
| Charts:- Daily , Weekly | |
| Add DFIN to Watchlist: View: Get Complete DFIN Trend Analysis ➞ | |
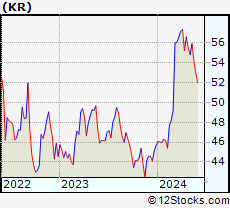 | KR The Kroger Co. |
| Sector: Services & Goods | |
| SubSector: Grocery Stores | |
| MarketCap: 26718.5 Millions | |
| Recent Price: 52.37 Smart Investing & Trading Score: 51 | |
| Day Percent Change: 0.75% Day Change: 0.39 | |
| Week Change: -1.17% Year-to-date Change: 14.6% | |
| KR Links: Profile News Message Board | |
| Charts:- Daily , Weekly | |
| Add KR to Watchlist: View: Get Complete KR Trend Analysis ➞ | |
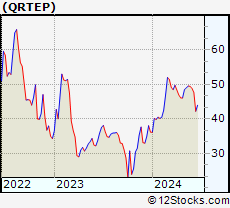 | QRTEP Qurate Retail, Inc. |
| Sector: Services & Goods | |
| SubSector: Internet Retail | |
| MarketCap: 29027 Millions | |
| Recent Price: 48.86 Smart Investing & Trading Score: 20 | |
| Day Percent Change: -2.48% Day Change: -1.24 | |
| Week Change: -1.17% Year-to-date Change: 35.2% | |
| QRTEP Links: Profile News Message Board | |
| Charts:- Daily , Weekly | |
| Add QRTEP to Watchlist: View: Get Complete QRTEP Trend Analysis ➞ | |
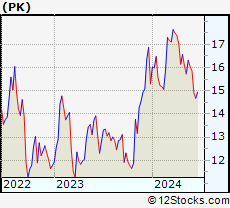 | PK Park Hotels & Resorts Inc. |
| Sector: Services & Goods | |
| SubSector: Lodging | |
| MarketCap: 2221.06 Millions | |
| Recent Price: 15.86 Smart Investing & Trading Score: 25 | |
| Day Percent Change: 1.99% Day Change: 0.31 | |
| Week Change: -1.18% Year-to-date Change: 3.7% | |
| PK Links: Profile News Message Board | |
| Charts:- Daily , Weekly | |
| Add PK to Watchlist: View: Get Complete PK Trend Analysis ➞ | |
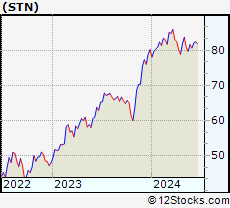 | STN Stantec Inc. |
| Sector: Services & Goods | |
| SubSector: Business Services | |
| MarketCap: 2855.92 Millions | |
| Recent Price: 80.68 Smart Investing & Trading Score: 35 | |
| Day Percent Change: 2.36% Day Change: 1.86 | |
| Week Change: -1.19% Year-to-date Change: 0.6% | |
| STN Links: Profile News Message Board | |
| Charts:- Daily , Weekly | |
| Add STN to Watchlist: View: Get Complete STN Trend Analysis ➞ | |
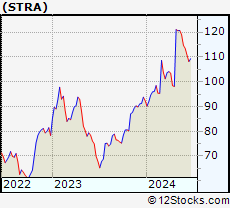 | STRA Strategic Education, Inc. |
| Sector: Services & Goods | |
| SubSector: Education & Training Services | |
| MarketCap: 2621.56 Millions | |
| Recent Price: 113.42 Smart Investing & Trading Score: 49 | |
| Day Percent Change: -0.26% Day Change: -0.29 | |
| Week Change: -1.2% Year-to-date Change: 22.8% | |
| STRA Links: Profile News Message Board | |
| Charts:- Daily , Weekly | |
| Add STRA to Watchlist: View: Get Complete STRA Trend Analysis ➞ | |
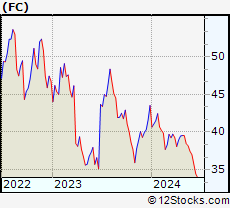 | FC Franklin Covey Co. |
| Sector: Services & Goods | |
| SubSector: Education & Training Services | |
| MarketCap: 243.306 Millions | |
| Recent Price: 37.00 Smart Investing & Trading Score: 17 | |
| Day Percent Change: 0.84% Day Change: 0.31 | |
| Week Change: -1.2% Year-to-date Change: -15.0% | |
| FC Links: Profile News Message Board | |
| Charts:- Daily , Weekly | |
| Add FC to Watchlist: View: Get Complete FC Trend Analysis ➞ | |
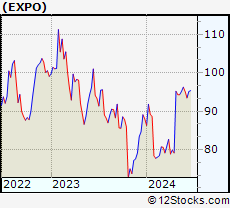 | EXPO Exponent, Inc. |
| Sector: Services & Goods | |
| SubSector: Management Services | |
| MarketCap: 3605.95 Millions | |
| Recent Price: 95.12 Smart Investing & Trading Score: 76 | |
| Day Percent Change: 1.15% Day Change: 1.08 | |
| Week Change: -1.2% Year-to-date Change: 8.0% | |
| EXPO Links: Profile News Message Board | |
| Charts:- Daily , Weekly | |
| Add EXPO to Watchlist: View: Get Complete EXPO Trend Analysis ➞ | |
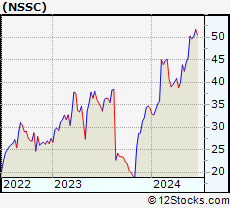 | NSSC Napco Security Technologies, Inc. |
| Sector: Services & Goods | |
| SubSector: Security & Protection Services | |
| MarketCap: 339.103 Millions | |
| Recent Price: 49.65 Smart Investing & Trading Score: 68 | |
| Day Percent Change: -4.17% Day Change: -2.16 | |
| Week Change: -1.21% Year-to-date Change: 45.0% | |
| NSSC Links: Profile News Message Board | |
| Charts:- Daily , Weekly | |
| Add NSSC to Watchlist: View: Get Complete NSSC Trend Analysis ➞ | |
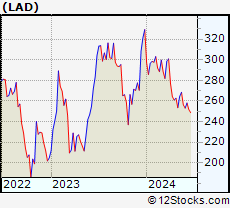 | LAD Lithia Motors, Inc. |
| Sector: Services & Goods | |
| SubSector: Auto Dealerships | |
| MarketCap: 1727.21 Millions | |
| Recent Price: 253.14 Smart Investing & Trading Score: 27 | |
| Day Percent Change: 0.54% Day Change: 1.35 | |
| Week Change: -1.25% Year-to-date Change: -23.1% | |
| LAD Links: Profile News Message Board | |
| Charts:- Daily , Weekly | |
| Add LAD to Watchlist: View: Get Complete LAD Trend Analysis ➞ | |
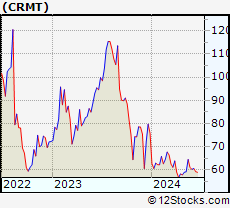 | CRMT America s Car-Mart, Inc. |
| Sector: Services & Goods | |
| SubSector: Auto Dealerships | |
| MarketCap: 329.921 Millions | |
| Recent Price: 60.27 Smart Investing & Trading Score: 35 | |
| Day Percent Change: -2.35% Day Change: -1.45 | |
| Week Change: -1.26% Year-to-date Change: -20.5% | |
| CRMT Links: Profile News Message Board | |
| Charts:- Daily , Weekly | |
| Add CRMT to Watchlist: View: Get Complete CRMT Trend Analysis ➞ | |
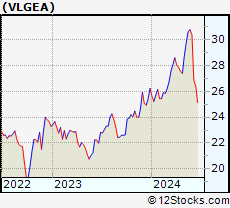 | VLGEA Village Super Market, Inc. |
| Sector: Services & Goods | |
| SubSector: Grocery Stores | |
| MarketCap: 222.375 Millions | |
| Recent Price: 30.40 Smart Investing & Trading Score: 68 | |
| Day Percent Change: -0.69% Day Change: -0.21 | |
| Week Change: -1.27% Year-to-date Change: 15.9% | |
| VLGEA Links: Profile News Message Board | |
| Charts:- Daily , Weekly | |
| Add VLGEA to Watchlist: View: Get Complete VLGEA Trend Analysis ➞ | |
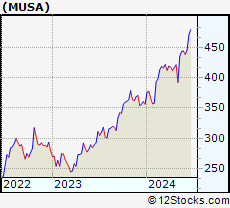 | MUSA Murphy USA Inc. |
| Sector: Services & Goods | |
| SubSector: Specialty Retail, Other | |
| MarketCap: 3133.14 Millions | |
| Recent Price: 438.75 Smart Investing & Trading Score: 68 | |
| Day Percent Change: 1.73% Day Change: 7.46 | |
| Week Change: -1.28% Year-to-date Change: 23.1% | |
| MUSA Links: Profile News Message Board | |
| Charts:- Daily , Weekly | |
| Add MUSA to Watchlist: View: Get Complete MUSA Trend Analysis ➞ | |
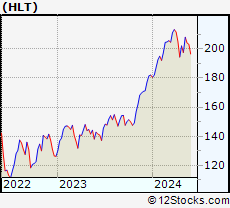 | HLT Hilton Worldwide Holdings Inc. |
| Sector: Services & Goods | |
| SubSector: Lodging | |
| MarketCap: 18064.6 Millions | |
| Recent Price: 200.60 Smart Investing & Trading Score: 25 | |
| Day Percent Change: 2.07% Day Change: 4.07 | |
| Week Change: -1.3% Year-to-date Change: 10.2% | |
| HLT Links: Profile News Message Board | |
| Charts:- Daily , Weekly | |
| Add HLT to Watchlist: View: Get Complete HLT Trend Analysis ➞ | |
| For tabular summary view of above stock list: Summary View ➞ 0 - 25 , 25 - 50 , 50 - 75 , 75 - 100 , 100 - 125 , 125 - 150 , 150 - 175 , 175 - 200 , 200 - 225 , 225 - 250 , 250 - 275 , 275 - 300 , 300 - 325 , 325 - 350 , 350 - 375 , 375 - 400 , 400 - 425 , 425 - 450 , 450 - 475 | ||
| Click To Change The Sort Order: By Market Cap or Company Size Performance: Year-to-date, Week and Day | |
| Select Chart Type: | ||
|
Best Stocks Today 12Stocks.com |
© 2024 12Stocks.com Terms & Conditions Privacy Contact Us
All Information Provided Only For Education And Not To Be Used For Investing or Trading. See Terms & Conditions


One More Thing ... Get Best Stocks Delivered Daily!
Never Ever Miss A Move With Our Top Ten Stocks Lists
Find Best Stocks In Any Market - Bull or Bear Market
Take A Peek At Our Top Ten Stocks Lists: Daily, Weekly, Year-to-Date & Top Trends
Find Best Stocks In Any Market - Bull or Bear Market
Take A Peek At Our Top Ten Stocks Lists: Daily, Weekly, Year-to-Date & Top Trends
Consumer Services Stocks With Best Up Trends [0-bearish to 100-bullish]: Gap [100], Boqii Holding[100], Nordstrom [100], SunCar Technology[100], Boot Barn[100], Arhaus [100], Best Buy[100], Signet Jewelers[100], Nathan s[100], Barrett Business[100], Newtek Business[100]
Best Consumer Services Stocks Year-to-Date:
U Power[2896.65%], Vroom [1650.37%], Fluent [450.75%], Yatsen Holding[364.73%], Zhihu [244.75%], Sweetgreen [172.12%], Codere Online[156.85%], Faraday Future[152.88%], Research[128.72%], RealReal [114.43%], CAVA [112.86%] Best Consumer Services Stocks This Week:
Gap [38.04%], Chewy [28%], Boqii Holding[22.37%], GameStop [21.79%], Sunnova Energy[21.11%], D-Market Elektronik[20.72%], DICK S[19.83%], Burlington Stores[19.8%], Red Robin[19.29%], Best Buy[18.63%], Traeger [18%] Best Consumer Services Stocks Daily:
Gap [28.60%], Penn National[19.62%], Slair Broadcast[12.08%], Caesars Entertainment[11.65%], Conn s[10.49%], ECARX [10.09%], Yunji [9.95%], Olaplex [9.88%], IHS Holding[8.96%], Stitch Fix[8.81%], Boqii Holding[8.78%]