
 Login Sign Up


| |||||
 |  | ||||

| 12Stocks.com Market Intelligence |
Best Consumer Services Stocks
| In a hurry? Services & Goods Stocks: Performance Trends Table, Stock Charts
Sort Consumer Services: Daily, Weekly, Year-to-Date, Market Cap & Trends. Filter Services & Goods stocks list by size: All Large Mid-Range Small |
| 12Stocks.com Consumer Services Stocks Performances & Trends Daily | |||||||||
|
|  The overall Smart Investing & Trading Score is 40 (0-bearish to 100-bullish) which puts Consumer Services sector in short term bearish to neutral trend. The Smart Investing & Trading Score from previous trading session is 47 and a deterioration of trend continues.
| ||||||||
Here are the Smart Investing & Trading Scores of the most requested Consumer Services stocks at 12Stocks.com (click stock name for detailed review):
|


| Consider signing up for our daily 12Stocks.com "Best Stocks Newsletter". You will never ever miss a big stock move again! |
| 12Stocks.com: Investing in Consumer Services sector with Stocks | |
|
The following table helps investors and traders sort through current performance and trends (as measured by Smart Investing & Trading Score) of various
stocks in the Consumer Services sector. Quick View: Move mouse or cursor over stock symbol (ticker) to view short-term Technical chart and over stock name to view long term chart. Click on  to add stock symbol to your watchlist and to add stock symbol to your watchlist and  to view watchlist. Click on any ticker or stock name for detailed market intelligence report for that stock. to view watchlist. Click on any ticker or stock name for detailed market intelligence report for that stock. |
12Stocks.com Performance of Stocks in Consumer Services Sector
| Ticker | Stock Name | Watchlist | Category | Recent Price | Smart Investing & Trading Score | Change % | Weekly Change% |
| NXST | Nexstar Media |   | Broadcasting | 169.56 | 68 | -0.57% | -1.59% |
| ASPS | Altisource Portfolio | | Services | 1.81 | 20 | -4.23% | -1.63% |
| LOW | Lowe s | | Retail | 231.11 | 22 | -0.50% | -1.67% |
| FOXA | Fox | | Entertainment | 32.85 | 63 | 0.52% | -1.68% |
| FND | Floor & Decor | | Retail | 118.94 | 37 | 0.00% | -1.72% |
| DXPE | DXP Enterprises | | Equipment | 51.11 | 75 | 0.31% | -1.73% |
| PLAY | Dave & Buster s Entertainment | | Restaurants | 52.80 | 32 | -1.80% | -1.79% |
| CARG | CarGurus | | Automobile | 23.78 | 63 | -0.08% | -1.80% |
| CZR | Caesars Entertainment | | Casinos | 35.52 | 10 | 0.59% | -1.82% |
| TBLA | Taboola.com | | Internet Content & Information | 4.32 | 53 | -0.46% | -1.82% |
| TGT | Target | | Retail | 160.13 | 54 | -0.32% | -1.84% |
| HLT | Hilton Worldwide | | Lodging | 204.19 | 60 | -0.78% | -1.87% |
| RBA | Ritchie Bros. | | Services | 74.97 | 27 | -0.12% | -1.97% |
| MSM | MSC Industrial | | Equipment | 91.15 | 10 | -1.09% | -1.98% |
| WSM | Williams-Sonoma | | Retail | 309.50 | 58 | -1.14% | -2.04% |
| AZO | AutoZone | | Auto Parts | 2917.50 | 18 | 0.57% | -2.07% |
| H | Hyatt Hotels | | Lodging | 149.05 | 7 | -0.08% | -2.07% |
| ICFI | ICF | | Services | 149.80 | 57 | 2.17% | -2.10% |
| KELYA | Kelly Services | | Staffing | 22.72 | 18 | -0.74% | -2.11% |
| WH | Wyndham Hotels | | Lodging | 70.99 | 35 | -0.55% | -2.14% |
| FAST | Fastenal | | Equipment | 66.42 | 0 | -0.58% | -2.15% |
| PSO | Pearson | | Publishing | 12.20 | 0 | -0.08% | -2.17% |
| NCLH | Norwegian Cruise | | Casinos | 15.75 | 32 | -0.88% | -2.17% |
| CHUY | Chuy s | | Restaurants | 27.47 | 0 | -2.55% | -2.24% |
| RUSHB | Rush Enterprises | | Automobile | 42.67 | 20 | 0.52% | -2.25% |
| For chart view version of above stock list: Chart View ➞ 0 - 25 , 25 - 50 , 50 - 75 , 75 - 100 , 100 - 125 , 125 - 150 , 150 - 175 , 175 - 200 , 200 - 225 , 225 - 250 , 250 - 275 , 275 - 300 , 300 - 325 , 325 - 350 , 350 - 375 , 375 - 400 , 400 - 425 , 425 - 450 , 450 - 475 | ||
 | Click To Change The Sort Order: By Market Cap or Company Size Performance: Year-to-date, Week and Day |  |
|
Get the most comprehensive stock market coverage daily at 12Stocks.com ➞ Best Stocks Today ➞ Best Stocks Weekly ➞ Best Stocks Year-to-Date ➞ Best Stocks Trends ➞  Best Stocks Today 12Stocks.com Best Nasdaq Stocks ➞ Best S&P 500 Stocks ➞ Best Tech Stocks ➞ Best Biotech Stocks ➞ |
| Detailed Overview of Consumer Services Stocks |
| Consumer Services Technical Overview, Leaders & Laggards, Top Consumer Services ETF Funds & Detailed Consumer Services Stocks List, Charts, Trends & More |
| Consumer Services Sector: Technical Analysis, Trends & YTD Performance | |
| Consumer Services sector is composed of stocks
from retail, entertainment, media/publishing, consumer goods
and services subsectors. Consumer Services sector, as represented by XLY, an exchange-traded fund [ETF] that holds basket of Consumer Services stocks (e.g, Walmart, Alibaba) is down by -0.06% and is currently underperforming the overall market by -10.63% year-to-date. Below is a quick view of Technical charts and trends: |
|
 XLY Weekly Chart |
|
| Long Term Trend: Not Good | |
| Medium Term Trend: Very Good | |
 XLY Daily Chart |
|
| Short Term Trend: Good | |
| Overall Trend Score: 40 | |
| YTD Performance: -0.06% | |
| **Trend Scores & Views Are Only For Educational Purposes And Not For Investing | |
| 12Stocks.com: Top Performing Consumer Services Sector Stocks | ||||||||||||||||||||||||||||||||||||||||||||||||
 The top performing Consumer Services sector stocks year to date are
Now, more recently, over last week, the top performing Consumer Services sector stocks on the move are


|
||||||||||||||||||||||||||||||||||||||||||||||||
| 12Stocks.com: Investing in Consumer Services Sector using Exchange Traded Funds | |
|
The following table shows list of key exchange traded funds (ETF) that
help investors track Consumer Services Index. For detailed view, check out our ETF Funds section of our website. Quick View: Move mouse or cursor over ETF symbol (ticker) to view short-term Technical chart and over ETF name to view long term chart. Click on ticker or stock name for detailed view. Click on to add stock symbol to your watchlist and to view watchlist. |
12Stocks.com List of ETFs that track Consumer Services Index
| Ticker | ETF Name | Watchlist | Recent Price | Smart Investing & Trading Score | Change % | Week % | Year-to-date % |
| XLY | Consumer Discret Sel | | 178.70 | 40 | 0.51 | 0.34 | -0.06% |
| RTH | Retail | | 204.39 | 70 | 0.17 | 0.41 | 8.59% |
| IYC | Consumer Services | | 80.00 | 45 | 0.26 | 0.49 | 5.58% |
| XRT | Retail | | 75.93 | 37 | -0.78 | 2.08 | 4.99% |
| IYK | Consumer Goods | | 68.05 | 76 | -0.29 | 0.16 | 6.49% |
| UCC | Consumer Services | | 34.67 | 40 | 0.35 | 0.26 | -3.45% |
| RETL | Retail Bull 3X | | 9.64 | 37 | -2.63 | 5.47 | 5.7% |
| RXI | Globl Consumer Discretionary | | 164.60 | 57 | 0.50 | 0.99 | 3.48% |
| SCC | Short Consumer Services | | 15.33 | 54 | -0.65 | -0.39 | 0.04% |
| UGE | Consumer Goods | | 18.22 | 93 | -0.94 | 1.11 | 15.73% |
| 12Stocks.com: Charts, Trends, Fundamental Data and Performances of Consumer Services Stocks | |
|
We now take in-depth look at all Consumer Services stocks including charts, multi-period performances and overall trends (as measured by Smart Investing & Trading Score). One can sort Consumer Services stocks (click link to choose) by Daily, Weekly and by Year-to-Date performances. Also, one can sort by size of the company or by market capitalization. |
| Select Your Default Chart Type: | |||||
| |||||
| Click on stock symbol or name for detailed view. Click on to add stock symbol to your watchlist and to view watchlist. Quick View: Move mouse or cursor over "Daily" to quickly view daily Technical stock chart and over "Weekly" to view weekly Technical stock chart. | |||||

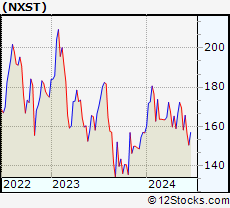 | NXST Nexstar Media Group, Inc. |
| Sector: Services & Goods | |
| SubSector: Broadcasting - TV | |
| MarketCap: 2763.73 Millions | |
| Recent Price: 169.56 Smart Investing & Trading Score: 68 | |
| Day Percent Change: -0.57% Day Change: -0.98 | |
| Week Change: -1.59% Year-to-date Change: 8.2% | |
| NXST Links: Profile News Message Board | |
| Charts:- Daily , Weekly | |
| Add NXST to Watchlist: View: Get Complete NXST Trend Analysis ➞ | |
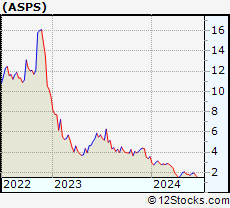 | ASPS Altisource Portfolio Solutions S.A. |
| Sector: Services & Goods | |
| SubSector: Business Services | |
| MarketCap: 120.382 Millions | |
| Recent Price: 1.81 Smart Investing & Trading Score: 20 | |
| Day Percent Change: -4.23% Day Change: -0.08 | |
| Week Change: -1.63% Year-to-date Change: -49.2% | |
| ASPS Links: Profile News Message Board | |
| Charts:- Daily , Weekly | |
| Add ASPS to Watchlist: View: Get Complete ASPS Trend Analysis ➞ | |
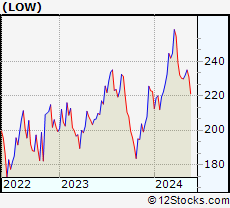 | LOW Lowe s Companies, Inc. |
| Sector: Services & Goods | |
| SubSector: Home Improvement Stores | |
| MarketCap: 56084.2 Millions | |
| Recent Price: 231.11 Smart Investing & Trading Score: 22 | |
| Day Percent Change: -0.50% Day Change: -1.15 | |
| Week Change: -1.67% Year-to-date Change: 3.9% | |
| LOW Links: Profile News Message Board | |
| Charts:- Daily , Weekly | |
| Add LOW to Watchlist: View: Get Complete LOW Trend Analysis ➞ | |
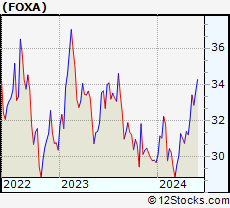 | FOXA Fox Corporation |
| Sector: Services & Goods | |
| SubSector: Entertainment - Diversified | |
| MarketCap: 13440.7 Millions | |
| Recent Price: 32.85 Smart Investing & Trading Score: 63 | |
| Day Percent Change: 0.52% Day Change: 0.17 | |
| Week Change: -1.68% Year-to-date Change: 10.7% | |
| FOXA Links: Profile News Message Board | |
| Charts:- Daily , Weekly | |
| Add FOXA to Watchlist: View: Get Complete FOXA Trend Analysis ➞ | |
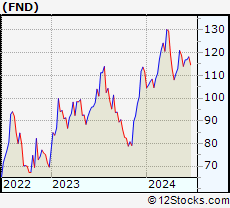 | FND Floor & Decor Holdings, Inc. |
| Sector: Services & Goods | |
| SubSector: Home Improvement Stores | |
| MarketCap: 3327.52 Millions | |
| Recent Price: 118.94 Smart Investing & Trading Score: 37 | |
| Day Percent Change: 0.00% Day Change: 0.00 | |
| Week Change: -1.72% Year-to-date Change: 6.6% | |
| FND Links: Profile News Message Board | |
| Charts:- Daily , Weekly | |
| Add FND to Watchlist: View: Get Complete FND Trend Analysis ➞ | |
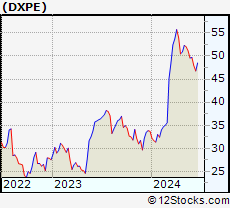 | DXPE DXP Enterprises, Inc. |
| Sector: Services & Goods | |
| SubSector: Industrial Equipment Wholesale | |
| MarketCap: 243.758 Millions | |
| Recent Price: 51.11 Smart Investing & Trading Score: 75 | |
| Day Percent Change: 0.31% Day Change: 0.16 | |
| Week Change: -1.73% Year-to-date Change: 51.7% | |
| DXPE Links: Profile News Message Board | |
| Charts:- Daily , Weekly | |
| Add DXPE to Watchlist: View: Get Complete DXPE Trend Analysis ➞ | |
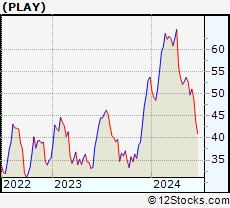 | PLAY Dave & Buster s Entertainment, Inc. |
| Sector: Services & Goods | |
| SubSector: Restaurants | |
| MarketCap: 283.07 Millions | |
| Recent Price: 52.80 Smart Investing & Trading Score: 32 | |
| Day Percent Change: -1.80% Day Change: -0.97 | |
| Week Change: -1.79% Year-to-date Change: -2.0% | |
| PLAY Links: Profile News Message Board | |
| Charts:- Daily , Weekly | |
| Add PLAY to Watchlist: View: Get Complete PLAY Trend Analysis ➞ | |
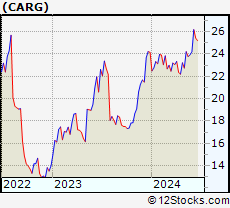 | CARG CarGurus, Inc. |
| Sector: Services & Goods | |
| SubSector: Auto Dealerships | |
| MarketCap: 2099.31 Millions | |
| Recent Price: 23.78 Smart Investing & Trading Score: 63 | |
| Day Percent Change: -0.08% Day Change: -0.02 | |
| Week Change: -1.8% Year-to-date Change: -1.6% | |
| CARG Links: Profile News Message Board | |
| Charts:- Daily , Weekly | |
| Add CARG to Watchlist: View: Get Complete CARG Trend Analysis ➞ | |
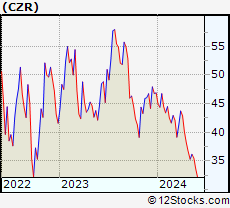 | CZR Caesars Entertainment Corporation |
| Sector: Services & Goods | |
| SubSector: Resorts & Casinos | |
| MarketCap: 4618.44 Millions | |
| Recent Price: 35.52 Smart Investing & Trading Score: 10 | |
| Day Percent Change: 0.59% Day Change: 0.21 | |
| Week Change: -1.82% Year-to-date Change: -24.2% | |
| CZR Links: Profile News Message Board | |
| Charts:- Daily , Weekly | |
| Add CZR to Watchlist: View: Get Complete CZR Trend Analysis ➞ | |
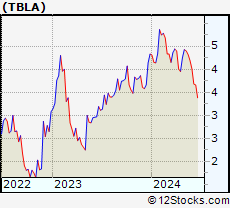 | TBLA Taboola.com Ltd. |
| Sector: Services & Goods | |
| SubSector: Internet Content & Information | |
| MarketCap: 927 Millions | |
| Recent Price: 4.32 Smart Investing & Trading Score: 53 | |
| Day Percent Change: -0.46% Day Change: -0.02 | |
| Week Change: -1.82% Year-to-date Change: -0.2% | |
| TBLA Links: Profile News Message Board | |
| Charts:- Daily , Weekly | |
| Add TBLA to Watchlist: View: Get Complete TBLA Trend Analysis ➞ | |
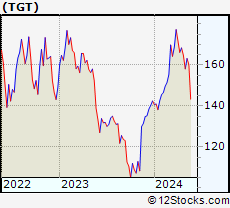 | TGT Target Corporation |
| Sector: Services & Goods | |
| SubSector: Discount, Variety Stores | |
| MarketCap: 55980.6 Millions | |
| Recent Price: 160.13 Smart Investing & Trading Score: 54 | |
| Day Percent Change: -0.32% Day Change: -0.52 | |
| Week Change: -1.84% Year-to-date Change: 12.4% | |
| TGT Links: Profile News Message Board | |
| Charts:- Daily , Weekly | |
| Add TGT to Watchlist: View: Get Complete TGT Trend Analysis ➞ | |
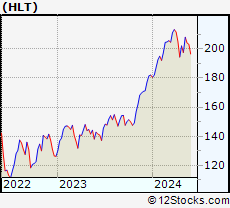 | HLT Hilton Worldwide Holdings Inc. |
| Sector: Services & Goods | |
| SubSector: Lodging | |
| MarketCap: 18064.6 Millions | |
| Recent Price: 204.19 Smart Investing & Trading Score: 60 | |
| Day Percent Change: -0.78% Day Change: -1.60 | |
| Week Change: -1.87% Year-to-date Change: 12.1% | |
| HLT Links: Profile News Message Board | |
| Charts:- Daily , Weekly | |
| Add HLT to Watchlist: View: Get Complete HLT Trend Analysis ➞ | |
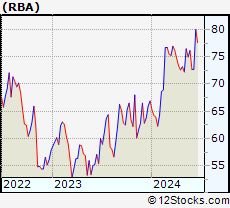 | RBA Ritchie Bros. Auctioneers Incorporated |
| Sector: Services & Goods | |
| SubSector: Business Services | |
| MarketCap: 3491.02 Millions | |
| Recent Price: 74.97 Smart Investing & Trading Score: 27 | |
| Day Percent Change: -0.12% Day Change: -0.09 | |
| Week Change: -1.97% Year-to-date Change: 12.1% | |
| RBA Links: Profile News Message Board | |
| Charts:- Daily , Weekly | |
| Add RBA to Watchlist: View: Get Complete RBA Trend Analysis ➞ | |
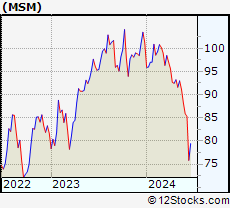 | MSM MSC Industrial Direct Co., Inc. |
| Sector: Services & Goods | |
| SubSector: Industrial Equipment Wholesale | |
| MarketCap: 2701.88 Millions | |
| Recent Price: 91.15 Smart Investing & Trading Score: 10 | |
| Day Percent Change: -1.09% Day Change: -1.00 | |
| Week Change: -1.98% Year-to-date Change: -10.0% | |
| MSM Links: Profile News Message Board | |
| Charts:- Daily , Weekly | |
| Add MSM to Watchlist: View: Get Complete MSM Trend Analysis ➞ | |
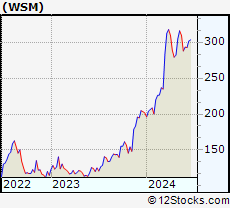 | WSM Williams-Sonoma, Inc. |
| Sector: Services & Goods | |
| SubSector: Home Furnishing Stores | |
| MarketCap: 3370.05 Millions | |
| Recent Price: 309.50 Smart Investing & Trading Score: 58 | |
| Day Percent Change: -1.14% Day Change: -3.56 | |
| Week Change: -2.04% Year-to-date Change: 53.4% | |
| WSM Links: Profile News Message Board | |
| Charts:- Daily , Weekly | |
| Add WSM to Watchlist: View: Get Complete WSM Trend Analysis ➞ | |
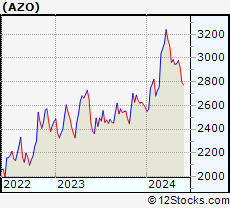 | AZO AutoZone, Inc. |
| Sector: Services & Goods | |
| SubSector: Auto Parts Stores | |
| MarketCap: 19128 Millions | |
| Recent Price: 2917.50 Smart Investing & Trading Score: 18 | |
| Day Percent Change: 0.57% Day Change: 16.51 | |
| Week Change: -2.07% Year-to-date Change: 12.8% | |
| AZO Links: Profile News Message Board | |
| Charts:- Daily , Weekly | |
| Add AZO to Watchlist: View: Get Complete AZO Trend Analysis ➞ | |
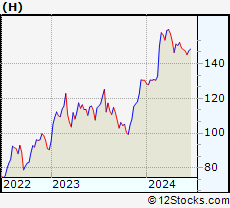 | H Hyatt Hotels Corporation |
| Sector: Services & Goods | |
| SubSector: Lodging | |
| MarketCap: 5525.56 Millions | |
| Recent Price: 149.05 Smart Investing & Trading Score: 7 | |
| Day Percent Change: -0.08% Day Change: -0.12 | |
| Week Change: -2.07% Year-to-date Change: 14.3% | |
| H Links: Profile News Message Board | |
| Charts:- Daily , Weekly | |
| Add H to Watchlist: View: Get Complete H Trend Analysis ➞ | |
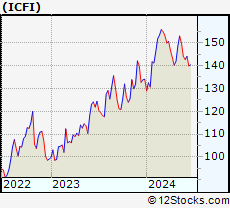 | ICFI ICF International, Inc. |
| Sector: Services & Goods | |
| SubSector: Management Services | |
| MarketCap: 1218.75 Millions | |
| Recent Price: 149.80 Smart Investing & Trading Score: 57 | |
| Day Percent Change: 2.17% Day Change: 3.18 | |
| Week Change: -2.1% Year-to-date Change: 11.7% | |
| ICFI Links: Profile News Message Board | |
| Charts:- Daily , Weekly | |
| Add ICFI to Watchlist: View: Get Complete ICFI Trend Analysis ➞ | |
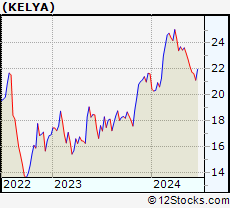 | KELYA Kelly Services, Inc. |
| Sector: Services & Goods | |
| SubSector: Staffing & Outsourcing Services | |
| MarketCap: 587.228 Millions | |
| Recent Price: 22.72 Smart Investing & Trading Score: 18 | |
| Day Percent Change: -0.74% Day Change: -0.17 | |
| Week Change: -2.11% Year-to-date Change: 5.1% | |
| KELYA Links: Profile News Message Board | |
| Charts:- Daily , Weekly | |
| Add KELYA to Watchlist: View: Get Complete KELYA Trend Analysis ➞ | |
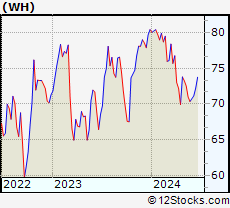 | WH Wyndham Hotels & Resorts, Inc. |
| Sector: Services & Goods | |
| SubSector: Lodging | |
| MarketCap: 2656.66 Millions | |
| Recent Price: 70.99 Smart Investing & Trading Score: 35 | |
| Day Percent Change: -0.55% Day Change: -0.39 | |
| Week Change: -2.14% Year-to-date Change: -11.7% | |
| WH Links: Profile News Message Board | |
| Charts:- Daily , Weekly | |
| Add WH to Watchlist: View: Get Complete WH Trend Analysis ➞ | |
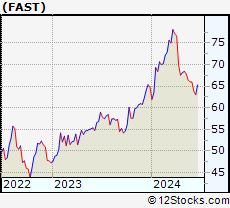 | FAST Fastenal Company |
| Sector: Services & Goods | |
| SubSector: Industrial Equipment Wholesale | |
| MarketCap: 17609.9 Millions | |
| Recent Price: 66.42 Smart Investing & Trading Score: 0 | |
| Day Percent Change: -0.58% Day Change: -0.39 | |
| Week Change: -2.15% Year-to-date Change: 2.6% | |
| FAST Links: Profile News Message Board | |
| Charts:- Daily , Weekly | |
| Add FAST to Watchlist: View: Get Complete FAST Trend Analysis ➞ | |
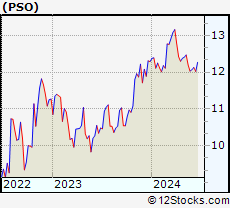 | PSO Pearson plc |
| Sector: Services & Goods | |
| SubSector: Publishing - Books | |
| MarketCap: 4595.42 Millions | |
| Recent Price: 12.20 Smart Investing & Trading Score: 0 | |
| Day Percent Change: -0.08% Day Change: -0.01 | |
| Week Change: -2.17% Year-to-date Change: -0.7% | |
| PSO Links: Profile News Message Board | |
| Charts:- Daily , Weekly | |
| Add PSO to Watchlist: View: Get Complete PSO Trend Analysis ➞ | |
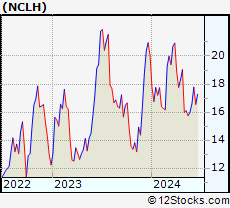 | NCLH Norwegian Cruise Line Holdings Ltd. |
| Sector: Services & Goods | |
| SubSector: Resorts & Casinos | |
| MarketCap: 2895.54 Millions | |
| Recent Price: 15.75 Smart Investing & Trading Score: 32 | |
| Day Percent Change: -0.88% Day Change: -0.14 | |
| Week Change: -2.17% Year-to-date Change: -21.4% | |
| NCLH Links: Profile News Message Board | |
| Charts:- Daily , Weekly | |
| Add NCLH to Watchlist: View: Get Complete NCLH Trend Analysis ➞ | |
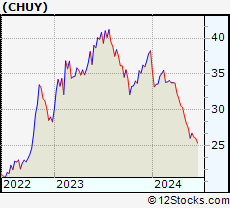 | CHUY Chuy s Holdings, Inc. |
| Sector: Services & Goods | |
| SubSector: Restaurants | |
| MarketCap: 159.17 Millions | |
| Recent Price: 27.47 Smart Investing & Trading Score: 0 | |
| Day Percent Change: -2.55% Day Change: -0.72 | |
| Week Change: -2.24% Year-to-date Change: -28.2% | |
| CHUY Links: Profile News Message Board | |
| Charts:- Daily , Weekly | |
| Add CHUY to Watchlist: View: Get Complete CHUY Trend Analysis ➞ | |
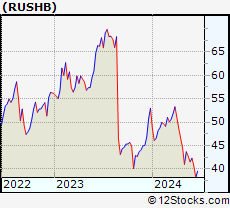 | RUSHB Rush Enterprises, Inc. |
| Sector: Services & Goods | |
| SubSector: Auto Dealerships | |
| MarketCap: 203.221 Millions | |
| Recent Price: 42.67 Smart Investing & Trading Score: 20 | |
| Day Percent Change: 0.52% Day Change: 0.22 | |
| Week Change: -2.25% Year-to-date Change: -19.5% | |
| RUSHB Links: Profile News Message Board | |
| Charts:- Daily , Weekly | |
| Add RUSHB to Watchlist: View: Get Complete RUSHB Trend Analysis ➞ | |
| For tabular summary view of above stock list: Summary View ➞ 0 - 25 , 25 - 50 , 50 - 75 , 75 - 100 , 100 - 125 , 125 - 150 , 150 - 175 , 175 - 200 , 200 - 225 , 225 - 250 , 250 - 275 , 275 - 300 , 300 - 325 , 325 - 350 , 350 - 375 , 375 - 400 , 400 - 425 , 425 - 450 , 450 - 475 | ||
| Click To Change The Sort Order: By Market Cap or Company Size Performance: Year-to-date, Week and Day | |
| Select Chart Type: | ||
|
Best Stocks Today 12Stocks.com |
© 2024 12Stocks.com Terms & Conditions Privacy Contact Us
All Information Provided Only For Education And Not To Be Used For Investing or Trading. See Terms & Conditions


One More Thing ... Get Best Stocks Delivered Daily!
Never Ever Miss A Move With Our Top Ten Stocks Lists
Find Best Stocks In Any Market - Bull or Bear Market
Take A Peek At Our Top Ten Stocks Lists: Daily, Weekly, Year-to-Date & Top Trends
Find Best Stocks In Any Market - Bull or Bear Market
Take A Peek At Our Top Ten Stocks Lists: Daily, Weekly, Year-to-Date & Top Trends
Consumer Services Stocks With Best Up Trends [0-bearish to 100-bullish]: Despegar.com [100], Boqii Holding[100], Gannett Co[100], Littelfuse [100], On Holding[100], Tractor Supply[100], Outbrain [100], Super [100], Kratos Defense[100], Alibaba [100], MakeMyTrip [100]
Best Consumer Services Stocks Year-to-Date:
U Power[3454.69%], Vroom [1751.48%], Yatsen Holding[515.09%], Fluent [432.84%], Zhihu [349.45%], Faraday Future[346.47%], Codere Online[183.9%], Sweetgreen [180.97%], Research[155.08%], Carvana Co[121.95%], Smart Share[121.36%] Best Consumer Services Stocks This Week:
Faraday Future[2134.27%], AMC Entertainment[51.2%], Petco Health[50%], HUYA [36.36%], Allbirds [28.4%], GameStop [27.21%], On Holding[25.39%], MOGU [24.34%], EVgo [22.58%], Despegar.com [22.06%], U Power[20.64%] Best Consumer Services Stocks Daily:
Despegar.com [19.14%], Golden Heaven[16.00%], Cumulus Media[10.92%], Zhihu [8.42%], Boqii Holding[7.35%], Yunji [6.10%], Dada Nexus[6.04%], CompX [5.17%], Qurate Retail[5.06%], Gannett Co[4.79%], Research[4.61%]