
 Login Sign Up


| |||||
 |  | ||||

| 12Stocks.com Market Intelligence |
Best Consumer Services Stocks
| In a hurry? Services & Goods Stocks: Performance Trends Table, Stock Charts
Sort Consumer Services: Daily, Weekly, Year-to-Date, Market Cap & Trends. Filter Services & Goods stocks list by size: All Large Mid-Range Small |
| 12Stocks.com Consumer Services Stocks Performances & Trends Daily | |||||||||
|
|  The overall Smart Investing & Trading Score is 40 (0-bearish to 100-bullish) which puts Consumer Services sector in short term bearish to neutral trend. The Smart Investing & Trading Score from previous trading session is 47 and a deterioration of trend continues.
| ||||||||
Here are the Smart Investing & Trading Scores of the most requested Consumer Services stocks at 12Stocks.com (click stock name for detailed review):
|


| Consider signing up for our daily 12Stocks.com "Best Stocks Newsletter". You will never ever miss a big stock move again! |
| 12Stocks.com: Investing in Consumer Services sector with Stocks | |
|
The following table helps investors and traders sort through current performance and trends (as measured by Smart Investing & Trading Score) of various
stocks in the Consumer Services sector. Quick View: Move mouse or cursor over stock symbol (ticker) to view short-term Technical chart and over stock name to view long term chart. Click on  to add stock symbol to your watchlist and to add stock symbol to your watchlist and  to view watchlist. Click on any ticker or stock name for detailed market intelligence report for that stock. to view watchlist. Click on any ticker or stock name for detailed market intelligence report for that stock. |
12Stocks.com Performance of Stocks in Consumer Services Sector
| Ticker | Stock Name | Watchlist | Category | Recent Price | Smart Investing & Trading Score | Change % | Weekly Change% |
| GLP | Global Partners |   | Basic Materials Wholesale | 44.48 | 32 | 2.58% | 1.11% |
| COST | Costco Wholesale | | Retail | 795.81 | 90 | 0.35% | 1.10% |
| QRTEP | Qurate Retail | | Internet Retail | 49.54 | 52 | -1.41% | 1.10% |
| LSXMB | Liberty SiriusXM | | Broadcasting | 25.22 | 25 | 0.00% | 1.08% |
| CHH | Choice Hotels | | Lodging | 118.40 | 58 | -1.38% | 1.06% |
| LVS | Las Vegas | | Casinos | 47.03 | 64 | 0.88% | 1.05% |
| EXPE | Expedia | | Lodging | 114.01 | 35 | 0.49% | 1.04% |
| BATRA | Liberty Braves | | Broadcasting | 42.02 | 70 | 0.67% | 0.96% |
| EBAY | eBay | | Retail | 51.48 | 43 | -2.31% | 0.94% |
| EDR | Endeavor | | Entertainment | 26.71 | 50 | 0.11% | 0.91% |
| TV | Grupo Televisa | | Broadcasting | 3.31 | 78 | 0.30% | 0.91% |
| EXPO | Exponent | | Services | 95.18 | 76 | -0.27% | 0.90% |
| DG | Dollar General | | Retail | 142.13 | 45 | -3.04% | 0.84% |
| ASGN | ASGN | | Staffing | 101.12 | 78 | -0.13% | 0.83% |
| MCK | McKesson | | Pharmacy | 564.52 | 100 | 1.58% | 0.82% |
| M | Macy s | | Department | 19.49 | 75 | -0.66% | 0.72% |
| ENV | Envestnet | | Services | 67.81 | 95 | 2.28% | 0.70% |
| GOLF | Acushnet | | Retail | 64.40 | 40 | 0.67% | 0.67% |
| OSW | OneSpaWorld | | Casinos | 14.93 | 83 | 0.27% | 0.67% |
| LBRDK | Liberty Broadband | | Broadcasting | 53.41 | 57 | -1.17% | 0.66% |
| IGT | Game | | Gaming | 20.24 | 25 | -2.22% | 0.65% |
| LL | Lumber Liquidators | | Retail | 1.59 | 35 | -4.79% | 0.63% |
| RCL | Royal Caribbean | | Casinos | 141.92 | 73 | -0.66% | 0.62% |
| FCN | FTI Consulting | | Services | 223.10 | 90 | 0.57% | 0.60% |
| MHH | Mastech Digital | | Staffing | 8.45 | 25 | -3.15% | 0.60% |
| For chart view version of above stock list: Chart View ➞ 0 - 25 , 25 - 50 , 50 - 75 , 75 - 100 , 100 - 125 , 125 - 150 , 150 - 175 , 175 - 200 , 200 - 225 , 225 - 250 , 250 - 275 , 275 - 300 , 300 - 325 , 325 - 350 , 350 - 375 , 375 - 400 , 400 - 425 , 425 - 450 , 450 - 475 | ||
 | Click To Change The Sort Order: By Market Cap or Company Size Performance: Year-to-date, Week and Day |  |
|
Get the most comprehensive stock market coverage daily at 12Stocks.com ➞ Best Stocks Today ➞ Best Stocks Weekly ➞ Best Stocks Year-to-Date ➞ Best Stocks Trends ➞  Best Stocks Today 12Stocks.com Best Nasdaq Stocks ➞ Best S&P 500 Stocks ➞ Best Tech Stocks ➞ Best Biotech Stocks ➞ |
| Detailed Overview of Consumer Services Stocks |
| Consumer Services Technical Overview, Leaders & Laggards, Top Consumer Services ETF Funds & Detailed Consumer Services Stocks List, Charts, Trends & More |
| Consumer Services Sector: Technical Analysis, Trends & YTD Performance | |
| Consumer Services sector is composed of stocks
from retail, entertainment, media/publishing, consumer goods
and services subsectors. Consumer Services sector, as represented by XLY, an exchange-traded fund [ETF] that holds basket of Consumer Services stocks (e.g, Walmart, Alibaba) is down by -0.06% and is currently underperforming the overall market by -10.63% year-to-date. Below is a quick view of Technical charts and trends: |
|
 XLY Weekly Chart |
|
| Long Term Trend: Not Good | |
| Medium Term Trend: Very Good | |
 XLY Daily Chart |
|
| Short Term Trend: Good | |
| Overall Trend Score: 40 | |
| YTD Performance: -0.06% | |
| **Trend Scores & Views Are Only For Educational Purposes And Not For Investing | |
| 12Stocks.com: Top Performing Consumer Services Sector Stocks | ||||||||||||||||||||||||||||||||||||||||||||||||
 The top performing Consumer Services sector stocks year to date are
Now, more recently, over last week, the top performing Consumer Services sector stocks on the move are


|
||||||||||||||||||||||||||||||||||||||||||||||||
| 12Stocks.com: Investing in Consumer Services Sector using Exchange Traded Funds | |
|
The following table shows list of key exchange traded funds (ETF) that
help investors track Consumer Services Index. For detailed view, check out our ETF Funds section of our website. Quick View: Move mouse or cursor over ETF symbol (ticker) to view short-term Technical chart and over ETF name to view long term chart. Click on ticker or stock name for detailed view. Click on to add stock symbol to your watchlist and to view watchlist. |
12Stocks.com List of ETFs that track Consumer Services Index
| Ticker | ETF Name | Watchlist | Recent Price | Smart Investing & Trading Score | Change % | Week % | Year-to-date % |
| XLY | Consumer Discret Sel | | 178.70 | 40 | 0.51 | 0.34 | -0.06% |
| RTH | Retail | | 204.39 | 70 | 0.17 | 0.41 | 8.59% |
| IYC | Consumer Services | | 80.00 | 45 | 0.26 | 0.49 | 5.58% |
| XRT | Retail | | 75.93 | 37 | -0.78 | 2.08 | 4.99% |
| IYK | Consumer Goods | | 68.05 | 76 | -0.29 | 0.16 | 6.49% |
| UCC | Consumer Services | | 34.67 | 40 | 0.35 | 0.26 | -3.45% |
| RETL | Retail Bull 3X | | 9.64 | 37 | -2.63 | 5.47 | 5.7% |
| RXI | Globl Consumer Discretionary | | 164.60 | 57 | 0.50 | 0.99 | 3.48% |
| SCC | Short Consumer Services | | 15.33 | 54 | -0.65 | -0.39 | 0.04% |
| UGE | Consumer Goods | | 18.22 | 93 | -0.94 | 1.11 | 15.73% |
| 12Stocks.com: Charts, Trends, Fundamental Data and Performances of Consumer Services Stocks | |
|
We now take in-depth look at all Consumer Services stocks including charts, multi-period performances and overall trends (as measured by Smart Investing & Trading Score). One can sort Consumer Services stocks (click link to choose) by Daily, Weekly and by Year-to-Date performances. Also, one can sort by size of the company or by market capitalization. |
| Select Your Default Chart Type: | |||||
| |||||
| Click on stock symbol or name for detailed view. Click on to add stock symbol to your watchlist and to view watchlist. Quick View: Move mouse or cursor over "Daily" to quickly view daily Technical stock chart and over "Weekly" to view weekly Technical stock chart. | |||||

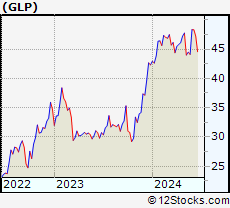 | GLP Global Partners LP |
| Sector: Services & Goods | |
| SubSector: Basic Materials Wholesale | |
| MarketCap: 416.73 Millions | |
| Recent Price: 44.48 Smart Investing & Trading Score: 32 | |
| Day Percent Change: 2.58% Day Change: 1.12 | |
| Week Change: 1.11% Year-to-date Change: 5.1% | |
| GLP Links: Profile News Message Board | |
| Charts:- Daily , Weekly | |
| Add GLP to Watchlist: View: Get Complete GLP Trend Analysis ➞ | |
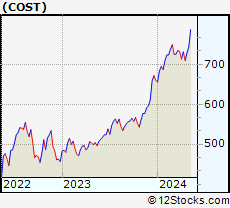 | COST Costco Wholesale Corporation |
| Sector: Services & Goods | |
| SubSector: Discount, Variety Stores | |
| MarketCap: 136355 Millions | |
| Recent Price: 795.81 Smart Investing & Trading Score: 90 | |
| Day Percent Change: 0.35% Day Change: 2.74 | |
| Week Change: 1.1% Year-to-date Change: 20.6% | |
| COST Links: Profile News Message Board | |
| Charts:- Daily , Weekly | |
| Add COST to Watchlist: View: Get Complete COST Trend Analysis ➞ | |
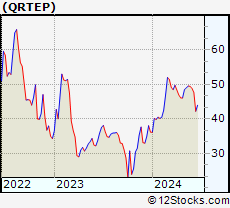 | QRTEP Qurate Retail, Inc. |
| Sector: Services & Goods | |
| SubSector: Internet Retail | |
| MarketCap: 29027 Millions | |
| Recent Price: 49.54 Smart Investing & Trading Score: 52 | |
| Day Percent Change: -1.41% Day Change: -0.71 | |
| Week Change: 1.1% Year-to-date Change: 37.0% | |
| QRTEP Links: Profile News Message Board | |
| Charts:- Daily , Weekly | |
| Add QRTEP to Watchlist: View: Get Complete QRTEP Trend Analysis ➞ | |
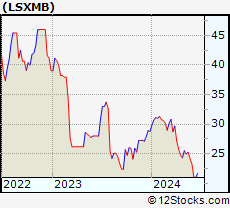 | LSXMB The Liberty SiriusXM Group |
| Sector: Services & Goods | |
| SubSector: Broadcasting - Radio | |
| MarketCap: 252.295 Millions | |
| Recent Price: 25.22 Smart Investing & Trading Score: 25 | |
| Day Percent Change: 0.00% Day Change: 0.00 | |
| Week Change: 1.08% Year-to-date Change: -12.4% | |
| LSXMB Links: Profile News Message Board | |
| Charts:- Daily , Weekly | |
| Add LSXMB to Watchlist: View: Get Complete LSXMB Trend Analysis ➞ | |
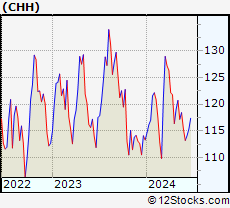 | CHH Choice Hotels International, Inc. |
| Sector: Services & Goods | |
| SubSector: Lodging | |
| MarketCap: 3427.56 Millions | |
| Recent Price: 118.40 Smart Investing & Trading Score: 58 | |
| Day Percent Change: -1.38% Day Change: -1.66 | |
| Week Change: 1.06% Year-to-date Change: 4.5% | |
| CHH Links: Profile News Message Board | |
| Charts:- Daily , Weekly | |
| Add CHH to Watchlist: View: Get Complete CHH Trend Analysis ➞ | |
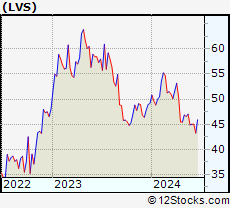 | LVS Las Vegas Sands Corp. |
| Sector: Services & Goods | |
| SubSector: Resorts & Casinos | |
| MarketCap: 36431.6 Millions | |
| Recent Price: 47.03 Smart Investing & Trading Score: 64 | |
| Day Percent Change: 0.88% Day Change: 0.41 | |
| Week Change: 1.05% Year-to-date Change: -4.4% | |
| LVS Links: Profile News Message Board | |
| Charts:- Daily , Weekly | |
| Add LVS to Watchlist: View: Get Complete LVS Trend Analysis ➞ | |
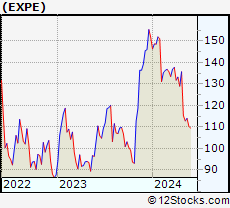 | EXPE Expedia Group, Inc. |
| Sector: Services & Goods | |
| SubSector: Lodging | |
| MarketCap: 8052.96 Millions | |
| Recent Price: 114.01 Smart Investing & Trading Score: 35 | |
| Day Percent Change: 0.49% Day Change: 0.56 | |
| Week Change: 1.04% Year-to-date Change: -24.9% | |
| EXPE Links: Profile News Message Board | |
| Charts:- Daily , Weekly | |
| Add EXPE to Watchlist: View: Get Complete EXPE Trend Analysis ➞ | |
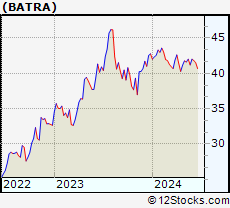 | BATRA The Liberty Braves Group |
| Sector: Services & Goods | |
| SubSector: Broadcasting - TV | |
| MarketCap: 18873.5 Millions | |
| Recent Price: 42.02 Smart Investing & Trading Score: 70 | |
| Day Percent Change: 0.67% Day Change: 0.28 | |
| Week Change: 0.96% Year-to-date Change: -1.8% | |
| BATRA Links: Profile News Message Board | |
| Charts:- Daily , Weekly | |
| Add BATRA to Watchlist: View: Get Complete BATRA Trend Analysis ➞ | |
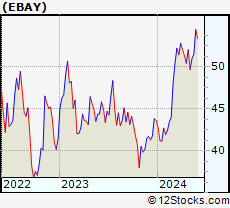 | EBAY eBay Inc. |
| Sector: Services & Goods | |
| SubSector: Specialty Retail, Other | |
| MarketCap: 23152.3 Millions | |
| Recent Price: 51.48 Smart Investing & Trading Score: 43 | |
| Day Percent Change: -2.31% Day Change: -1.22 | |
| Week Change: 0.94% Year-to-date Change: 18.0% | |
| EBAY Links: Profile News Message Board | |
| Charts:- Daily , Weekly | |
| Add EBAY to Watchlist: View: Get Complete EBAY Trend Analysis ➞ | |
 | EDR Endeavor Group Holdings, Inc. |
| Sector: Services & Goods | |
| SubSector: Entertainment | |
| MarketCap: 11310 Millions | |
| Recent Price: 26.71 Smart Investing & Trading Score: 50 | |
| Day Percent Change: 0.11% Day Change: 0.03 | |
| Week Change: 0.91% Year-to-date Change: 12.6% | |
| EDR Links: Profile News Message Board | |
| Charts:- Daily , Weekly | |
| Add EDR to Watchlist: View: Get Complete EDR Trend Analysis ➞ | |
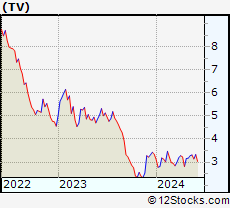 | TV Grupo Televisa, S.A.B. |
| Sector: Services & Goods | |
| SubSector: Broadcasting - TV | |
| MarketCap: 3740.43 Millions | |
| Recent Price: 3.31 Smart Investing & Trading Score: 78 | |
| Day Percent Change: 0.30% Day Change: 0.01 | |
| Week Change: 0.91% Year-to-date Change: -0.9% | |
| TV Links: Profile News Message Board | |
| Charts:- Daily , Weekly | |
| Add TV to Watchlist: View: Get Complete TV Trend Analysis ➞ | |
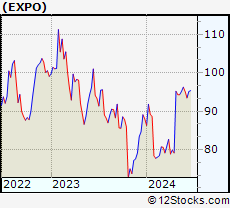 | EXPO Exponent, Inc. |
| Sector: Services & Goods | |
| SubSector: Management Services | |
| MarketCap: 3605.95 Millions | |
| Recent Price: 95.18 Smart Investing & Trading Score: 76 | |
| Day Percent Change: -0.27% Day Change: -0.26 | |
| Week Change: 0.9% Year-to-date Change: 8.1% | |
| EXPO Links: Profile News Message Board | |
| Charts:- Daily , Weekly | |
| Add EXPO to Watchlist: View: Get Complete EXPO Trend Analysis ➞ | |
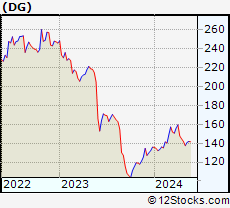 | DG Dollar General Corporation |
| Sector: Services & Goods | |
| SubSector: Discount, Variety Stores | |
| MarketCap: 39611.9 Millions | |
| Recent Price: 142.13 Smart Investing & Trading Score: 45 | |
| Day Percent Change: -3.04% Day Change: -4.46 | |
| Week Change: 0.84% Year-to-date Change: 4.6% | |
| DG Links: Profile News Message Board | |
| Charts:- Daily , Weekly | |
| Add DG to Watchlist: View: Get Complete DG Trend Analysis ➞ | |
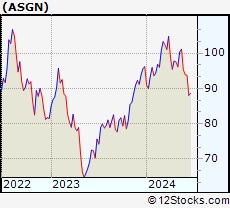 | ASGN ASGN Incorporated |
| Sector: Services & Goods | |
| SubSector: Staffing & Outsourcing Services | |
| MarketCap: 2035.88 Millions | |
| Recent Price: 101.12 Smart Investing & Trading Score: 78 | |
| Day Percent Change: -0.13% Day Change: -0.13 | |
| Week Change: 0.83% Year-to-date Change: 5.2% | |
| ASGN Links: Profile News Message Board | |
| Charts:- Daily , Weekly | |
| Add ASGN to Watchlist: View: Get Complete ASGN Trend Analysis ➞ | |
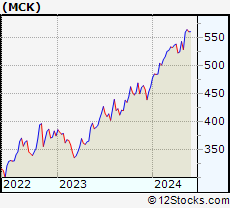 | MCK McKesson Corporation |
| Sector: Services & Goods | |
| SubSector: Drugs Wholesale | |
| MarketCap: 24096.7 Millions | |
| Recent Price: 564.52 Smart Investing & Trading Score: 100 | |
| Day Percent Change: 1.58% Day Change: 8.76 | |
| Week Change: 0.82% Year-to-date Change: 21.9% | |
| MCK Links: Profile News Message Board | |
| Charts:- Daily , Weekly | |
| Add MCK to Watchlist: View: Get Complete MCK Trend Analysis ➞ | |
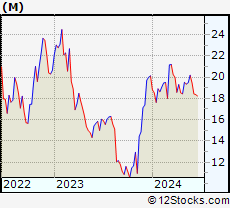 | M Macy s, Inc. |
| Sector: Services & Goods | |
| SubSector: Department Stores | |
| MarketCap: 2391.72 Millions | |
| Recent Price: 19.49 Smart Investing & Trading Score: 75 | |
| Day Percent Change: -0.66% Day Change: -0.13 | |
| Week Change: 0.72% Year-to-date Change: -3.1% | |
| M Links: Profile News Message Board | |
| Charts:- Daily , Weekly | |
| Add M to Watchlist: View: Get Complete M Trend Analysis ➞ | |
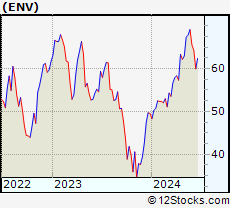 | ENV Envestnet, Inc. |
| Sector: Services & Goods | |
| SubSector: Business Services | |
| MarketCap: 3114.02 Millions | |
| Recent Price: 67.81 Smart Investing & Trading Score: 95 | |
| Day Percent Change: 2.28% Day Change: 1.51 | |
| Week Change: 0.7% Year-to-date Change: 36.9% | |
| ENV Links: Profile News Message Board | |
| Charts:- Daily , Weekly | |
| Add ENV to Watchlist: View: Get Complete ENV Trend Analysis ➞ | |
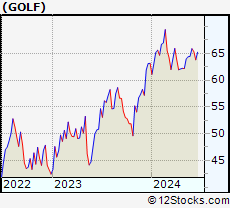 | GOLF Acushnet Holdings Corp. |
| Sector: Services & Goods | |
| SubSector: Sporting Goods Stores | |
| MarketCap: 1717.74 Millions | |
| Recent Price: 64.40 Smart Investing & Trading Score: 40 | |
| Day Percent Change: 0.67% Day Change: 0.43 | |
| Week Change: 0.67% Year-to-date Change: 2.0% | |
| GOLF Links: Profile News Message Board | |
| Charts:- Daily , Weekly | |
| Add GOLF to Watchlist: View: Get Complete GOLF Trend Analysis ➞ | |
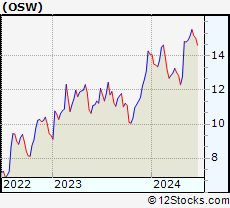 | OSW OneSpaWorld Holdings Limited |
| Sector: Services & Goods | |
| SubSector: Resorts & Casinos | |
| MarketCap: 228.394 Millions | |
| Recent Price: 14.93 Smart Investing & Trading Score: 83 | |
| Day Percent Change: 0.27% Day Change: 0.04 | |
| Week Change: 0.67% Year-to-date Change: 5.9% | |
| OSW Links: Profile News Message Board | |
| Charts:- Daily , Weekly | |
| Add OSW to Watchlist: View: Get Complete OSW Trend Analysis ➞ | |
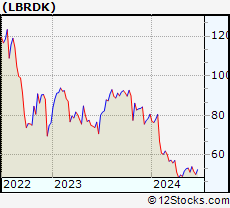 | LBRDK Liberty Broadband Corporation |
| Sector: Services & Goods | |
| SubSector: Broadcasting - TV | |
| MarketCap: 13847.3 Millions | |
| Recent Price: 53.41 Smart Investing & Trading Score: 57 | |
| Day Percent Change: -1.17% Day Change: -0.63 | |
| Week Change: 0.66% Year-to-date Change: -33.7% | |
| LBRDK Links: Profile News Message Board | |
| Charts:- Daily , Weekly | |
| Add LBRDK to Watchlist: View: Get Complete LBRDK Trend Analysis ➞ | |
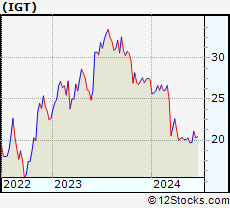 | IGT International Game Technology PLC |
| Sector: Services & Goods | |
| SubSector: Gaming Activities | |
| MarketCap: 1030.89 Millions | |
| Recent Price: 20.24 Smart Investing & Trading Score: 25 | |
| Day Percent Change: -2.22% Day Change: -0.46 | |
| Week Change: 0.65% Year-to-date Change: -26.2% | |
| IGT Links: Profile News Message Board | |
| Charts:- Daily , Weekly | |
| Add IGT to Watchlist: View: Get Complete IGT Trend Analysis ➞ | |
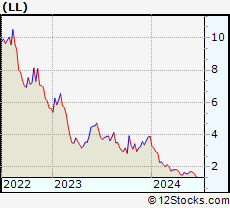 | LL Lumber Liquidators Holdings, Inc. |
| Sector: Services & Goods | |
| SubSector: Home Improvement Stores | |
| MarketCap: 143.352 Millions | |
| Recent Price: 1.59 Smart Investing & Trading Score: 35 | |
| Day Percent Change: -4.79% Day Change: -0.08 | |
| Week Change: 0.63% Year-to-date Change: -59.2% | |
| LL Links: Profile News Message Board | |
| Charts:- Daily , Weekly | |
| Add LL to Watchlist: View: Get Complete LL Trend Analysis ➞ | |
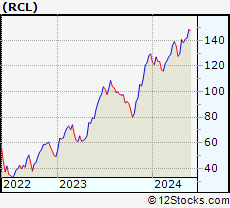 | RCL Royal Caribbean Cruises Ltd. |
| Sector: Services & Goods | |
| SubSector: Resorts & Casinos | |
| MarketCap: 7294.14 Millions | |
| Recent Price: 141.92 Smart Investing & Trading Score: 73 | |
| Day Percent Change: -0.66% Day Change: -0.94 | |
| Week Change: 0.62% Year-to-date Change: 9.6% | |
| RCL Links: Profile News Message Board | |
| Charts:- Daily , Weekly | |
| Add RCL to Watchlist: View: Get Complete RCL Trend Analysis ➞ | |
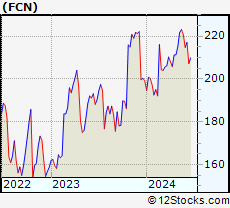 | FCN FTI Consulting, Inc. |
| Sector: Services & Goods | |
| SubSector: Management Services | |
| MarketCap: 4485.05 Millions | |
| Recent Price: 223.10 Smart Investing & Trading Score: 90 | |
| Day Percent Change: 0.57% Day Change: 1.26 | |
| Week Change: 0.6% Year-to-date Change: 12.0% | |
| FCN Links: Profile News Message Board | |
| Charts:- Daily , Weekly | |
| Add FCN to Watchlist: View: Get Complete FCN Trend Analysis ➞ | |
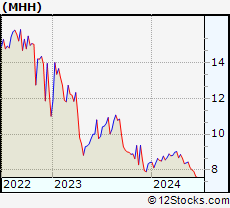 | MHH Mastech Digital, Inc. |
| Sector: Services & Goods | |
| SubSector: Staffing & Outsourcing Services | |
| MarketCap: 109.228 Millions | |
| Recent Price: 8.45 Smart Investing & Trading Score: 25 | |
| Day Percent Change: -3.15% Day Change: -0.28 | |
| Week Change: 0.6% Year-to-date Change: 0.3% | |
| MHH Links: Profile News Message Board | |
| Charts:- Daily , Weekly | |
| Add MHH to Watchlist: View: Get Complete MHH Trend Analysis ➞ | |
| For tabular summary view of above stock list: Summary View ➞ 0 - 25 , 25 - 50 , 50 - 75 , 75 - 100 , 100 - 125 , 125 - 150 , 150 - 175 , 175 - 200 , 200 - 225 , 225 - 250 , 250 - 275 , 275 - 300 , 300 - 325 , 325 - 350 , 350 - 375 , 375 - 400 , 400 - 425 , 425 - 450 , 450 - 475 | ||
| Click To Change The Sort Order: By Market Cap or Company Size Performance: Year-to-date, Week and Day | |
| Select Chart Type: | ||
|
Best Stocks Today 12Stocks.com |
© 2024 12Stocks.com Terms & Conditions Privacy Contact Us
All Information Provided Only For Education And Not To Be Used For Investing or Trading. See Terms & Conditions


One More Thing ... Get Best Stocks Delivered Daily!
Never Ever Miss A Move With Our Top Ten Stocks Lists
Find Best Stocks In Any Market - Bull or Bear Market
Take A Peek At Our Top Ten Stocks Lists: Daily, Weekly, Year-to-Date & Top Trends
Find Best Stocks In Any Market - Bull or Bear Market
Take A Peek At Our Top Ten Stocks Lists: Daily, Weekly, Year-to-Date & Top Trends
Consumer Services Stocks With Best Up Trends [0-bearish to 100-bullish]: Despegar.com [100], Boqii Holding[100], Gannett Co[100], Littelfuse [100], On Holding[100], Tractor Supply[100], Outbrain [100], Super [100], Kratos Defense[100], Alibaba [100], MakeMyTrip [100]
Best Consumer Services Stocks Year-to-Date:
U Power[3454.69%], Vroom [1751.48%], Yatsen Holding[515.09%], Fluent [432.84%], Zhihu [349.45%], Faraday Future[346.47%], Codere Online[183.9%], Sweetgreen [180.97%], Research[155.08%], Carvana Co[121.95%], Smart Share[121.36%] Best Consumer Services Stocks This Week:
Faraday Future[2134.27%], AMC Entertainment[51.2%], Petco Health[50%], HUYA [36.36%], Allbirds [28.4%], GameStop [27.21%], On Holding[25.39%], MOGU [24.34%], EVgo [22.58%], Despegar.com [22.06%], U Power[20.64%] Best Consumer Services Stocks Daily:
Despegar.com [19.14%], Golden Heaven[16.00%], Cumulus Media[10.92%], Zhihu [8.42%], Boqii Holding[7.35%], Yunji [6.10%], Dada Nexus[6.04%], CompX [5.17%], Qurate Retail[5.06%], Gannett Co[4.79%], Research[4.61%]