
 Login Sign Up


| |||||
 |  | ||||

| 12Stocks.com Market Intelligence |
Best Consumer Services Stocks
| In a hurry? Services & Goods Stocks: Performance Trends Table, Stock Charts
Sort Consumer Services: Daily, Weekly, Year-to-Date, Market Cap & Trends. Filter Services & Goods stocks list by size: All Large Mid-Range Small |
| 12Stocks.com Consumer Services Stocks Performances & Trends Daily | |||||||||
|
|  The overall Smart Investing & Trading Score is 40 (0-bearish to 100-bullish) which puts Consumer Services sector in short term bearish to neutral trend. The Smart Investing & Trading Score from previous trading session is 47 and a deterioration of trend continues.
| ||||||||
Here are the Smart Investing & Trading Scores of the most requested Consumer Services stocks at 12Stocks.com (click stock name for detailed review):
|


| Consider signing up for our daily 12Stocks.com "Best Stocks Newsletter". You will never ever miss a big stock move again! |
| 12Stocks.com: Investing in Consumer Services sector with Stocks | |
|
The following table helps investors and traders sort through current performance and trends (as measured by Smart Investing & Trading Score) of various
stocks in the Consumer Services sector. Quick View: Move mouse or cursor over stock symbol (ticker) to view short-term Technical chart and over stock name to view long term chart. Click on  to add stock symbol to your watchlist and to add stock symbol to your watchlist and  to view watchlist. Click on any ticker or stock name for detailed market intelligence report for that stock. to view watchlist. Click on any ticker or stock name for detailed market intelligence report for that stock. |
12Stocks.com Performance of Stocks in Consumer Services Sector
| Ticker | Stock Name | Watchlist | Category | Recent Price | Smart Investing & Trading Score | Change % | Weekly Change% |
| FFIE | Faraday Future |   | Auto Manufacturers | 1.66 | 100 | 0.61% | 3,500.87% |
| AMC | AMC Entertainment | | Entertainment | 4.38 | 68 | -5.71% | 50.34% |
| WOOF | Petco Health | | Specialty Retail | 2.48 | 69 | 1.02% | 49.70% |
| HUYA | HUYA | | Entertainment | 6.01 | 100 | -1.96% | 36.59% |
| BIRD | Allbirds | | Apparel Retail | 0.74 | 62 | -3.30% | 29.07% |
| ONON | On Holding | | Footwear & Accessories | 37.76 | 100 | 3.06% | 24.21% |
| UCAR | U Power | | Auto & Truck Dealerships | 6.55 | 95 | -8.45% | 24.15% |
| CMLS | Cumulus Media | | Broadcasting | 3.30 | 60 | 16.20% | 23.60% |
| DESP | Despegar.com | | Lodging | 15.11 | 60 | 20.49% | 23.45% |
| EVGO | EVgo | | Specialty Retail | 2.29 | 55 | -3.18% | 22.85% |
| MOGU | MOGU | | Retail | 2.30 | 73 | -4.96% | 21.69% |
| GME | GameStop | | Retail | 21.13 | 68 | -23.64% | 21.02% |
| AMCX | AMC Networks | | Entertainment | 15.74 | 83 | -1.38% | 18.88% |
| YI | 111 | | Drug Stores | 1.35 | 62 | 0.75% | 18.42% |
| CDRO | Codere Online | | Gambling | 8.23 | 93 | 2.11% | 18.42% |
| GCI | Gannett Co | | Publishing | 3.73 | 100 | 4.93% | 16.04% |
| MMYT | MakeMyTrip | | Entertainment | 86.47 | 100 | 2.05% | 15.29% |
| BZUN | Baozun | | Retail | 3.12 | 90 | 0.97% | 13.87% |
| SFIX | Stitch Fix | | Retail | 2.38 | 42 | -0.63% | 13.10% |
| TISI | Team | | Services | 7.42 | 95 | 5.55% | 12.42% |
| JMIA | Jumia Technologies | | Retail | 6.72 | 80 | 0.90% | 11.81% |
| VSCO | Victorias Secret | | Apparel Retail | 21.89 | 42 | 0.88% | 11.74% |
| MLCO | Melco Resorts | | Casinos | 8.64 | 95 | 0.99% | 10.69% |
| EYE | National Vision | | Retail | 15.87 | 35 | -0.87% | 10.52% |
| BABA | Alibaba | | Retail | 88.45 | 100 | 2.02% | 10.51% |
| For chart view version of above stock list: Chart View ➞ 0 - 25 , 25 - 50 , 50 - 75 , 75 - 100 , 100 - 125 , 125 - 150 , 150 - 175 , 175 - 200 , 200 - 225 , 225 - 250 , 250 - 275 , 275 - 300 , 300 - 325 , 325 - 350 , 350 - 375 , 375 - 400 , 400 - 425 , 425 - 450 , 450 - 475 | ||
 | Click To Change The Sort Order: By Market Cap or Company Size Performance: Year-to-date, Week and Day |  |
|
Get the most comprehensive stock market coverage daily at 12Stocks.com ➞ Best Stocks Today ➞ Best Stocks Weekly ➞ Best Stocks Year-to-Date ➞ Best Stocks Trends ➞  Best Stocks Today 12Stocks.com Best Nasdaq Stocks ➞ Best S&P 500 Stocks ➞ Best Tech Stocks ➞ Best Biotech Stocks ➞ |
| Detailed Overview of Consumer Services Stocks |
| Consumer Services Technical Overview, Leaders & Laggards, Top Consumer Services ETF Funds & Detailed Consumer Services Stocks List, Charts, Trends & More |
| Consumer Services Sector: Technical Analysis, Trends & YTD Performance | |
| Consumer Services sector is composed of stocks
from retail, entertainment, media/publishing, consumer goods
and services subsectors. Consumer Services sector, as represented by XLY, an exchange-traded fund [ETF] that holds basket of Consumer Services stocks (e.g, Walmart, Alibaba) is down by -0.4% and is currently underperforming the overall market by -10.67% year-to-date. Below is a quick view of Technical charts and trends: |
|
 XLY Weekly Chart |
|
| Long Term Trend: Not Good | |
| Medium Term Trend: Very Good | |
 XLY Daily Chart |
|
| Short Term Trend: Not Good | |
| Overall Trend Score: 40 | |
| YTD Performance: -0.4% | |
| **Trend Scores & Views Are Only For Educational Purposes And Not For Investing | |
| 12Stocks.com: Top Performing Consumer Services Sector Stocks | ||||||||||||||||||||||||||||||||||||||||||||||||
 The top performing Consumer Services sector stocks year to date are
Now, more recently, over last week, the top performing Consumer Services sector stocks on the move are


|
||||||||||||||||||||||||||||||||||||||||||||||||
| 12Stocks.com: Investing in Consumer Services Sector using Exchange Traded Funds | |
|
The following table shows list of key exchange traded funds (ETF) that
help investors track Consumer Services Index. For detailed view, check out our ETF Funds section of our website. Quick View: Move mouse or cursor over ETF symbol (ticker) to view short-term Technical chart and over ETF name to view long term chart. Click on ticker or stock name for detailed view. Click on to add stock symbol to your watchlist and to view watchlist. |
12Stocks.com List of ETFs that track Consumer Services Index
| Ticker | ETF Name | Watchlist | Recent Price | Smart Investing & Trading Score | Change % | Week % | Year-to-date % |
| XLY | Consumer Discret Sel | | 178.09 | 40 | 0.17 | -0.01 | -0.4% |
| RTH | Retail | | 203.87 | 65 | -0.08 | 0.16 | 8.31% |
| IYC | Consumer Services | | 79.75 | 40 | -0.05 | 0.18 | 5.25% |
| XRT | Retail | | 75.82 | 37 | -0.93 | 1.94 | 4.84% |
| IYK | Consumer Goods | | 68.04 | 76 | -0.31 | 0.15 | 6.47% |
| UCC | Consumer Services | | 34.46 | 40 | -0.26 | -0.34 | -4.03% |
| RETL | Retail Bull 3X | | 9.61 | 37 | -2.98 | 5.09 | 5.32% |
| RXI | Globl Consumer Discretionary | | 164.58 | 47 | 0.49 | 0.97 | 3.47% |
| SCC | Short Consumer Services | | 15.39 | 68 | -0.26 | 0 | 0.43% |
| UGE | Consumer Goods | | 18.30 | 93 | -0.49 | 1.57 | 16.26% |
| 12Stocks.com: Charts, Trends, Fundamental Data and Performances of Consumer Services Stocks | |
|
We now take in-depth look at all Consumer Services stocks including charts, multi-period performances and overall trends (as measured by Smart Investing & Trading Score). One can sort Consumer Services stocks (click link to choose) by Daily, Weekly and by Year-to-Date performances. Also, one can sort by size of the company or by market capitalization. |
| Select Your Default Chart Type: | |||||
| |||||
| Click on stock symbol or name for detailed view. Click on to add stock symbol to your watchlist and to view watchlist. Quick View: Move mouse or cursor over "Daily" to quickly view daily Technical stock chart and over "Weekly" to view weekly Technical stock chart. | |||||

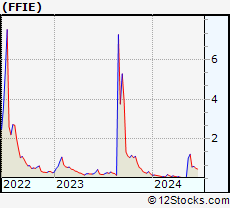 | FFIE Faraday Future Intelligent Electric Inc. |
| Sector: Services & Goods | |
| SubSector: Auto Manufacturers | |
| MarketCap: 268 Millions | |
| Recent Price: 1.66 Smart Investing & Trading Score: 100 | |
| Day Percent Change: 0.61% Day Change: 0.01 | |
| Week Change: 3500.87% Year-to-date Change: 619.6% | |
| FFIE Links: Profile News Message Board | |
| Charts:- Daily , Weekly | |
| Add FFIE to Watchlist: View: Get Complete FFIE Trend Analysis ➞ | |
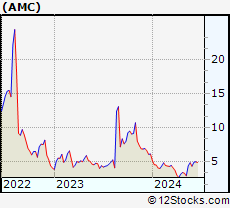 | AMC AMC Entertainment Holdings, Inc. |
| Sector: Services & Goods | |
| SubSector: Movie Production, Theaters | |
| MarketCap: 415.929 Millions | |
| Recent Price: 4.38 Smart Investing & Trading Score: 68 | |
| Day Percent Change: -5.71% Day Change: -0.26 | |
| Week Change: 50.34% Year-to-date Change: -28.5% | |
| AMC Links: Profile News Message Board | |
| Charts:- Daily , Weekly | |
| Add AMC to Watchlist: View: Get Complete AMC Trend Analysis ➞ | |
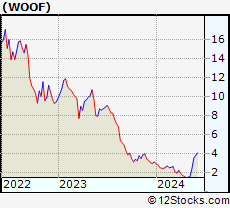 | WOOF Petco Health and Wellness Company, Inc. |
| Sector: Services & Goods | |
| SubSector: Specialty Retail | |
| MarketCap: 2030 Millions | |
| Recent Price: 2.48 Smart Investing & Trading Score: 69 | |
| Day Percent Change: 1.02% Day Change: 0.02 | |
| Week Change: 49.7% Year-to-date Change: -21.4% | |
| WOOF Links: Profile News Message Board | |
| Charts:- Daily , Weekly | |
| Add WOOF to Watchlist: View: Get Complete WOOF Trend Analysis ➞ | |
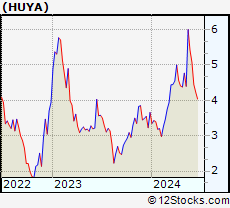 | HUYA HUYA Inc. |
| Sector: Services & Goods | |
| SubSector: Entertainment - Diversified | |
| MarketCap: 3358.17 Millions | |
| Recent Price: 6.01 Smart Investing & Trading Score: 100 | |
| Day Percent Change: -1.96% Day Change: -0.12 | |
| Week Change: 36.59% Year-to-date Change: 64.2% | |
| HUYA Links: Profile News Message Board | |
| Charts:- Daily , Weekly | |
| Add HUYA to Watchlist: View: Get Complete HUYA Trend Analysis ➞ | |
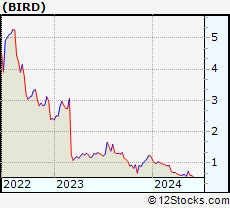 | BIRD Allbirds, Inc. |
| Sector: Services & Goods | |
| SubSector: Apparel Retail | |
| MarketCap: 184 Millions | |
| Recent Price: 0.74 Smart Investing & Trading Score: 62 | |
| Day Percent Change: -3.30% Day Change: -0.03 | |
| Week Change: 29.07% Year-to-date Change: -40.2% | |
| BIRD Links: Profile News Message Board | |
| Charts:- Daily , Weekly | |
| Add BIRD to Watchlist: View: Get Complete BIRD Trend Analysis ➞ | |
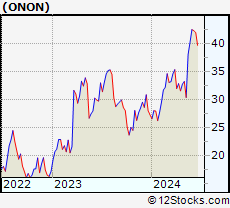 | ONON On Holding AG |
| Sector: Services & Goods | |
| SubSector: Footwear & Accessories | |
| MarketCap: 10600 Millions | |
| Recent Price: 37.76 Smart Investing & Trading Score: 100 | |
| Day Percent Change: 3.06% Day Change: 1.12 | |
| Week Change: 24.21% Year-to-date Change: 38.4% | |
| ONON Links: Profile News Message Board | |
| Charts:- Daily , Weekly | |
| Add ONON to Watchlist: View: Get Complete ONON Trend Analysis ➞ | |
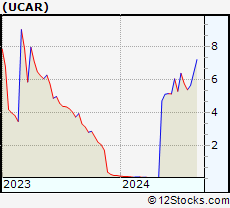 | UCAR U Power Limited |
| Sector: Services & Goods | |
| SubSector: Auto & Truck Dealerships | |
| MarketCap: 372 Millions | |
| Recent Price: 6.55 Smart Investing & Trading Score: 95 | |
| Day Percent Change: -8.45% Day Change: -0.61 | |
| Week Change: 24.15% Year-to-date Change: 3,557.9% | |
| UCAR Links: Profile News Message Board | |
| Charts:- Daily , Weekly | |
| Add UCAR to Watchlist: View: Get Complete UCAR Trend Analysis ➞ | |
 | CMLS Cumulus Media Inc. |
| Sector: Services & Goods | |
| SubSector: Broadcasting - Radio | |
| MarketCap: 128.695 Millions | |
| Recent Price: 3.30 Smart Investing & Trading Score: 60 | |
| Day Percent Change: 16.20% Day Change: 0.46 | |
| Week Change: 23.6% Year-to-date Change: -38.0% | |
| CMLS Links: Profile News Message Board | |
| Charts:- Daily , Weekly | |
| Add CMLS to Watchlist: View: Get Complete CMLS Trend Analysis ➞ | |
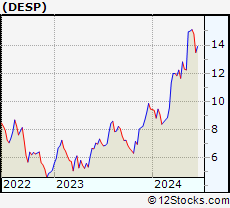 | DESP Despegar.com, Corp. |
| Sector: Services & Goods | |
| SubSector: Lodging | |
| MarketCap: 547.536 Millions | |
| Recent Price: 15.11 Smart Investing & Trading Score: 60 | |
| Day Percent Change: 20.49% Day Change: 2.57 | |
| Week Change: 23.45% Year-to-date Change: 59.7% | |
| DESP Links: Profile News Message Board | |
| Charts:- Daily , Weekly | |
| Add DESP to Watchlist: View: Get Complete DESP Trend Analysis ➞ | |
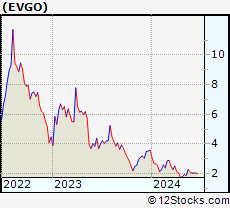 | EVGO EVgo, Inc. |
| Sector: Services & Goods | |
| SubSector: Specialty Retail | |
| MarketCap: 1140 Millions | |
| Recent Price: 2.29 Smart Investing & Trading Score: 55 | |
| Day Percent Change: -3.18% Day Change: -0.07 | |
| Week Change: 22.85% Year-to-date Change: -36.3% | |
| EVGO Links: Profile News Message Board | |
| Charts:- Daily , Weekly | |
| Add EVGO to Watchlist: View: Get Complete EVGO Trend Analysis ➞ | |
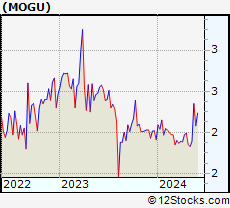 | MOGU MOGU Inc. |
| Sector: Services & Goods | |
| SubSector: Specialty Retail, Other | |
| MarketCap: 168.844 Millions | |
| Recent Price: 2.30 Smart Investing & Trading Score: 73 | |
| Day Percent Change: -4.96% Day Change: -0.12 | |
| Week Change: 21.69% Year-to-date Change: 20.4% | |
| MOGU Links: Profile News Message Board | |
| Charts:- Daily , Weekly | |
| Add MOGU to Watchlist: View: Get Complete MOGU Trend Analysis ➞ | |
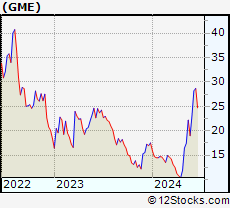 | GME GameStop Corp. |
| Sector: Services & Goods | |
| SubSector: Electronics Stores | |
| MarketCap: 257.8 Millions | |
| Recent Price: 21.13 Smart Investing & Trading Score: 68 | |
| Day Percent Change: -23.64% Day Change: -6.54 | |
| Week Change: 21.02% Year-to-date Change: 20.5% | |
| GME Links: Profile News Message Board | |
| Charts:- Daily , Weekly | |
| Add GME to Watchlist: View: Get Complete GME Trend Analysis ➞ | |
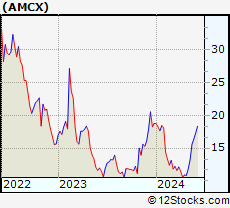 | AMCX AMC Networks Inc. |
| Sector: Services & Goods | |
| SubSector: Entertainment - Diversified | |
| MarketCap: 1477.37 Millions | |
| Recent Price: 15.74 Smart Investing & Trading Score: 83 | |
| Day Percent Change: -1.38% Day Change: -0.22 | |
| Week Change: 18.88% Year-to-date Change: -16.2% | |
| AMCX Links: Profile News Message Board | |
| Charts:- Daily , Weekly | |
| Add AMCX to Watchlist: View: Get Complete AMCX Trend Analysis ➞ | |
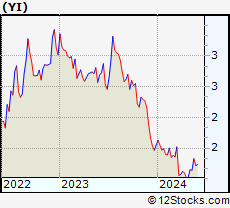 | YI 111, Inc. |
| Sector: Services & Goods | |
| SubSector: Drug Stores | |
| MarketCap: 520.351 Millions | |
| Recent Price: 1.35 Smart Investing & Trading Score: 62 | |
| Day Percent Change: 0.75% Day Change: 0.01 | |
| Week Change: 18.42% Year-to-date Change: -12.9% | |
| YI Links: Profile News Message Board | |
| Charts:- Daily , Weekly | |
| Add YI to Watchlist: View: Get Complete YI Trend Analysis ➞ | |
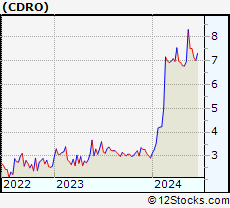 | CDRO Codere Online Luxembourg, S.A. |
| Sector: Services & Goods | |
| SubSector: Gambling | |
| MarketCap: 159 Millions | |
| Recent Price: 8.23 Smart Investing & Trading Score: 93 | |
| Day Percent Change: 2.11% Day Change: 0.17 | |
| Week Change: 18.42% Year-to-date Change: 181.9% | |
| CDRO Links: Profile News Message Board | |
| Charts:- Daily , Weekly | |
| Add CDRO to Watchlist: View: Get Complete CDRO Trend Analysis ➞ | |
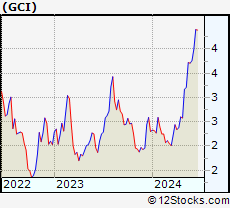 | GCI Gannett Co., Inc. |
| Sector: Services & Goods | |
| SubSector: Publishing - Newspapers | |
| MarketCap: 222.322 Millions | |
| Recent Price: 3.73 Smart Investing & Trading Score: 100 | |
| Day Percent Change: 4.93% Day Change: 0.18 | |
| Week Change: 16.04% Year-to-date Change: 62.0% | |
| GCI Links: Profile News Message Board | |
| Charts:- Daily , Weekly | |
| Add GCI to Watchlist: View: Get Complete GCI Trend Analysis ➞ | |
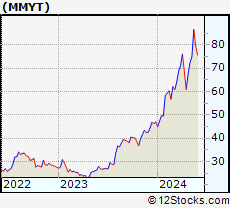 | MMYT MakeMyTrip Limited |
| Sector: Services & Goods | |
| SubSector: General Entertainment | |
| MarketCap: 1429.59 Millions | |
| Recent Price: 86.47 Smart Investing & Trading Score: 100 | |
| Day Percent Change: 2.05% Day Change: 1.74 | |
| Week Change: 15.29% Year-to-date Change: 84.1% | |
| MMYT Links: Profile News Message Board | |
| Charts:- Daily , Weekly | |
| Add MMYT to Watchlist: View: Get Complete MMYT Trend Analysis ➞ | |
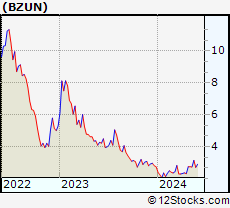 | BZUN Baozun Inc. |
| Sector: Services & Goods | |
| SubSector: Catalog & Mail Order Houses | |
| MarketCap: 1668.92 Millions | |
| Recent Price: 3.12 Smart Investing & Trading Score: 90 | |
| Day Percent Change: 0.97% Day Change: 0.03 | |
| Week Change: 13.87% Year-to-date Change: 13.9% | |
| BZUN Links: Profile News Message Board | |
| Charts:- Daily , Weekly | |
| Add BZUN to Watchlist: View: Get Complete BZUN Trend Analysis ➞ | |
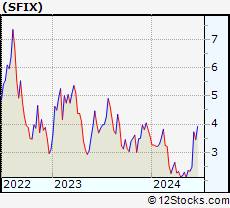 | SFIX Stitch Fix, Inc. |
| Sector: Services & Goods | |
| SubSector: Specialty Retail, Other | |
| MarketCap: 1693.64 Millions | |
| Recent Price: 2.38 Smart Investing & Trading Score: 42 | |
| Day Percent Change: -0.63% Day Change: -0.02 | |
| Week Change: 13.1% Year-to-date Change: -33.5% | |
| SFIX Links: Profile News Message Board | |
| Charts:- Daily , Weekly | |
| Add SFIX to Watchlist: View: Get Complete SFIX Trend Analysis ➞ | |
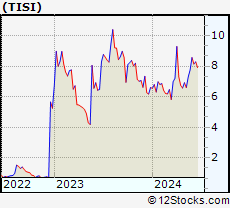 | TISI Team, Inc. |
| Sector: Services & Goods | |
| SubSector: Business Services | |
| MarketCap: 284.982 Millions | |
| Recent Price: 7.42 Smart Investing & Trading Score: 95 | |
| Day Percent Change: 5.55% Day Change: 0.39 | |
| Week Change: 12.42% Year-to-date Change: 12.4% | |
| TISI Links: Profile News Message Board | |
| Charts:- Daily , Weekly | |
| Add TISI to Watchlist: View: Get Complete TISI Trend Analysis ➞ | |
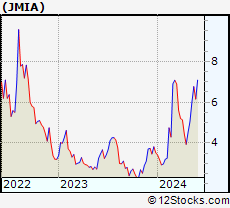 | JMIA Jumia Technologies AG |
| Sector: Services & Goods | |
| SubSector: Specialty Retail, Other | |
| MarketCap: 203.644 Millions | |
| Recent Price: 6.72 Smart Investing & Trading Score: 80 | |
| Day Percent Change: 0.90% Day Change: 0.06 | |
| Week Change: 11.81% Year-to-date Change: 90.4% | |
| JMIA Links: Profile News Message Board | |
| Charts:- Daily , Weekly | |
| Add JMIA to Watchlist: View: Get Complete JMIA Trend Analysis ➞ | |
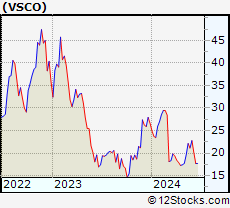 | VSCO Victorias Secret & Co. |
| Sector: Services & Goods | |
| SubSector: Apparel Retail | |
| MarketCap: 1340 Millions | |
| Recent Price: 21.89 Smart Investing & Trading Score: 42 | |
| Day Percent Change: 0.88% Day Change: 0.19 | |
| Week Change: 11.74% Year-to-date Change: -17.8% | |
| VSCO Links: Profile News Message Board | |
| Charts:- Daily , Weekly | |
| Add VSCO to Watchlist: View: Get Complete VSCO Trend Analysis ➞ | |
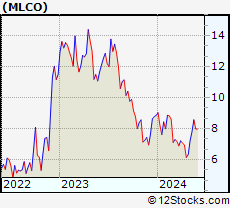 | MLCO Melco Resorts & Entertainment Limited |
| Sector: Services & Goods | |
| SubSector: Resorts & Casinos | |
| MarketCap: 7031.14 Millions | |
| Recent Price: 8.64 Smart Investing & Trading Score: 95 | |
| Day Percent Change: 0.99% Day Change: 0.08 | |
| Week Change: 10.69% Year-to-date Change: -2.5% | |
| MLCO Links: Profile News Message Board | |
| Charts:- Daily , Weekly | |
| Add MLCO to Watchlist: View: Get Complete MLCO Trend Analysis ➞ | |
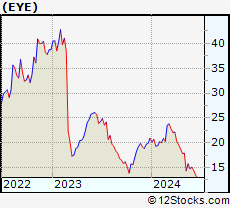 | EYE National Vision Holdings, Inc. |
| Sector: Services & Goods | |
| SubSector: Specialty Retail, Other | |
| MarketCap: 1290.84 Millions | |
| Recent Price: 15.87 Smart Investing & Trading Score: 35 | |
| Day Percent Change: -0.87% Day Change: -0.14 | |
| Week Change: 10.52% Year-to-date Change: -24.2% | |
| EYE Links: Profile News Message Board | |
| Charts:- Daily , Weekly | |
| Add EYE to Watchlist: View: Get Complete EYE Trend Analysis ➞ | |
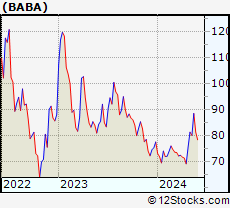 | BABA Alibaba Group Holding Limited |
| Sector: Services & Goods | |
| SubSector: Specialty Retail, Other | |
| MarketCap: 522666 Millions | |
| Recent Price: 88.45 Smart Investing & Trading Score: 100 | |
| Day Percent Change: 2.02% Day Change: 1.75 | |
| Week Change: 10.51% Year-to-date Change: 14.1% | |
| BABA Links: Profile News Message Board | |
| Charts:- Daily , Weekly | |
| Add BABA to Watchlist: View: Get Complete BABA Trend Analysis ➞ | |
| For tabular summary view of above stock list: Summary View ➞ 0 - 25 , 25 - 50 , 50 - 75 , 75 - 100 , 100 - 125 , 125 - 150 , 150 - 175 , 175 - 200 , 200 - 225 , 225 - 250 , 250 - 275 , 275 - 300 , 300 - 325 , 325 - 350 , 350 - 375 , 375 - 400 , 400 - 425 , 425 - 450 , 450 - 475 | ||
| Click To Change The Sort Order: By Market Cap or Company Size Performance: Year-to-date, Week and Day | |
| Select Chart Type: | ||
|
Best Stocks Today 12Stocks.com |
© 2024 12Stocks.com Terms & Conditions Privacy Contact Us
All Information Provided Only For Education And Not To Be Used For Investing or Trading. See Terms & Conditions


One More Thing ... Get Best Stocks Delivered Daily!
Never Ever Miss A Move With Our Top Ten Stocks Lists
Find Best Stocks In Any Market - Bull or Bear Market
Take A Peek At Our Top Ten Stocks Lists: Daily, Weekly, Year-to-Date & Top Trends
Find Best Stocks In Any Market - Bull or Bear Market
Take A Peek At Our Top Ten Stocks Lists: Daily, Weekly, Year-to-Date & Top Trends
Consumer Services Stocks With Best Up Trends [0-bearish to 100-bullish]: Gannett Co[100], On Holding[100], Outbrain [100], Tractor Supply[100], MakeMyTrip [100], Alibaba [100], Pinduoduo [100], McKesson [100], Baker Hughes[100], Carriage Services[100], Boot Barn[100]
Best Consumer Services Stocks Year-to-Date:
U Power[3557.92%], Vroom [1795.41%], Faraday Future[619.55%], Yatsen Holding[509.62%], Fluent [422.39%], Zhihu [339.93%], Sweetgreen [182.21%], Codere Online[181.85%], Research[145.77%], Carvana Co[119.95%], RealReal [111.69%] Best Consumer Services Stocks This Week:
Faraday Future[3500.87%], AMC Entertainment[50.34%], Petco Health[49.7%], HUYA [36.59%], Allbirds [29.07%], On Holding[24.21%], U Power[24.15%], Cumulus Media[23.6%], Despegar.com [23.45%], EVgo [22.85%], MOGU [21.69%] Best Consumer Services Stocks Daily:
Despegar.com [20.49%], Cumulus Media[16.20%], Golden Heaven[12.00%], Zhihu [6.12%], Dada Nexus[5.77%], Team [5.55%], Gannett Co[4.93%], CompX [4.57%], Citi Trends[4.33%], Boqii Holding[4.29%], CareDx [4.24%]